

IT’S NORMALLY LIKE THIS 261
As with most worthwhile things in life, this is harder to describe than to do. Once you are
familiar with the principles, it is really very useful. In the next few pages, I will look at some
practical applications.
You have just read about a wonderful tool. Used correctly it adds rigour to
your analysis and credibility to your business plan. There are two traps. First,
beware of assuming that your set of possible outcomes is bell shaped. If it is
skewed or jagged the normal does not work. Second, do not allow this tool to give
your estimates and forecasts a spurious sense of meaning and accuracy. The only
thing that is certain about the future is uncertainty.
t
Box A: Seven steps to deviation
(Using Figure 11.2)
Procedure Example Your own
calculations
1 Make your most likely forecast or
estimate
Say, 150 units of your
product
2 Make a second forecast or estimate –
perhaps a worst-case scenario
Say, 124
3 Estimate the probability of the
second situation arising
Say, 10%
4 Find a figure in column B or C that is
closest to your answer to step 3
9.68%
5 Read off the corresponding z score
from column A.
z score = 1.3
6 Find the difference between your
answers to steps 1 and 2
150 – 124 = 26
7 Divide the answer to step 6 by the
answer to step 5
26 ÷ 1.3 = 20
The answer to step 7 is your standard
deviation
Standard deviation
= 20

262 CHAPTER 11 MANAGING RISKS
Box B: Four steps to a score
Procedure Example Your own
calculations
1 Identify your average or most likely
forecast or estimate
Say, 150 units of your
product
2 Select the value that you want to
convert to a z score
Say, 124
3 Subtract step 2 from step 1 150 – 124 = 26
4 Divide step 4 by the standard deviation 26 ÷ 20 = 1.3
The answer to step 4 is your z score z score = 1.3
Box C: Five steps from likelihood to outcome
(Using Figure 11.2)
Procedure Example Your own
calculations
1 Think of a percentage Say, 90% on one side of
the centre
2 Find a figure in column B or C that
is closest to your answer in step 1
90.32
3 Read off the associated z score z score = 1.3
4 Multiply step 2 by the standard
deviation
1.3 x 20 = 26
5 The result of step 3 is the distance
from the central value
150 + 26 = 176 and
150 – 26 = 124
Use common sense to interpret the
result
90% of values are 176 or
lower and 90% of values
are 124 or above
IT’S NORMALLY LIKE THIS 263
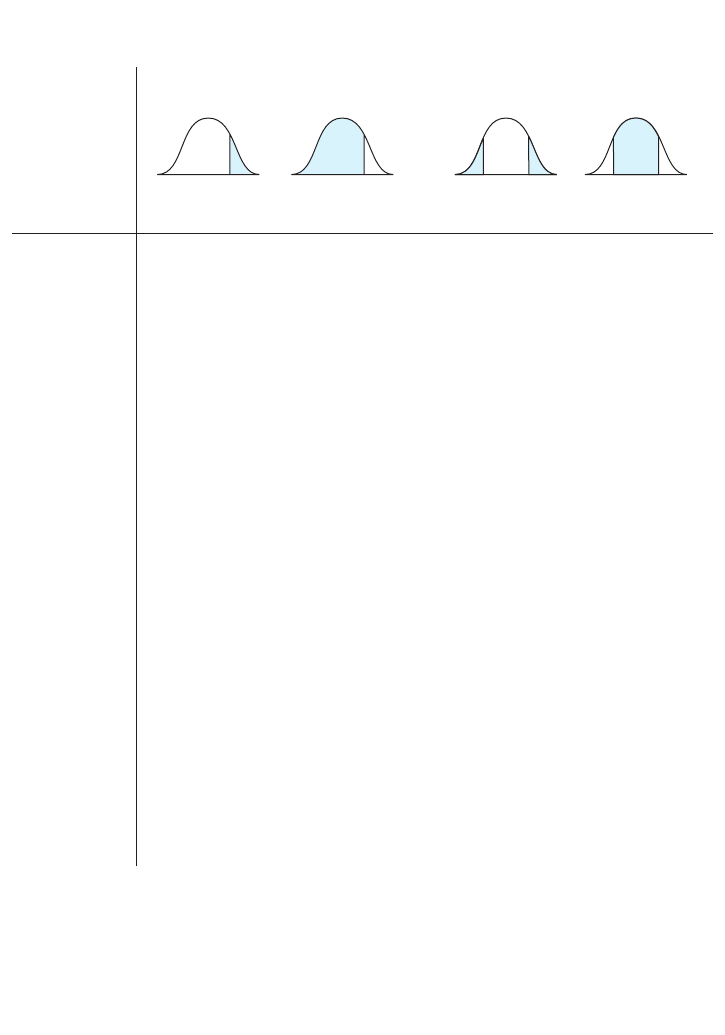
Showing percentage of distribution in the shaded areas
Figure 11.2 Z scores
Column A Column B Column C Column D Column E
Your focus is on one side Your focus is on the middle
or both ends
z score % in tail % before tail % in tails % in middle
0.0 50.00 50.00 100.00 0.00
0.1 46.02 53.98 92.04 7.96
0.2 42.07 57.93 84.14 15.86
0.3 38.21 61.79 76.42 23.58
0.4 34.46 65.54 68.92 31.08
0.5 30.85 69.15 61.70 38.30
0.6 27.43 72.57 54.86 45.14
0.7 24.20 75.80 48.40 51.60
0.8 21.19 78.81 42.38 57.62
0.9 18.41 81.59 36.82 63.18
1.0 15.87 84.13 31.74 68.26
1.1 13.57 86.43 27.14 72.86
1.2 11.51 88.49 23.02 76.98
1.3 9.68 90.32 19.36 80.64
1.4 8.08 91.92 16.16 83.84
1.5 6.68 93.32 13.36 86.64
1.6 5.48 94.52 10.96 89.04
1.7 4.46 95.54 8.92 91.08
1.8 3.59 96.41 7.18 92.82
1.9 2.87 97.13 5.74 94.26
2.0 2.28 97.72 4.56 95.44
2.1 1.79 98.21 3.58 96.42
2.2 1.39 98.61 2.78 97.22
2.3 1.07 98.93 2.14 97.86
2.4 0.82 99.18 1.64 98.36
2.5 0.62 99.38 1.24 98.76
2.6 0.47 99.53 0.94 99.06
2.7 0.35 99.65 0.70 99.30
2.8 0.26 99.74 0.52 99.48
2.9 0.19 99.81 0.38 99.62
3.0 0.14 99.86 0.28 99.72
3.1 0.10 99.90 0.20 99.80
For any value ‘value’ from a set of values with a given mean and standard deviation:
z = (value – mean) ÷ standard deviation
Value = (z × standard deviation) + mean
Mean = value – (z × standard deviation)
Standard deviation = (value – mean) ÷ z
..................Content has been hidden....................
You can't read the all page of ebook, please click here login for view all page.