

APPENDIX 341
Appendix:
Tetrylus Inc business plan
MegaProjects I nc Doc no BP02 08.01 30 Oc t 2002 B usiness Plan
Con tent s
Preliminary details
Contact information ........................................................................3
Professional advisers.......................................................................3
Definitions.......................................................................................3
Document control............................................................................3
Legal notice.....................................................................................3
Executive summary ..................................................................................4
Current situation ......................................................................................5
Basic corporate data ........................................................................5
Vision, mission, values....................................................................5
History and current status ...............................................................5
Organisation and management........................................................6
Infrastructure...................................................................................6
Products and Services .....................................................................6
Core competencies ..........................................................................6
Market analysis.........................................................................................7
The Industry ....................................................................................7
Our market ......................................................................................7
Competitors.....................................................................................7
Competitive advantages ..................................................................7
Strategy and plans....................................................................................8
Objectives........................................................................................8
Strategy ...........................................................................................8
Operating plan.................................................................................8
Sales forecasts ...........................................................................................9
Sales volumes..................................................................................9
Production costs ..............................................................................9
Pricing .............................................................................................9
Gross profit from sales ....................................................................9
Financial analysis ...................................................................................10
Breakeven......................................................................................10
Capital spending............................................................................10
Staff costs......................................................................................10
Other operating costs ....................................................................10
Income statement/profit and loss account .....................................11
Balance sheet.................................................................................11
Cash flow and funding requirements.............................................11
Valuation .......................................................................................11
Risk analysis............................................................................................12
SWOT – strengths, weaknesses, opportunities and threats...........12
Critical succes factors ...................................................................12
Limiting factors.............................................................................12
Specific risks and their solutions...................................................12
Alternative scenarios.....................................................................12
Sensitivity analysis........................................................................12
Conclusion...............................................................................................13
Annexes....................................................................................................14
A. Detailed financial data..............................................................14
B. Biographies for the top management........................................20
1. Cover See Chapter 2, p.32 2. Contents See Chapter 3, p.46
This appendix contains pages from a sample business plan. Your plan may have differ-
ent headings and may be arranged in a different order, as discussed in the book. Each
page below is cross-referenced to the appropriate chapter of this book and, if applicable,
to the closest matching figure in that chapter. To receive the address of the supporting
website which contains this sample business plan, send a blank email to defbizplan@
business-minds.com
342 APPENDIX
Basic cor porate data
Name of Company: Tetrylus Inc
Status: International business company
Incorporated in the British
Virgin Islands (BVI) on 29
February 2010.
Capital Authorized: 10,000 ordinary $1 shares.
Issued: One $1 share to Niccolò
Machiavelli
Registered Office: Frond Chambers, Tortola, BVI.
Company no: IBC—3471231
Head Office: 2010 Boston Road, Guesswhere
Vision
Tetrylus is dedicated to becoming the world-leader in industrial health and
safety equipment …
Mission
Tetrylus mission is to provide excellent industrial health-and-safety
computer systems in Asia-Pacific. We aim to establish a 5% market share
within the next three years, taking sales to over $15 million a year, and net
profits to more than $6 million. We will list on NASDAQ by year five.
During this time period, we will comply with ISO 13000 environmental
standards, provide first-class career development for employees, reduce the
maximum customer-response time to one hour, and work closely with our
shareholders to meet their other objectives.
Company values
We will operate within strict legal and ethical guidelines … We will not test
our product on animals … We will nurture our employee-team and will
introduce measures to promote job satisfaction …
Brief history and current status
Tetrylus is in a start-up situation. We have successfully completed one pilot
project that …
Current financial data
The summary below shows that … Financial forecasts are included in the
Financial analysis on pages 11 and full historical and forecast data are at
Annex A.
Executive Summary
Tetrylus is offering 40% of its authorized share capital for $1.25m. This is the
amount of additional funding that we need to meet orders for our unique industrial
computer system and generate net profits of $6m a year by 2013. We are
positioning Tetrylus for an initial public offering in that year at an expected market
capitalization of $60m. This Business Plan sets out our strategic, operating and
financial ...
The Company
Tetrylus was incorporated in February 2010 with issued share capital of $10,000.
The founder, Niccolò Machiavelli, is well known for his strategic management.
He is supported by René Descartes as Head of Technology. René is famous for his
powers of reasoning and he brings important experience from his previous post as
Head of …
The Product
Tetrylus ONE is a package of computer hardware and software that reduces
accidents in dangerous working environments and cuts the cost of complying with
health and safety regulations. Our first users include major petroleum, mining and
construction companies. They recover their full investment in the system within
ten months …
Corporate strategy
Pilot sales confirm that our strategy will be successful. There are five key elements
to our strategy …
Financial projections
Net profit is projected at … Cash flow will turn positive by month 15 and the
potential surplus will reach … Funding requirements peak at … On a realistic
appraisal … pushing the potential return on equity to …
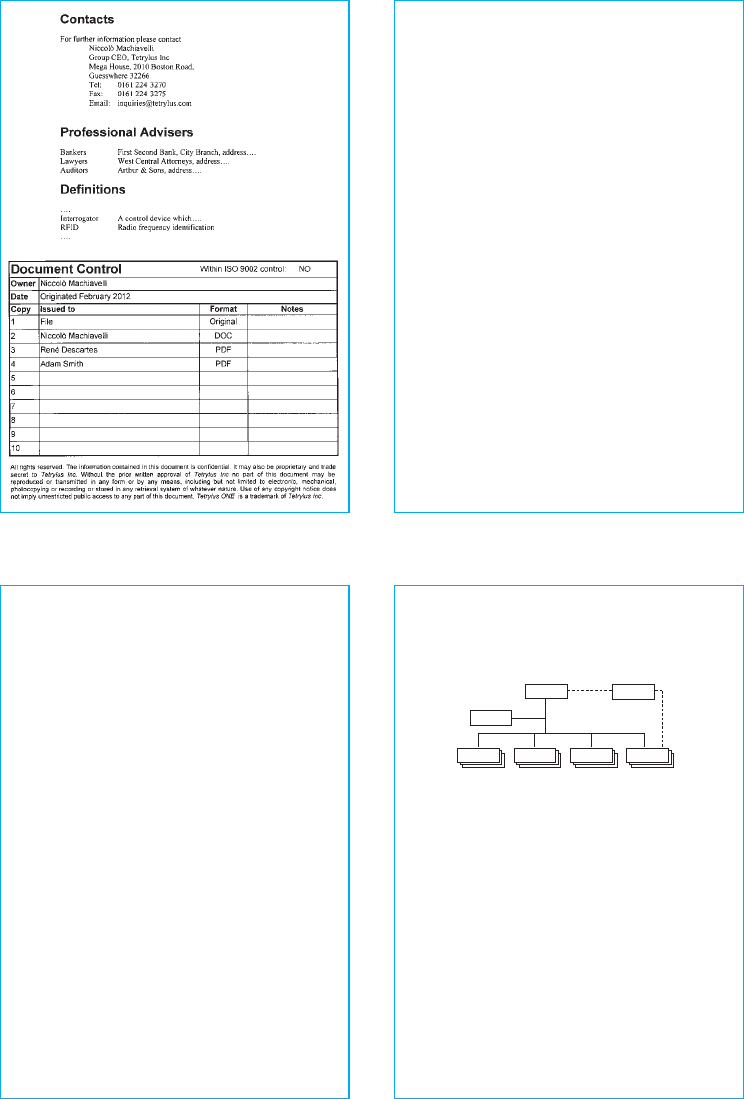
O r g a n i s a t i o n a n d man a g e m e nt
The management team comprises six professionals with appropriate
qualifications, solid experience, and complementary skills. They have
worked together previously and demonstrated their ability to … Short
résumés are below and detailed biographies are at Annex B.
Organization chart for Tetrylus Inc
Production
Our Production Department is headed by Adam Smith. He was one of the
first experts to identify the benefits of specialisation and can produce pins
(for identification badges) better than anyone else …
Sales
Karl Marx is in charge of Sales. His recognized ability to identify and satisfy
customers’ needs provides us with a significant competitive advantage. His
deputy, Karl Popper, has shown that sales forecasts cannot be proved to be
accurate but can be disproved …
Infrastr uct ure
Tetrylus is currently operating from the founders’ garage. We
have
negotiated a lease for office premises in the Millennium Industrial Park. We
will relocate in the first month of our start-up phase. The office is ideally
situated close to suppliers, customers and the airport …
P r o d u c t s
Our launch product is Tetrylus ONE – an automated tracking system for
remotely tracking employees in hazardous working environments. The
system comprises a computer software application, radio-frequency network
cards and identification badges with built-in transmitters …
The software is licensed from Arthur Andy and Son, a major international
consulting house. The software is running … The identification badges are
modified versions of badges currently produced by …
C o r e c o m p e t e n c i e s
A review of the current situation analysis shows that we have developed core
competencies in the following areas …
N. Machiavelli
CEO
Pythagoras
Quality
Rene Descartes
R&D
Adam Smith
Production
Karl Mare
Sal es
David Hume
Administration
Audit
Committee
3. Preliminaries See Chapter 2, p.36 4. Executive Summary See Chapter 3, p.48
5. Current situation See Chapter 4, p.64
6. Current situation (continued)
See Chapter 4, p.75

APPENDIX 343
Market A nalysis
The industry
The product class is industrial health and safety monitoring and compliance
equipment (HSMCE). There are two product categories: non-automated and
computerized. Tetrylus is in the latter category …
Our market
The market divides into six segments. There are three industry types
(construction, mining and petroleum) each divided into large and small
companies (the boundary being 2000 manual workers and above). Tetrylus
is targeting primarily large petroleum companies. The other large companies
are secondary targets for us, but are not ruled out. Small companies are
currently not viable prospects on cost grounds …
Tetrylus is operating in Asia-Pacific. Mining and petroleum companies have
fairly homogeneous buying characteristics throughout the region, but the
construction industry is more fragmented. Hong Kong and China …
Competitors
Four major international competitors are operating within our territory.
Together they dominated 94% of the market last year, as Table 2 indicates:
Table 2. Asia-Pacific HSMCE sales by competitor
Company Sales, $m Market share, %
Pacific Link 166 46
Atlantic Watch 87 24
Indian Continental 74 20
Arctic Assets 13 4
Other 21 5
SafeTRAK 1 1
Total 362 100
However, when taken by market segment the picture is rather different.
HSMCE sales by competitor, market segment, and territory are shown in
Table 3…
Competitive advantages
Our research indicates that there are four areas where Tetrylus ONE has
distinct competitive advantages. These are …
By exploiting these advantages we can construct effective barriers to entry
which will deter competitors from trying to enter our prime market until …
Sales fore c a s t s
Tetrylus ONE reduces the number of accidents at work and cuts the cost
of complying with health and safety legislation. Companies will recover in
10 months their entire initial investment in buying the hardware, licensing
the software and implementing the system. Moreover …
Sales volumes
The limiting factor on sales volumes might be our ability to implement
enough systems in a given period of time. We can solve this by selling
through ISPs and using their technical staff to implement our systems for
end-users. This cuts our resource requirements and reduces the sales cycle
(since ISP’s will leverage existing customer relationships). Moreover, we are
increasing the incentive for ISPs to re-sell Tetrylus ONE by allowing them to
earn a high margin on the product while also earning from sales of their
consulting and implementation services.
….
We have already appointed three ISPs, and we expect to recruit one more this
year. We will continue to add ISPs – until we have 20 in year 5. We are
working with current ISPs to develop specific prospective sales. We have
three pilot sales at contract-negotiation stage, and we will make a total of
four sales during this year …
Our target is to sell an average of 2500 Tetrylus ONE identity badges with
each sale by year 3. Initial sales will be smaller because …
Production costs
TechnoWhiz will produce identity badges for us. This will reduce the
resources that we require and limit our manufacturing risks – TechnoWhiz
have already produced prototypes that meet or exceed our quality
specifications. Initial costs of $50 a badge will fall to $23 in year 2. Our
projected volumes allow …
Pricing
Longer-term, sales will average a little over $100 000 per package. Pilot
sales aimed at establishing references sites will be smaller values. The
following table shows the composition of a Tetrylus ONE package …
Gross profit from sales
The following table indicates that gross profit from sales will reach …
Busine s s strategy
Objectives
Our strategic objectives are as follows:
1. Annual sales volumes in the range shown in Table 16, column D.
2. Completion of modifications to hardware as described in Table 17 by
the dates indicated.
3. Completion of modifications to software as described in Table 17 by
the dates indicated.
4. …
Strategy
The market analysis on page 7 indicates that we can take advantage of an
unexploited market niche – automated safety systems for large petroleum
companies operating in Asia-Pacific. The main countries …
We were the first to spot the gap in the market and our exclusive licence for the
identification badge locks out the main competitors. We estimate that there will
be a 15-month time lag before they are in a position to compete… by which time
we have achieved critical mass and the market will be unattractive to them for
the reasons explained … We will also use the revenue from the first sales to
develop …
In essence, our strategy is to:
• Work with ISPs to enable fast deployment of our system using their rela-
tionships and resources. We have signed exclusive agreements with …
• Pursue the strategic sales indicated Table 16, column C that will take us
to critical mass most-rapidly and lock out the major competitors.
• Use revenue for the initial sales to erect barriers to entry as shown in …
Operating plan
There are three main elements to our operating plan, relating to production,
marketing and sales, and administrative support. These are considered in
the following paragraphs …
Production …
Marketing and Sales …
Administrative Support
Fin ancial an alysis
B r e a k e v e n
We pass break even when we sell more than 124 Tetrylus ONE packages at
a minimum price of $95 000 each …
We believe that we can comfortably achieve this break even level even on a
worst case scenario with …
Capital Spending
Production of Tetrylus ONE requires the following equipment … We will
minimise capital outlays by leasing … but we need to own the … for the
strategic opportunities outlined on page 195.
Staff costs
Our major operating costs relate to staffing the … To minimise our
commitments while sales are being established we will sub-contract …
Other operating costs
Table 20 shows that the largest non-staff operating costs are …
7. Market analysis See Chapter 5, p.106 8. Strategy and operating plan
See Chapter 6, p.128
9. Sales forecasts See Chapter 8, p.185 10. Financial analysis
See Chapter 11, p.280
344 APPENDIX
Income statement/profit & loss account
The revenues and costs described above are brought together in the profit
and loss account in Table 12 (full details are in Annex A). The $1.4m net
loss in year 1 reduces to $0.2m in year 2 and turns to a net profit of $3.8m
by year 3. Sales could …
Balance sheet
A summarized balance sheet is shown in Table 13 (full details are in Annex
A). By year 5, retained earnings exceed $12m and net asset value is …
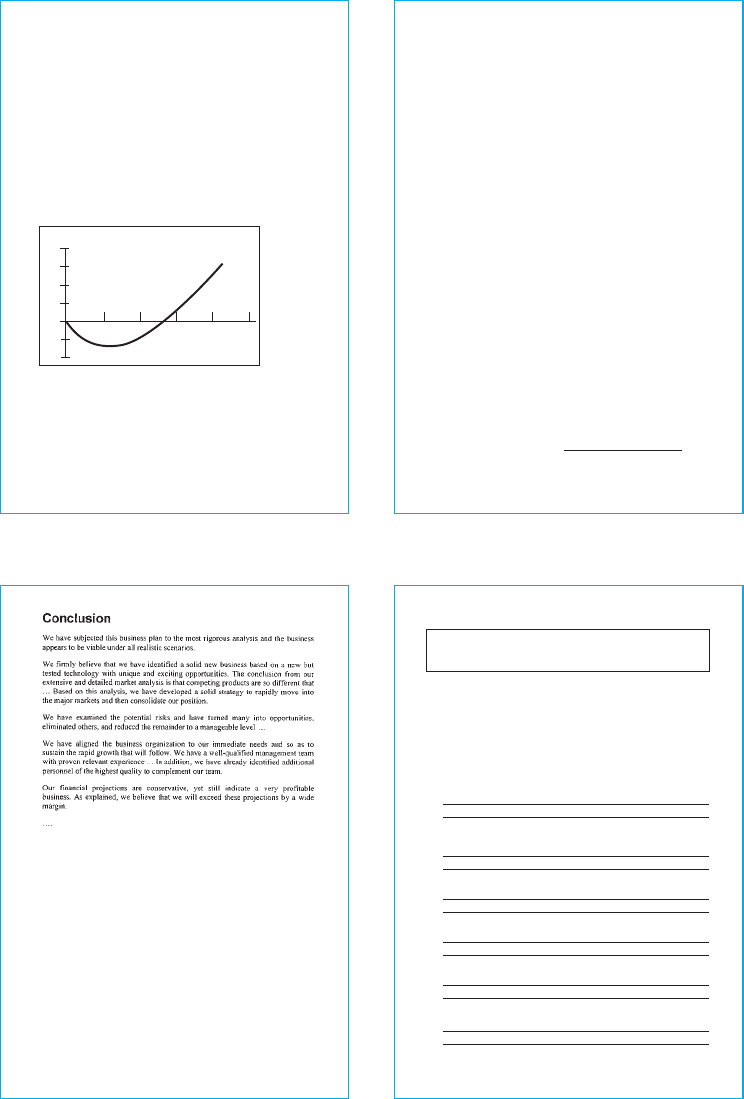
Cash flow and funding requirements
The following chart illustrates our cumulative cash flow projection
(Detailed figures are in Annex A). Monthly cash inflows start to exceed
outflows by month 14 and we move into a surplus by month 30. Our
maximum funding requirement is $1.25 million …
…
Valuation
On a modest price earnings multiple of 10, the implied market value of the
equity capital will be nearly $40m by year 3 … This would represent a
potential return on investment of … Also …
Cumulative cash flow project ion
Year 1 Year 2 Year 3 Year 4 Year 5
$4m
3
2
1
0
–1
–2
RISK assessm e n t
SWOT
We have analysed our strengths and weaknesses, and the opportunities for
and threats to the business. The key items are listed below, each with a note
explaining how we will cope with, or exploit, the issue …
Critical success factors
We have determined that we must achieve the following targets in order to
move our strategy forward. Most critical is the need to source … We are
implementing a four-step program to ensure that we meet the requirements
… The first step is to …
Limiting factors
There are two things which could limit our sales in year one and … First,
there is a constraint on the amount of … that we can source until we have …
Of course, these limits are way beyond the sales volumes that we can
reasonably hope to achieve. Moreover, …
Specific risks and their solutions
There are eight specific risks to which we should draw attention … We have
strategies to deal with each of these risks, as described below.
Production. Tetrylus ONE has been successfully prototyped and the
feasibility and cost of the manufacturing process is known. The
manufacturing is undertaken by a company with quality procedures that
meet ISO 9002 standards, and we will conduct our own quality control
sampling at their premises … The one remaining uncontrollable factor
affecting production is the availability and price of silicon on the world
market which …
Alternative scenarios
Our sales forecasts, and projected revenues, costs, and financial statements
are based on the lower-end of our most-likely scenario.
As already discussed, there is a range of possible outcomes dependent on a
wide range of factors both within and outside of our control. Accordingly,
this plan includes two alternative scenarios showing how the business will
develop under varying conditions. The low-income scenario assumes that
certain unlikely events depress production, sales and prices by … Our
calculations show that we still break even at … and … . We also include a
high-income scenario to show how net profit will rise sharply if …
Sensitivity analysis
The following table shows our assessment of the effects of a 1% increase in
key variables. A 1% decline will have approximately the opposite effect.
You may use this table to assess your own scenarios.
Wil l change thes e by
A 1 % i ncr ea s e i n Ne t pr of it B o r r ow in g R O E
$000 $000 %
Sales volume +167 –83 + 3.3
Sales price +134 –57 +2.7
Marketing expenditure +15 – 8 +0.3
Raw material prices –59 +30 –1.2
Labou r costs –23 +12 –0.5
Other costs –12 +5 –0.2
ANNE X A.1 Production & sales
Note: Depending on the purpose of your plan, you will almost certainly need to include projections
for a longer time period than the six months shown here. You may want to show details for the first
few months of the future period, and perhaps annual figures for three to five years ahead. You will
also include historical figures if the business is already in existence.
T e tr y l u s I n c F i n a nc i a l p l a n
P r od u c ti o n & s al e s , f i rs t 6 m o nt h s
Dollars
Month 1 Month 2 Mont h 3 Month 4 Month 5 Month 6
G-1 Co st s an d prices
G-2 Production cost, per unit 0 50 50 50 50 50
G-3 Sales price, per unit 0 7 8 7 8 78 7 8 78
G-4
G-5 Inventory vo lume
G-6 Opening stock (prev 9) 0 0 300 80 0 350 8 50
G-7 Addition (production volume) 0 500 500 0 500 0
G-8 Reduction (sales volume) 0 –200 0 –450 0 –600
G-9 Cl os in g stocks (6 + 7 + 8) 0 300 800 3 50 85 0 250
G- 10
G- 11 Inventory value
G- 12 Opening stock (prev 15) 0 0 15 000 40 000 17 500 42 500
G- 13 Addition (line 2 x line 7) 0 25 000 25 000 0 25 000 0
G- 14 Reduction (line 2 x line 8) 0 –10 000 0 –22 500 0 –30 000
G- 15 Clo sing stoc k (12 + 13 + 14) 0 15 000 4 0 000 17 500 42 500 1 2 500
G- 16
G- 17 Gr os s s a l e s
G- 18 Hardware (line 3 x line 8) 0 15 60 0 0 35 100 0 46 800
G- 19 Software 0 4 400 0 4 9 00 0 3 200
G- 20 Tota l sales (lines 18 + 19) 0 20 000 0 40 000 0 50 000
G- 21
G- 22 Cos t of s al es
G- 23 Hardwar e (line 2 x line 8) 0 10 000 0 22 500 0 30 000
G- 24 Software (from software) 0 3 591 0 4 683 0 3 979
G- 25 Total cos t (lines 23 + 24) 0 13 591 0 27 183 0 33 979
G- 26
G- 27 Gr os s p r o f it , %
G- 28 Hardwar e (line 18 – line 23) 0 5 600 0 12 600 0 16 800
G- 29 Software (line 19 – line 24) 0 80 9 0 2 17 0 –779
G- 30 Total (lines 28 + 29) 0 6 409 0 12 817 0 16021
G- 31
G- 32 Gr os s p r o f it , %
G- 33 Hardwar e (line 28 / line 18) 0 36 0 3 6 0 36
G- 34 Software (line 29 / line 19) 0 18 0 4 0 –24
G- 35 Total (line 30 / line 20) 0 32 0 3 2 0 32
11. Financial analysis
See Chapter 10, p.238
12. Risk analysis See Chapter 11, p.280
13. Conclusion See Chapter 3, p.50 14. Annex A1. Production and sales
See Chapter 8, p.186

APPENDIX 345
ANNEX A.2 Capital outlays
T e t r y l u s I n c F i n a n c i a l p l a n
Tot al c ap it al outlays & depreciation, first six months
Mo nt h 1 Month 2 Month 3 Month 4 Month 5 Month 6 H 1
CAPIT A L O UTLAY S
C-1 1 Office fittin g 6 500 0 0 0 0 0 6 500
C-1 2 Office furnit ure 5 000 0 0 0 0 0 5 000
C-1 3 Office equipm ent 0 0 750 0 0 0 75 0
C-1 4 Telecoms equipment 0 0 0 0 0 0 0
C-1 5 Computers, etc 20 000 1 500 0 1 000 0 0 22 500
C-1 6 Software 00 0 0 0 0 0 0 5 000
C-1 7 Motor vehicles 0 0 0 0 0 0 0
C-0 0 T O T AL 36,500 1 500 750 1 000 0 0 39 750
D EPRECIAT IO N S C H E D ULE
D-11 O f 0 542 542 542 542 5 42 2 708
D-12 O f 0 83 83 83 83 83 417
D-13 O f 0 0 0 13 13 13 38
D-14 Telecoms equipment 0 0 0 0 0 0 0
D-15 Computers, etc. 0 556 597 597 625 625 3 000
D-16 Software 0 208 208 208 208 208 1 042
D-17 Motor vehicles 0 0 0 0 0 0 0
D-00 T OT AL 0 1 389 1 431 1 443 1 471 1 471 7 204
No te s to the accounts: de pr ec ia ti on policy
Fixed as sets a re written-off over their projected working lives using the straight-line method. Office
fittings are depreciated over the 12-month term of the office le ase; office furniture and equipment is
depreciated over 60 months, computers over 36 and software over 24 months
Com menta ry (e xtrac t)
Li ne S- 00 – To ta l sal ar ies
Total spending on salaries is based on headcount projections and expected salary levels (as described …)
Li ne S-11 D irector s tipen ds
There is a modest $10,000 a month to cover the directors’ basic living costs and commitments. This will be
increased toward market levels once the business is generating sustained positive cash flow.
Line S-12 D eliberate ly omitted
Li ne S- 13 Cont ra ct st af f
To avoid the commitment associated with increasing the permanent staff complement, and to add to the range of
resources available, a number of technical staff will be employed on a contract basis. Their costs are shown on
page 178 and the total is included in line S-13.
Line E-1 1 P re mis es renta l a nd ta xes
We have a one-year lease on premises at Millennium Park, The lease is fixed at $12,000 for the period and it is
payable monthly in advance commencing in month 1.
Li ne E- 12 Am or tisat io n – l easeh ol d imp ro vemen ts
This is the initial office fitting costs (described on page 178 written-off over the 12-month term of the lease.
Li ne E -13 Utilities
We estimate spending on electricity and water at a little over $500 a month. There will be an annual price increase
in month 11 – we have provided for the maximum likely rise of 10%.
ANNEX A.4 Non-staff operating costs
T e t r yl u s I n c F i na n c i a l pl a n ,
Op erati ng costs, fi rst s ix months
Dollars
Month 1 Month 2 Mon th 3 Month 4 Month 5 Month 6 H 1
E-1 1 Premi ses rental & taxes 1 00 0 1 0 00 1 00 0 1 000 1 000 1 000 6 000
E-1 2 Amort’n – lease improvem’ts 0 5 42 5 42 54 2 542 542 2 708
E-1 3 Utilities – electricity, etc. 5 00 5 00 5 00 50 0 500 500 3 000
E-1 0 T O T AL O C C U PAN C Y 1 500 2 042 2 042 2 042 2 042 2 04 2 1 1 7 08
E-2 1 Dep’n – office furniture 0 83 83 83 83 83 417
E-2 2 Dep’n – office equipment 0 0 0 13 13 13 3 8
E-2 3 Small equipment 10 0 100 0 0 0 0 2 00
E-2 4 Stationery & printing 100 25 25 2 5 2 5 25 225
E-2 5 Dues & subscriptions 100 10 0 10 0 100 1 00 10 0 600
E-2 6 Books & periodicals 50 5 0 5 0 5 0 50 50 300
E-2 7 Other of 0 50 50 50 50 50 30 0
E-2 0 T O T AL O F F I CE 40 0 4 08 30 8 321 321 32 1 2 079
E-3 1 Dep’n – coms. equipment 0 0 0 0 0 0 0
E-3 2 Telephone & fax 2 5 00 2 50 0 2 500 2 500 2 500 2 500 1 5 000
E-3 3 Information services 1 00 1 00 1 00 10 0 100 100 600
E-3 4 Postage & courier 25 0 250 25 0 250 250 250 1 500
E-3 0 T O T AL C O M M S 2 850 2 850 2 850 2 850 2 850 2 850 17 10 0
E-4 1 Depreciation – computers 0 556 597 597 62 5 625 3 000
E-4 2 Depreciation – software 0 208 20 8 208 20 8 208 1 042
E-4 3 Other software licences 5 00 0 0 0 0 0 5 00
E-4 5 Computer consumables 50 50 50 50 50 50 300
E-4 0 T O T AL C O M P UTE R S 55 0 8 14 85 6 856 883 883 4 842
E-5 1 Product distribution 0 0 5 00 1 0 00 30 0 2 50 0 4 3 00
E-5 2 B r o c h ur es a n d p ri nti n g 0 5 000 2 50 0 0 0 0 7 500
E-5 5 Promot io n a l items 0 2 50 0 0 0 0 0 2 50 0
E-5 9 Other marketing 0 5 00 0 5 000 0 0 0 1 0 0 00
E-5 0 T O T AL M K T G & S A L ES 0 12 500 8 00 0 1 000 30 0 2 50 0 24 300
E-6 1 Depreciation – vehicles 0 0 0 0 0 0 0
E-6 2 Rental – vehicles 0 0 0 0 0 0 0
E-6 3 Motor vehicle expenses 0 0 0 0 0 0 0
E-6 4 Travel & subsistence 5 1 00 10 10 0 10 10 0 10 100 10 100 1 0 100 55 600
E-6 5 Entertainment 0 0 0 0 0 0 0
E-6 0 T O T AL T S & E 5 100 10 100 10 100 1 0 100 1 0 100 10 10 0 5 5 600
E-7 1 Audit fees 0 0 0 0 0 0 0
E-7 2 Legal fees 1 00 0 2 500 1,000 0 0 0 4 500
E-7 5 Other profes sional fees 0 0 0 0 0 0 0
E-7 0
T O T AL P R O FES S I O NAL 1 000 2 5 00 1 00 0 0 0 0 4 50 0
E-8 3 Insurance 1 0 00 2 50 0 0 0 0 0 3 50 0
E-8 5 Sundry expenditure 100 100 100 1 00 10 0 100 600
E-8 0 T O T AL O T H E R 1 10 0 2 60 0 100 100 10 0 100 4 1 00
E-0 0 T O T AL E X P E NDI T U R E 12 50 0 3 3 814 2 5 256 17268 1 6 596 18 796 1 24 2 29
ANNEX A.3 Sta costs
Te tryl us Inc Fi nan cial pl an
Sta ff co st s, r st six mo nths
Dollars
Mo nth 1 Mon th 2 M onth 3 Month 4 Month 5 M ont h 6 H 1
S TAFF N UM BER S
Direct ors/managers 3 3 3 3 3 3 3
Technical sta 2 4 4 4 4 4 4
Marketing staff 0 1 1 2 2 2 2
Administrative staff 2 2 2 2 2 3 3
Tot al 7 1 0 1 0 11 11 1 2 12
S TAFF C OS TS
Sta ff sa lar ie s
S -1 Tec hnical staff 1 1 20 0 1 20 0 1 20 0 1 200 1 20 0 1 2 00 7 2 00
S -2 Tec hnical staff 2 1 20 0 1 20 0 1 20 0 1 200 1 20 0 1 2 00 7 2 00
S -3 Tec hnical staff 3 . 1 20 0 1 200 1 20 0 1 200 1 200 6 000
S -4 Tec hnical staff 4 . 1 20 0 1 200 1 20 0 1 200 1 200 6 000
S -5 Sales/distribution manager . . . 1 25 0 1 259 1 250 3 759
S -6 Marketing ass ista nt . 75 0 75 0 750 75 0 750 3 75 0
S -7 B ook-keeping, etc. . . . . . 750 7 50
S -8 Receptionist /secretary 600 600 60 0 60 0 60 0 600 3 60 0
S -9 Messe nger/security 3 00 3 00 300 30 0 30 0 30 0 1 800
S-0 0 T O TAL (sum S1 to S9) 3 30 0 6 45 0 6 45 0 7 700 7 70 9 8 4 50 40 05 9
S-1 1 Directo rs’ stipen ds 10 000 10 0 00 10 00 0 10 000 1 0 000 10 000 60 000
S-1 3 C ontract sta 10 000 10 00 0 10 00 0 10 000 10 0 00 10 000 6 0 000
S-1 4 S taff social secu rity 92 162 162 185 18 5 20 8 992
S-1 5 S taff temporary 0 0 0 0 0 0 0
S-1 0 T O TAL DI RE CT (11 to 19 ) 23 392 26 6 12 2 6 612 27 8 85 27 894 28 65 8 161 051
S-2 1 S taff pension fund 4 17 417 417 41 7 41 7 417 2 5 00
S-2 2 S taff termination fund 0 0 0 0 0 0 0
S-2 3 S taff rent allowance s 0 0 0 0 0 0 0
S-2 4 S taff transport allowanc es 0 0 0 0 0 0 0
S-2 5 S taff other allowances 0 0 0 0 0 0 0
S-2 6 S taff group insurance 0 0 0 0 0 0 0
S-2 7 S taff medical insurance 50 0 0 0 0 0 0 500
S-2 8 S taff other benet s 0 0 0 0 0 0 0
S-2 0 T O T. BEN EFIT S ( 21 t o 2 9) 917 417 417 4 17 417 4 17 3 000
S-3 1 S taff medical expenses 0 0 0 0 0 0 0
S-3 2 S taff recruitment 0 0 0 0 0 0 0
S-3 3 S taff relocation 0 0 0 0 0 0 0
S-3 4 S taff legal expens es 1 50 0 0 0 0 0 0 1 50 0
S-3 6 S taff training 0 0 0 0 0 0 0
S-3 8 S taff entertainment 7 0 10 0 10 0 11 0 11 0 120 610
S-3 9 S taff sund ry 0 0 0 0 0 0 0
S-3 0 T O TAL OTHE R (31 to 39) 1 570 100 10 0 11 0 11 0 120 2 11 0
S-0 0 T O TA L S TAF F (10+20+3 0) 25 879 27 1 28 2 7 1 28 2 8 411 28 42 0 29 194 16 6 16 1
ANNEX A.5 Income/P&L and balance sheet
T e t r y lu s I n c , F i n a nc i a l p l a n
I nc o m e s t a t e me n t / p r o fi t & l o s s ac c o u n t , f i rs t s i x mo n t h e s
Do ll ars
Month 1 Month 2 Month 3 Mo nth 4 Month 5 Mo nth 6 H 1
Sa les 0 20 00 0 0 40 00 0 0 50 00 0 1 10 00 0
Le ss: Costs o f sal es 0 13 591 0 27 183 0 33 97 9 74 753
G r oss p ro f i t 0 6 409 0 12 81 7 0 16 021 35 247
Le ss:Ope ra ti ng c os ts
Employee costs 25 879 27 12 8 27 12 8 28 41 1 2 8 420 29 194 1 66 16 1
Other expenditure 12 50 0 33 81 4 25 25 6 17 26 8 1 6 596 18 79 6 1 24 22 9
Total o pe rating co st s38 379 6 0 94 2 52 384 45 679 45 016 4 7990 290 390
Ne t profit (l os s) (38379) (54533) (5238 4) (32862) ( 45016) (31 969) (255143)
be fo re continge nc y et c
Le ss:Contingency 3 838 6 0 94 5 2 38 4 568 4 502 4 79 9 29 03 9
Ne t profit (l os s) (42217) (60627) (5762 2) (37430) ( 49518) (36 768) (284182)
be fo re interest a nd t ax
Ba lan ce s hee t
Do ll ars
Month 1 Mont h 2 Month 3 Month 4 Mo nth 5 Month 6
As s ets
B -1 Cash at bank 1 00 0 1 000 1 00 0 1 000 1 000 1 0 00
B -2 Accou nts receivable 0 20 0 00 0 40 000 0 50 000
B -3 Deposits paid 2 000 2 000 2 000 2 000 2 00 0 2 0 00
B -4 Repayments (rents) 11 000 10 00 0 9 000 8 000 7 000 6 000
B -5 Inventory 0 15 000 40 000 17 500 42 500 12 5 00
B -6 Fixe d a ssets at co st 3 6 5 00 38 0 00 38 750 39 750 39 750 39 750
B -7 Less acc umulated d epreciation 0 –1 389 – 2 8 19 –4 263 –5 73 3 – 7 2 04
B -8 M em o: n et fi xe d as se ts 36 500 36 611 3 5 931 35 488 34 017 32 546
B -9 Total assets 50 5 00 84 611 87 931 103 988 8 6 517 104 0 46
B-1 0
B-1 1 L IAB I LIT I ES
B-1 2 Total loans 91 30 0 17 2 031 2 42 556 268 443 32 2 573 342 475
B-1 3 Accounts payable – hardware 0 1 0 000 0 22 5 00 0 30 0 00
B-1 4 Accounts payable – software 0 3 591 3 591 8 274 8 274 12 253
B-1 5 Ac cruals (staff pensio ns) 41 7 8 33 1 25 0 1 6 67 2 08 3 2 500
B-1 6 Total li abilities 91 71 7 186 455 247 397 300 884 3 32 931 387 228
B-1 7
B-1 8 C A P ITAL & RE S E R V E S
B-1 9 Share capit al 1 000 1 000 1 000 1 000 1 00 0 1 0 00
B-2 0 Unremitted P&L –42 217 –10 2 8 44 –160 467 –197 896 – 247 414 –284 1 82
B-2 1 Total cap ital and res erves –41 217 – 101 844 –159 467 –196 896 –246 414 –283 182
B-2 2
B-2 3 Total li abilities and equity 50 500 84 611 87 931 103 988 86 517 104 046
13
15. Annex A2. Capital outlays
See Chapter 9, p.203
16. Annex A3. Sta costs
See Chapter 9, p.205
17. Annex A4. Non-sta operating costs
See Chapter 9, p.212
18. Annex A5. Income/P&L and balance
sheet See Chapter 9, p.215
..................Content has been hidden....................
You can't read the all page of ebook, please click here login for view all page.