

176 CHAPTER 8 GETTING TO GROSS PROFIT
How does your forecast look? Was it what you expected? Have you made any artificial
assumptions? Will the economy perform as expected? Will your competitors play by the
rules? Will your customers remain loyal? You will review these issues in Chapter 11 and
perhaps modify the forecast – or produce best- and worst-case forecasts, etc. For the
moment, assume that you have one perfect forecast. Now look at how you move on to
forecast your gross profit.
Cost of sales
Cost of sales is sometimes called cost of goods sold, but I am sure that you can cope with
this complex variation in nomenclature. Cost of sales is, how can I put this simply, the
direct cost of what you sell in any one accounting period.
For a re-seller, the cost of sales is the price paid to acquire the goods that are to be
re-sold.
In manufacturing, the cost of sales is raw materials and other supplies consumed
in making the product, plus directly attributed production wages and factory
overheads such as heat and light.
For a software company, the cost of sales might be determined as one-hundredth
of the original R&D cost for each unit sold (if lifetime sales are expected to be 100
copies of a program).
Simple services
Perhaps from time to time you will begin to think that this chapter is all about noisy
production lines and oily machines. This is because it is useful to consider the more
complex situations. If you are re-selling goods that you buy elsewhere or providing
services, your forecasting will be much more simple. Cost of sales might be nothing
more complex than your buying price including shipping – or so-many hours of
your consultants’ time at their hourly employment costs.
Some people are notoriously poor at making these calculations. If you add up
all the hours invoiced by certain professionals during their lifetimes, you might
conclude that they each must live to be several hundred years old.
t

COST OF SALES 177
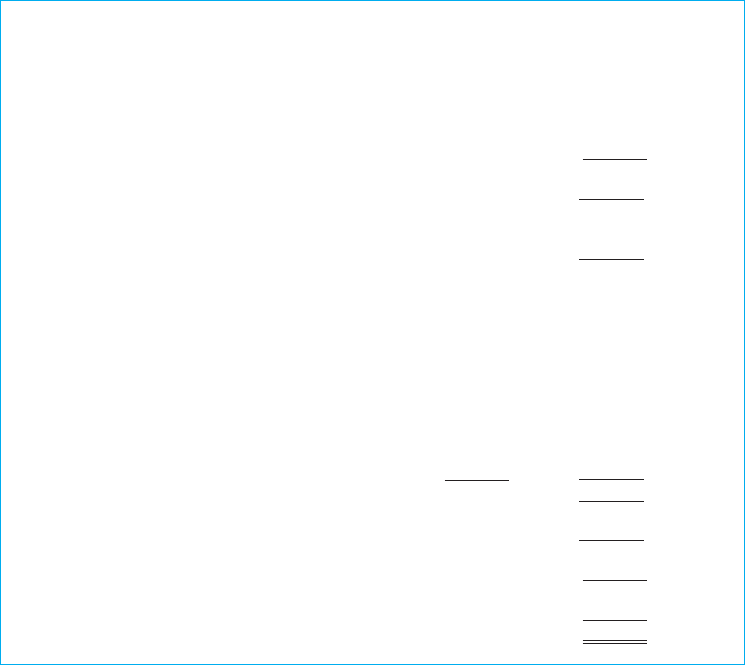
It makes sense to run through a more complex example. You can modify this or scale it
down for your own business. Figure 8.5 shows an example manufacturing account. To be
pedantic, the penultimate line perhaps belongs in a trading account but it is included to
show the final cost of sales.
It is not too hard to follow the logic. The manufacturing of a single product takes place
at a dedicated facility. It is easy to identify all the costs directly associated with produc-
tion. These comprise variable costs (such as raw materials) which vary directly with the
volume of production, and fixed costs (such as rent paid for the factory).
COST OF MATERIALS
In just the same way as you explored sales, you can analyse your raw materials, com-
ponents and other supplies. Again, look for relationships between these and various
economic indicators. This time, you are looking both at volumes – for the way that supply
and demand affect prices – and at price indicators.
Economic forecasts usually include retail or consumer price and GDP deflators – which
are indices of inflation at the consumer and national level – and exchange rates. You will
also usually find indicators of labour costs. Obviously, you can use any or all of these to
help forecast price movements in your supplies. Trade and commodity producers associa-
tions sometimes produce useful data also.
OTHER PRODUCTION COSTS
Some other production costs are shown in Figure 8.5. These are projected in exactly
the same way as any other operating costs. To avoid duplication, I will defer discus-
sion of these production and operating costs until Chapter 9. When you read it you will
understand my logic. Skip forward now if you want to get straight down to forecasting
production costs. The remaining discussion in this chapter assumes that you have already
done this.
Indirect costs cannot be directly attributed to the cost of the product. They
include R&D, marketing and sales, and other administrative costs. These
are shown sep arately in trading or operating accounts which we look at in
Chapter 9.
178 CHAPTER 8 GETTING TO GROSS PROFIT
PRODUCTION OR PURCHASING COSTS
You need to understand how much it costs to produce a unit of your product – otherwise
you would not know how much to sell it for. The unit might be one widget, one hour of
legal advice, one bed occupied (such as in a hospital or hotel), a tonne of coal, 1000 sheep
and so on.
Simplistically, divide cost of production by the number of items produced. For exam-
ple, if the $750,000 worth of activity in Figure 8.5 produced 375,000 widgets, the cost
associated with producing one widget is:
unit cost = total cost of production ÷ volume of production
= 750,000 ÷ 375,000
= $2
Sample manufacturing account
Year ended 31 December
Money
Raw materials (dollars)
Opening stock 50 000
Purchases ........250.000
300.000
Less closing stock ........40.000
Cost of materials consumed 260 000
Production wages ........150.000
Prime cost of production 410 000
Factory overheads
Packers’ wages 90.000
Management salaries 110.000
Administration salaries 50.000
Rental and property taxes 100.000
Electricity and water 12.000
Maintenance of machinery 8.000
Depreciation of machinery 10.000
Depreciation of leasehold improvements ........5.000
Total overheads .....385.000
795.000
Less increase in work-in-progress ..........5.000
Cost of goods produced .....790.000
Less increase in stock of finished goods in factory ........10.000
Cost of goods shipped to warehouse 780.000
Less increase in stock of finished goods in warehouse ......30.000
Costs of sales .....750.000
Figure 8.5 Cost of sales
COST OF SALES 179
Direct costs divide into variable and fixed. Let me state the obvious. Variable costs (such as
raw materials) vary directly with volume. Each cubic metre of concrete mix A requires, say,
1
–
2
cubic metre of gravel – and for this mix the proportion of gravel is always 50% of the
total (except in shoddy construction work when standards slip so that the contractor can
save on cement).
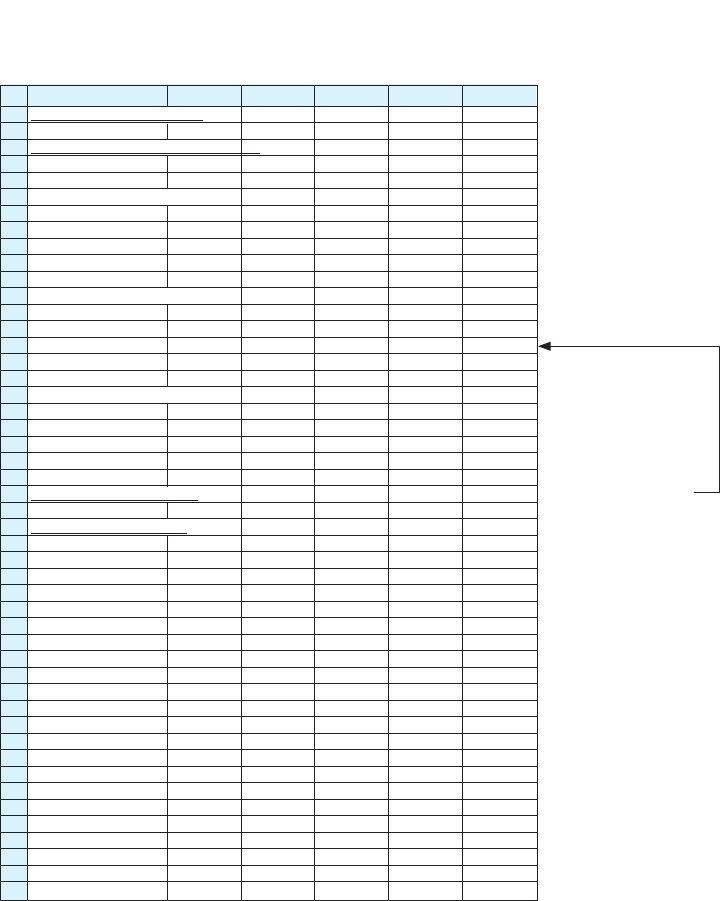
Figure 8.6 Playing the numbers game (2)
All of the figures here are calculated automatically from the first part of this spreadsheet, which is
shown in Figure 8.4. This spreadsheet also shows an example of the effects of using FIFO and LIFO
to value inventory when production costs are falling – see Valuing inventory on page 181.
A B C D E F
38 TETRYLUS Inc Financial plan
39
40 Sales, costs and prices, first five years
41 Dollars
42 Year 1 Year 2 Year 3 Year 4 Year 5
43 Hardware inventory volume
44 Opening stock 0 1 160 1 160 1 160 1 160
45 Additions (production) 5 000 42 000 330 000 450 000 600 000
46 Reductions (sales) –3 840 –42 000 –330 000 –450 000 –600 000
47 Closing 1 160 1 160 1 160 1 160 1 160
48
49 Hardware inventory value (FIFO)
50 Opening stock 0 29 000 31 900 49 880 87 232
51 Additions (production) 125 000 945 000 3 960 000 4 860 000 5 832 000
52 Reductions (sales) –96 000 –942 100 –3 942 020 –4 822 648 –5 756 043
53 Closing stock 29 000 31 900 49 880 87 232 163 189
54
55 Hardware inventory value (LIFO)
56 Opening stock 0 29 000 29 000 29 000 29 000
57 Additions (production) 125 000 945 000 3 960 000 4 860 000 5 832 000
58 Reductions (sales) –96 000 –945 000 –3 960 000 –4 860 000 –5 832 000
59 Closing stock 29 000 29 000 29 000 29 000 29 000
60
61 TETRYLUS Inc Financial plan
62
63 Gross profit, first five years
64 Dollars
65 Year 1 Year 2 Year 3 Year 4 Year 5
66 Gross sales
67 Hardware 307 200 2 100 000 14 850 000 18 225 000 21 870 000
68 Software 14 000 52 500 396 000 540 000 720 000
69 Total 321 200 2 152 500 15 246 000 18 765 000 22 590 000
70
71 Cost of sales
72 Hardware 96 000 945 000 3 960 000 4 860 000 5 832 000
73 Software 2 000 10 500 66 000 90 000 120 000
74 Total 98 000 955 500 4 026 000 4 950 000 5 952 000
75
76 Gross profit
77 Hardware 211 200 1 155 000 10 890 000 13 365 000 16 038 000
78 Software 12 000 42 000 330 000 450 000 600 000
79 Total 223 200 1 197 000 11 220 000 13 815 000 16 638 000
80
81 Gross profit margin %
82 Hardware 69 55 73 73 73
83 Software 86 80 83 83 83
84 Total 69 56 74 74 74
85
Source:
Line 47, previous period
Based on line 18
Line 18
Line 44 + line 45 + line 46
Line 53, previous period
Line 22 x line 45
Line 50 + line 51 + line 52
Line 59, previous period
Line 22 x line 45
Line 22 x line 46
Line 56 + line 57 + line 58
((Line 46 – line 47)
in previous period)
x line 22) + line 53
in previous period
Line 18 x line 26
Line 19 x line 27
Line 67 + line 68
Line 18 x line 22
Line 19 x line 23
Line 72 + line 73
Line 67 – line 72
Line 68 – line 73
Line 77 + line 78
Line 77 + line 67 x 100
Line 78 + line 68 x 100
Line 79 + line 69 x 100

180 CHAPTER 8 GETTING TO GROSS PROFIT
On the other hand, fixed costs are relatively fixed in relation to production. Factory rent
will not vary, whether output is zero or running at maximum capacity. Machine costs might
be fixed in relation to smaller quantities of output. If it costs you $15,000 to rent a machine
to produce anything between 0 and 100,000 units a month, the fixed costs related to the
machines go up in steps of $15,000 every time that production passes a 100,000 barrier.
When you have calculated the cost of producing a unit of your goods or services you
can multiply volumes by unit-cost to arrive at total cost of sales. For example, for 375,000
units at $2 a unit:
cost of sales = sales volume × unit-cost of production
= 375,000 × 2
= $750,000
The alternative is to do it the long way, to produce a column of figures similar to those in
Figure 8.5 for each period in your forecast. You are going to have to do this eventually for
the budget exercise – but the unit-value approach is useful for what-if analysis (what if
sales were $500? $10,000? $20,000?) and for ‘big-picture forecasting’ while you are refin-
ing your strategy and plans.
MANUFACTURING, TRADING AND OPERATING ACCOUNTS
Often, the sales and costs of sales figures are included in the overall profit and loss
account. We do it this way in Chapter 9. For complex situations, you might separate out
chunks of related numbers – otherwise you would need a very long sheet of paper (such
as the back of one of those huge computer printouts that for some reason are always
stacked up in the accounts department). You might have three accounts.
1 A manufacturing account such as in Figure 8.5.
2 A trading account. This starts with costs of goods shipped to warehouse (brought
forward from the manufacturing account) and shows sales and distribution
activities resulting in gross sales and gross profit.
For general analysis, you will want to attribute the portion of indirect costs
(such as marketing) that has to be absorbed in the production and sale
of each of your products. This is discussed in Chapter 11. For the current
purposes of assessing production costs we need consider only direct costs.
t
..................Content has been hidden....................
You can't read the all page of ebook, please click here login for view all page.