
APPENDIX A
STATISTICAL TABLES

The probability density function of the standard normal distribution.
Table A.1 Critical Values zα, Where Pr(Z ≥ zα) = α and Z Is the Standard Normal Distribution

Source: Adapted from Table 2 of Lindley and Miller (1958), Cambridge Elementary Statistical Tables, published by Cambridge University Press, with kind permission of the authors and publishers.

The probability density function of the Student's t-distribution with n degrees of freedom (d.f.).
Table A.2 Critical Values tn,α, Where Pr(Tn ≥ tn, α) = α and Tn Is the Student's t-Distribution With n Degrees of Freedom (d.f.)

Source: Adapted from Table III of Fisher and Yates (1963), Statistical Tables for Biological, Agricultural and Medical Research, 6th Ed., published by Oliver and Boyd, Edinburgh, with kind permission of the authors and publishers.

The probability density function of the χ2 distribution with n degrees of freedom (d.f.).
Table A.3 Critical Values ![]() , Where
, Where ![]() and
and ![]() Is the χ2 Distribution With n Degrees of Freedom (d.f.)
Is the χ2 Distribution With n Degrees of Freedom (d.f.)


The probability density function of the F-distribution with n1 (numerator) and n2 (denomenator) degrees of freedom (d.f.).
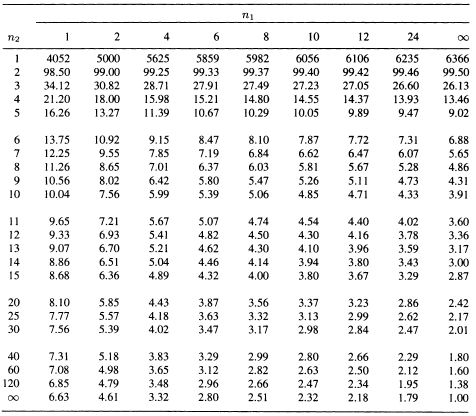
Table A.4 The 5% Critical Values fn1,n2;0.05, Where Pr(Fn1,n2 ≥ fn1,n2;0.05) = 0.05 and Fn1,n2 Is the F-Distribution With n1 (numerator) and n2 (denominator) (d.f.)

Source: Abridged from Table 18 of Pearson and Hartley (1954), Biometrika Tables for Statisticians, Volume I, published at the Cambridge University Press for the Biometrika Trustees, with kind permission of the authors and publishers.

The probability density function of the F-distribution with n1 (numerator) and n2 (denomenator) degrees of freedom (d.f.).
Table A.5 The 1% Critical Values fn1,n2;0.01, Where Pr(Fn1,n2 ≥ fn1,n2;0.01) = 0.01 and Fn1,n2 Is the F-Distribution With n1 (numerator) and n2 (d.f.)
Source: Abridged from Table 18 of Pearson and Hartley (1954), Biometrika Tables for Statisticians, Volume 1, published at the Cambridge University Press for the Biometrika Trustees, with kind permission of the authors and publishers.
Table A.6 Distribution of Durbin-Watson Statistic d: The 5% Significance Points of dL and dU (p Is the Number of Predictor Variables)
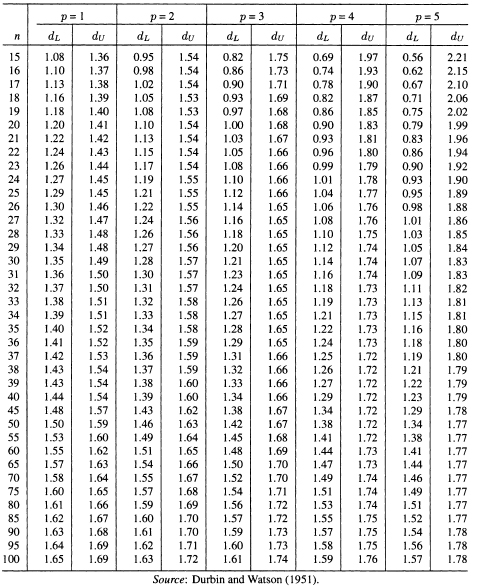
Table A.7 Distribution of Durbin-Watson Statistic d: The 1% Significance Points of dL and dU (p Is the Number of Predictor Variables)
