
CHAPTER 7
WEIGHTED LEAST SQUARES
7.1 INTRODUCTION
So far in our discussion of regression analysis it has been assumed that the underlying regression model is of the form
where the εi's are random errors that are independent and identically distributed (i.i.d.) with mean zero and variance σ2. Various residual plots have been used to check these assumptions (Chapter 4). If the residuals are not consistent with the assumptions, the equation form may be inadequate, additional variables may be required, or some of the observations in the data may be outliers.
There has been one exception to this line of analysis. In the example based on the Supervisor Data of Section 6.5, it is argued that the underlying model does not have residuals that are i.i.d. In particular, the residuals do not have constant variance. For these data, a transformation was applied to correct the situation so that better estimates of the original model parameters could be obtained (better than the ordinary least squares (OLS) method).
In this chapter and in Chapter 8 we investigate situations where the underlying process implies that the errors are not i.i.d. The present chapter deals with the heteroscedasticity problem, where the residuals do not have the same variance, and Chapter 8 treats the autocorrelation problem, where the residuals are not independent.
In Chapter 6 heteroscedasticity was handled by transforming the variables to stabilize the variance. The weighted least squares (WLS) method is equivalent to performing OLS on the transformed variables. The WLS method is presented here both as a way of dealing with heteroscedastic errors and as an estimation method in its own right. For example, WLS perfoms better than OLS in fitting dose-response curves (Section 7.5) and logistic models (Section 7.5 and Chapter 12).
In this chapter the assumption of equal variance is relaxed. Thus, the εi's are assumed to be independently distributed with mean zero and ![]() . In this case, we use the WLS method to estimate the regression coefficients in (7.1). The WLS estimates of β1, β2,…, βp are obtained by minimizing
. In this case, we use the WLS method to estimate the regression coefficients in (7.1). The WLS estimates of β1, β2,…, βp are obtained by minimizing
![]()
where wi are weights inversely proportional to the variances of the residuals (i.e., ![]() ). Note that any observation with a small weight will be severely discounted by WLS in determining the values of β0, β1,…, βp. In the extreme case where wi = 0, the effect of WLS is to exclude the ith observation from the estimation process.
). Note that any observation with a small weight will be severely discounted by WLS in determining the values of β0, β1,…, βp. In the extreme case where wi = 0, the effect of WLS is to exclude the ith observation from the estimation process.
Our approach to WLS uses a combination of prior knowledge about the process generating the data and evidence found in the residuals from an OLS fit to detect the heteroscedastic problem. If the weights are unknown, the usual solution prescribed is a two-stage procedure. In Stage 1, the OLS results are used to estimate the weights. In the second stage, WLS is applied using the weights estimated in Stage 1. This is illustrated by examples in the rest of this chapter.
7.2 HETEROSCEDASTIC MODELS
Three different situations in which heteroscedasticity can arise will be distinguished. For the first two situations, estimation can be accomplished in one stage once the source of heteroscedasticity has been identified. The third type is more complex and requires the two-stage estimation procedure mentioned earlier. An example of the first situation is found in Chapter 6 and will be reviewed here. The second situation is described, but no data are analyzed. The third is illustrated with two examples.
7.2.1 Supervisors Data
In Section 6.5, data on the number of workers (X) in an industrial establishment and the number of supervisors (Y) were presented for 27 establishments. The regression model

Figure 7.1 An example of heteroscedastic residuals.
was proposed. It was argued that the variance of εi depends on the size of the establishment as measured by xi; that is, ![]() , where k is a positive constant (see Section 6.5 for details). Empirical evidence for this type of heteroscedasticity is obtained by plotting the standardized residuals versus X. A plot with the characteristics of Figure 7.1 typifies the situation. The residuals tend to have a funnel-shaped distribution, either fanning out or closing in with the values of X. If corrective action is not taken and OLS is applied to the raw data, the resulting estimated coefficients will lack precision in a theoretical sense. In addition, for the type of heteroscedasticity present in these data, the estimated standard errors of the regression coefficients are often understated, giving a false sense of precision. The problem is resolved by using a version of weighted least squares, as described in Chapter 6.
, where k is a positive constant (see Section 6.5 for details). Empirical evidence for this type of heteroscedasticity is obtained by plotting the standardized residuals versus X. A plot with the characteristics of Figure 7.1 typifies the situation. The residuals tend to have a funnel-shaped distribution, either fanning out or closing in with the values of X. If corrective action is not taken and OLS is applied to the raw data, the resulting estimated coefficients will lack precision in a theoretical sense. In addition, for the type of heteroscedasticity present in these data, the estimated standard errors of the regression coefficients are often understated, giving a false sense of precision. The problem is resolved by using a version of weighted least squares, as described in Chapter 6.
This approach to heteroscedasticity may also be considered in multiple regression models. In (7.1) the variance of the residuals may be affected by only one of the predictor variables. (The case where the variance is a function of more than one predictor variable is discussed later.) Empirical evidence is available from the plots of the standardized residuals versus the suspected variables. For example, if the model is given as (7.1) and it is discovered that the plot of the standardized residuals versus X2 produces a pattern similar to that shown in Figure 7.1, then one could assume that Var(εi) is proportional to ![]() that is,
that is, ![]() , where k > 0. The estimates of the parameters are determined by minimizing
, where k > 0. The estimates of the parameters are determined by minimizing
![]()
If the software being used has a special weighted least squares procedure, we make the weighting variable equal to ![]() . On the other hand, if the software is only capable of performing OLS, we transform the data as described in Chapter 6. In other words, we divide both sides of (7.1) by xi2 to obtain
. On the other hand, if the software is only capable of performing OLS, we transform the data as described in Chapter 6. In other words, we divide both sides of (7.1) by xi2 to obtain
![]()
Table 7.1 Variables in Cost of Education Survey

The OLS estimate of the coefficient of the variable 1/X2 is the WLS estimate of β0. The coefficient of the variable Xj/X2 is an estimate of βj for all j ≠ 2. The constant term in this fitting is an estimate of β2. Refer to Chapter 6 for a detailed discussion of this method applied to simple regression.
7.2.2 College Expense Data
A second type of heteroscedasticity occurs in large-scale surveys where the observations are averages of individual sampling units taken over well-defined groups or clusters. Typically, the average and number of sampling units are reported for each cluster. In some cases, measures of variability such as a standard deviation or range are also reported.
For example, consider a survey of undergraduate college students that is intended to estimate total annual college-related expenses and relate those expenses to characteristics of the institution attended. A list of variables chosen to explain expenses is shown in Table 7.1. Regression analysis with the model
may be used to study the relationship. In this example, a cluster is equated with a school and an individual sampling unit is a student. Data are collected by selecting a set of schools at random and interviewing a prescribed number of randomly selected students at each school. The response variable, Y, in (7.3) is the average expenditure at the ith school. The predictor variables are characteristics of the school. The numerical values of these variables would be determined from the official statistics published for the school.
The precision of average expenditure is directly proportional to the square root of the sample size on which the average is based. That is, the standard deviation of ![]() is
is ![]() , where ni represents the number of students interviewed at the ith institution and σ is the standard deviation for annual expense for the population of students. Then the standard deviation of εi, in the model (7.1) is
, where ni represents the number of students interviewed at the ith institution and σ is the standard deviation for annual expense for the population of students. Then the standard deviation of εi, in the model (7.1) is ![]() . Estimation of the regression coefficients is carried out using WLS with weights
. Estimation of the regression coefficients is carried out using WLS with weights ![]() . Since
. Since ![]() , the regression coefficients are obtained by minimizing the weighted sum of squared residuals,
, the regression coefficients are obtained by minimizing the weighted sum of squared residuals,

Note that the procedure implicitly recognizes that observations from institutions where a large number of students were interviewed as more reliable and should have more weight in determining the regression coefficients than observations from institutions where only a few students were interviewed. The differential precision associated with different observation may be taken as a justification for the weighting scheme.
The estimated coefficients and summary statistics may be computed using a special WLS computer program or by transforming the data and using OLS on the transformed data. Multiplying both sides of (7.1) by ![]() , we obtain the new model
, we obtain the new model
The error terms in (7.5), ![]() now satisfy the necessary assumption of constant variance. Regression of
now satisfy the necessary assumption of constant variance. Regression of ![]() against the seven new variables consisting of
against the seven new variables consisting of ![]() , and the six transformed predictor variables,
, and the six transformed predictor variables, ![]() using OLS will produce the desired estimates of the regression coefficients and their standard errors. Note that the regression model in (7.5) has seven predictor variables, a new variable
using OLS will produce the desired estimates of the regression coefficients and their standard errors. Note that the regression model in (7.5) has seven predictor variables, a new variable ![]() , and the six original predictor variables multiplied by
, and the six original predictor variables multiplied by ![]() . Note also that there is no constant term in (7.5) because the intercept of the original model, β0, is now the coefficient of
. Note also that there is no constant term in (7.5) because the intercept of the original model, β0, is now the coefficient of ![]() . Thus the regression with the transformed variables must be carried out with the constant term constrained to be zero, that is, we fit a no-intercept model. More details on this point are given in the numerical example in Section 7.4.
. Thus the regression with the transformed variables must be carried out with the constant term constrained to be zero, that is, we fit a no-intercept model. More details on this point are given in the numerical example in Section 7.4.
7.3 TWO-STAGE ESTIMATION
In the two preceding problems heteroscedasticity was expected at the outset. In the first problem the nature of the process under investigation suggests residual variances that increase with the size of the predictor variable. In the second case, the method of data collection indicates heteroscedasticity. In both cases, homogeneity of variance is accomplished by a transformation. The transformation is constructed directly from information in the raw data. In the problem described in this section, there is also some prior indication that the variances are not equal. But here the exact structure of heteroscedasticity is determined empirically. As a result, estimation of the regression parameters requires two stages.
Detection of heteroscedasticity in multiple regression is not a simple matter. If present it is often discovered as a result of some good intuition on the part of the analyst on how observations may be grouped or clustered. For multiple regression models, the plots of the standardized residuals versus the fitted values and versus each predictor variable can serve as a first step. If the magnitude of the residuals appears to vary systematically with ![]() or with xij, heteroscedasticity is suggested. The plot, however, does not necessarily indicate why the variances differ (see the following example).
or with xij, heteroscedasticity is suggested. The plot, however, does not necessarily indicate why the variances differ (see the following example).

Figure 7.2 Nonconstant variance with replicated observations.
One direct method for investigating the presence of nonconstant variance is available when there are replicated measurements on the response variable corresponding to a set of fixed values of the predictor variables. For example, in the case of one predictor variable, we may have measurements y11, y21, …, yn11 at x1; y12, y22,…, yn22 at x2; and so on, up to y1k, y2k,…, ynkk at xk. Taking k = 5 for illustrative purposes, a plot of the data appears as Figure 7.2. With this wealth of data, it is not necessary to make restrictive assumptions regarding the nature of heteroscedasticity. It is clear from the graph that the nonconstancy of variance does not follow a simple systematic pattern such as ![]() . The variability first decreases as x increases up to x3, then jumps again at x4. The regression model could be stated as
. The variability first decreases as x increases up to x3, then jumps again at x4. The regression model could be stated as
where ![]() .
.
The observed residual for the ith observation in the jth cluster or group is ![]() . Adding and subtracting the mean of the response variable in for the jth cluster,
. Adding and subtracting the mean of the response variable in for the jth cluster, ![]() , we obtain
, we obtain
which shows that the residual is made up of two parts, the difference between yij and ![]() and the difference between
and the difference between ![]() and the point on the regression line,
and the point on the regression line, ![]() . The first part is referred to as pure error. The second part measures lack of fit. An assessment of heteroscedasticity is based on the pure error.1 The weights for WLS may be estimated as
. The first part is referred to as pure error. The second part measures lack of fit. An assessment of heteroscedasticity is based on the pure error.1 The weights for WLS may be estimated as ![]() , where
, where
![]()
is the variance of the response variable for the jth group.
When the data are collected in a controlled laboratory setting, the researcher can choose to replicate the observations at any values of the predictor variables. But the presence of replications on the response variable for a given value of X is rather uncommon when data are collected in a nonexperimental setting. When there is only one predictor variable, it is possible that some replications will occur. If there are many predictor variables, it is virtually impossible to imagine coming upon two observations with identical values on all predictor values. However, it may be possible to form pseudoreplications by clustering responses where the predictor values are approximately identical. The reader is referred to Daniel and Wood (1980), where these methods are discussed in considerable detail. A more plausible way to investigate heteroscedasticity in multiple regression is by clustering observations according to prior, natural, and meaningful associations. As an example, we analyze data on state education expenditures. These data were used in Chapter 5.
7.4 EDUCATION EXPENDITURE DATA
The Education Expenditure data were used in Section 5.7 and it was suggested there that these data be looked at across time (the data are available for 1965, 1970, and 1975) to check on the stability of the coefficients. Here we use these data to demonstrate methods of dealing with heteroscedasticity in multiple regression and to analyze the effects of regional characteristics on the regression relationships. For the present analysis we shall work only with the 1975 data. The objective is to get the best representation of the relationship between expenditure on education and the other variables using data for all 50 states. The data are grouped in a natural way, by geographic region. Our assumption is that, although the relationship is structurally the same in each region, the coefficients and residual variances may differ from region to region. The different variances constitute a case of heteroscedasticity that can be treated directly in the analysis. The variable names and definitions appear in Table 7.2 and the data are presented in Table 7.3 and can be found in the book's Web site.2 The model is
Table 7.2 State Expenditures on Education, Variable List

States may be grouped into geographic regions based on the presumption that there exists a sense of regional homogeneity. The four broad geographic regions: (1) Northeast, (2) North Central, (3) South, and (4) West, are used to define the groups. It should be noted that data could be analyzed using indicator variables to look for special effects associated with the regions or to formulate tests for the equality of regressions across regions. However, our objective here is to develop one relationship that can serve as the best representation for all regions and all states. This goal is accomplished by taking regional differences into account through an extension of the method of weighted least squares.
It is assumed that there is a unique residual variance associated with each of the four regions. The variances are denoted as (c1σ)2, (c2σ)2, (c3σ)2, and (c4σ)2, where σ is the common part and the cj's are unique to the regions. According to the principle of weighted least squares, the regression coefficients should be determined by minimizing
![]()
where
Each of S1 through S4 corresponds to a region, and the sum is taken over only those states that are in the region. The factors ![]() are the weights that determine how much influence each observation has in estimating the regression coefficients. The weighting scheme is intuitively justified by arguing that observations that are most erratic (large error variance) should have little influence in determining the coefficients.
are the weights that determine how much influence each observation has in estimating the regression coefficients. The weighting scheme is intuitively justified by arguing that observations that are most erratic (large error variance) should have little influence in determining the coefficients.
The WLS estimates can also be justified by a second argument. The object is to transform the data so that the parameters of the model are unaffected, but the residual variance in the transformed model is constant. The prescribed transformation is to divide each observation by the appropriate cj, resulting in a regression of Y/cj on 1/cj, X1/cj, X2/cj, and X3/cj.3 Then the error term, in concept, is also divided by cj, the resulting residuals have a common variance, σ2, and the estimated coefficients have all the standard least squares properties.
Table 7.3 Education Expenditure Data

Table 7.4 Regression Results: State Expenditures on Education (n = 50)

The values of the cj's are unknown and must be estimated in the same sense that σ2 and the β's must be estimated. We propose a two-stage estimation procedure. In the first stage perform a regression using the raw data as prescribed in the model of Equation (7.8). Use the empirical residuals grouped by region to compute an estimate of regional residual variance. For example, in the Northeast, compute ![]() , where the sum is taken over the nine residuals corresponding to the nine states in the Northeast. Compute
, where the sum is taken over the nine residuals corresponding to the nine states in the Northeast. Compute ![]() , and
, and ![]() in a similar fashion. In the second stage, an estimate of
in a similar fashion. In the second stage, an estimate of ![]() in (7.9) is replaced by
in (7.9) is replaced by
![]()
The regression results for Stage 1 (OLS) using data from all 50 states are given in Table 7.4. Two residual plots are prepared to check on specification. The standardized residuals are plotted versus the fitted values (Figure 7.3) and versus a categorical variable designating region (Figure 7.4). The purpose of Figure 7.3 is to look for patterns in the size and variation of the residuals as a function of the fitted values. The observed scatter of points has a funnel shape, indicating heteroscedasticity. The spread of the residuals in Figure 7.4 is different for the different regions, which also indicates that the variances are not equal. The scatter plots of standardized residual versus each of the predictor variables (Figures 7.5 to 7.7) indicate that the residual variance increases with the values of X1.
Looking at the standardized residuals and the influence measures in this example is very revealing. The reader can verify that observation 49 (Alaska) is an outlier with a standardized residual value of 3.28. The standardized residual for this observation can actually be seen to be separated from the rest of the residuals in Figure 7.3. Observation 44 (Utah) and 49 (Alaska) are high leverage points with leverage values of 0.29 and 0.44, respectively. On examining the influence measures we find only one influential point 49, with a Cook's distance value of 2.13 and a DFITS value of 3.30. Utah is a high leverage point without being influential. Alaska, on the other hand, has high leverage and is also influential. Compared to other states, Alaska represents a very special situation: a state with a very small population and a boom in revenue from oil. The year is 1975! Alaska's education budget is therefore not strictly comparable with those of the other states. Consequently, this observation (Alaska) is excluded from the remainder of the analysis. It represents a special situation that has considerable influence on the regression results, thereby distorting the overall picture.

Figure 7.3 Plot of standardized residuals versus fitted values.

Figure 7.4 Plot of standardized residuals versus regions.

Figure 7.5 Plot of standardized residuals versus each of the predictor variable X1.

Figure 7.6 Plot of standardized residuals versus each of the predictor variable X2.

Figure 7.7 Plot of standardized residuals versus each of the predictor variable X3.
The data for Alaska may have an undue influence on determining the regression coefficients. To check this possibility, the regression was recomputed with Alaska excluded. The estimated values of the coefficients changed significantly. See Table 7.5. This observation is excluded for the remainder of the analysis because it represents a special situation that has too much influence on the regression results. Plots similar to those of Figures 7.3 and 7.4 are presented as Figures 7.8 and 7.9. With Alaska removed, Figures 7.8 and 7.9 still show indication of heteroscedasticity.
Table 7.5 Regression Results: State Expenditures on Education (n = 49), Alaska Omitted


Figure 7.8 Plot of the standardized residuals versus fitted values (excluding Alaska).

Figure 7.9 Plot of the standardized residuals versus region (excluding Alaska).
Table 7.6 Weights cj for Weighted Least Squares
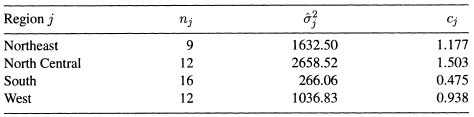
Table 7.7 OLS and WLS Coefficients for Education Data (n = 49), Alaska Omitted

To proceed with the analysis we must obtain the weights. They are computed from the OLS residuals by the method described above and appear in Table 7.6. The WLS regression results appear in Table 7.7 along with the OLS results for comparison. The standardized residuals from the transformed model are plotted in Figures 7.10 and 7.11. There is no pattern in the plot of the standardized residuals versus the fitted values (Figure 7.10). Also, from Figure 7.11, it appears that the spread of residuals by geographic region has evened out compared to Figures 7.4 and 7.9. The WLS solution is preferred to the OLS solution. Referring to Table 7.7, we see that the WLS solution does not fit the historical data as well as the OLS solution when considering ![]() or R2 as indicators of goodness of fit.4 This result is expected since one of the important properties of OLS is that it provides a solution with minimum
or R2 as indicators of goodness of fit.4 This result is expected since one of the important properties of OLS is that it provides a solution with minimum ![]() or, equivalently, maximum R2. Our choice of the WLS solution is based on the pattern of the residuals. The difference in the scatter of the standardized residuals when plotted against Region (compare Figures 7.9 and 7.11) shows that WLS has succeeded in taking account of heteroscedasticity.
or, equivalently, maximum R2. Our choice of the WLS solution is based on the pattern of the residuals. The difference in the scatter of the standardized residuals when plotted against Region (compare Figures 7.9 and 7.11) shows that WLS has succeeded in taking account of heteroscedasticity.

Figure 7.10 Standardized residuals versus fitted values for WLS solution.

Figure 7.11 Standardized residuals by geographic region for WLS solution.
It is not possible to make a precise test of significance because exact distribution theory for the two-stage procedure used to obtain the WLS solution has not been worked out. If the weights were known in advance rather than as estimates from data, then the statistical tests based on the WLS procedure would be exact. Of course, it is difficult to imagine a situation similar to the one being discussed where the weights would be known in advance. Nevertheless, based on the empirical analysis above, there is a clear suggestion that weighting is required. In addition, since less than 50% of the variation in Y has been explained (R2 = 0.477), the search for other factors must continue. It is suggested that the reader carry out an analysis of these data by introducing indicator variables for the four geographical regions. In any model with four categories, as has been pointed out in Chapter 5, only three indicator variables are needed. Heteroscedasticity can often be eliminated by the introduction of indicator variables corresponding to different subgroups in the data.
7.5 FITTING A DOSE-RESPONSE RELATIONSHIP CURVE
An important area for the application of weighted least squares analysis is the fitting of a linear regression line when the response variable Y is a proportion (values between zero and one). Consider the following situation: An experimenter can administer a stimulus at different levels. Subjects are assigned at random to different levels of the stimulus and for each subject a binary response is noted. From this set of observations, a relationship between the stimulus and the proportion responding to the stimulus is constructed. A very common example is in the field of pharmacology, in bioassay, where the levels of stimulus may represent different doses of a drug or poison, and the binary response is death or survival. Another example is the study of consumer behavior where the stimulus is the discount offered and the binary response is the purchase or nonpurchase of some merchandise.
Suppose that a pesticide is tried at k different levels. At the jth level of dosage xj, let rj be the number of insects dying out of a total nj exposed (j = 1, 2,…, k). We want to estimate the relationship between dose and the proportion dying. The sample proportion pj = rj/nj is a binomial random variable, with mean value πj and variance πj(1 – πj)/nj, where πj is the population probability of death for a subject receiving dose xj. The relationship between π and X is based on the notion that
where the function f(·) is increasing (or at least not decreasing) with X and is bounded between 0 and 1. The function should satisfy these properties because (1) π being a probability is bounded between 0 and 1, and (2) if the pesticide is toxic, higher doses should decrease the chances of survival (or increase the chances for death) for a subject. These considerations effectively rule out the linear model
because πj would be unbounded.

Figure 7.12 Logistic response function.
Stimulus-response relationships are generally nonlinear. A nonlinear function which has been found to represent accurately the relationship between dose xj and the proportion dying is
The relationship (7.12) is called the logistic response function and has the shape shown in Figure 7.12. It is seen that the logistic function is bounded between 0 and 1, and is monotonic. Physical considerations based on concepts of threshold values provide a heuristic justification for the use of (7.12) to represent a stimulus-response relationship (Cox, 1989).
The setup described above differs considerably from those of our other examples. In the present situation the experimenter has the control of dosages or stimuli and can use replication to estimate the variability of response at each dose level. This is a designed, experimental study, unlike the others, which were observational or nonexperimental.
The objectives for this type of analysis are not only to determine the nature of dose-response relationship but also to estimate the dosages which induce specified levels of response. Of particular interest is the dosage that produces a response in 50% of the population (median dose).
The logistic model (sometimes called logit model) has been used extensively in biological and epidemiological work. For analyzing proportions from binary response data, it is a very appealing model and easy to fit.
An alternative model in which the response function is represented by the cumulative distribution function of the normal probability distribution is also used. The cumulative curve of the normal distribution has a shape similar to that of the logistic function. This model is called the probit model, and for details we refer the reader to Finney (1964).
Besides medicine and pharmacology, the logistic model has been used in risk analysis, learning theory, in the study of consumer behavior (choice models) and market promotion studies.
Since the response function in (7.12) is nonlinear, we can work with transformed variables. The transformation is chosen to make the response function linear. However, the transformed variables will have nonconstant variance. Then, we must use the weighted least squares methods for fitting the transformed data.
A whole chapter (Chapter 12) is devoted to the discussion of logistic regression models, for we believe that they have important and varied practical applications. General questions regarding the suitability and fitting of logistic models are considered there.
EXERCISES
7.1 Repeat the analysis in Section 7.4 using the Education Expenditure Data in Table 5.12.
7.2 Repeat the analysis in Section 7.4 using the Education Expenditure Data in Table 5.13.
7.3 Compute the leverage values, the standardized residuals, Cook's distance, and DFITS for the regression model relating Y to the three predictor variables X1, X2, and X3 in Table 7.3. Draw an appropriate graph for each of these measures. From the graph verify that Alaska and Utah are high leverage points, but only Alaska is an influential point.
7.4 Using the Education Expenditure Data in Table 7.3, fit a linear regression model relating Y to the three predictor variables X1, X2, and X3 plus indicator variables for the region. Compare the results of the fitted model with the WLS results obtained in Section 7.4. Test for the equality of regressions across regions.
7.5 Repeat the previous exercise for the data in Table 5.12.
1 The notion of pure error can also be used to obtain a test for lack of fit (see, e.g., Draper and Smith (1998)).
2 http://www.ilr.cornell.edu/˜hadi/RABE4
3 If we denote a variable with a double subscript, i and j, with j representing region and i representing observation within region, then each variable for an observation in region j is divided by cj. Note that β0 is the coefficient attached to the transformed variable 1/cj. The transformed model is
![]()
and the variance of ![]() is σ2. Notice that the same regression coefficients appear in the transformed model as in the original model. The transformed model is also a no-intercept model.
is σ2. Notice that the same regression coefficients appear in the transformed model as in the original model. The transformed model is also a no-intercept model.
4 Note that for comparative purposes, ![]() for the WLS solution is computed as the square root of
for the WLS solution is computed as the square root of
![]()
and ![]() , are the fitted values computed in terms of the WLS estimated coefficients and the weights, cj; weights play no further role in the computation of
, are the fitted values computed in terms of the WLS estimated coefficients and the weights, cj; weights play no further role in the computation of ![]() .
.