If you’re new to form scripting in Microsoft Dynamics CRM, you might wonder what’s the best approach for testing and debugging your scripts. We recommend that you use theMicrosoft Visual Studio integrated debugger attached to Internet Explorer when testing form scripting in Microsoft Dynamics CRM.
Even though Microsoft Dynamics CRM supports different scripting languages, most developers use JavaScript for their scripting. JavaScript offers a debugger statement, and we recommend utilizing it as part of your script debugging. To use this helpful statement in conjunction with Internet Explorer to achieve an integrated script debugging experience,follow the procedures described in this section.
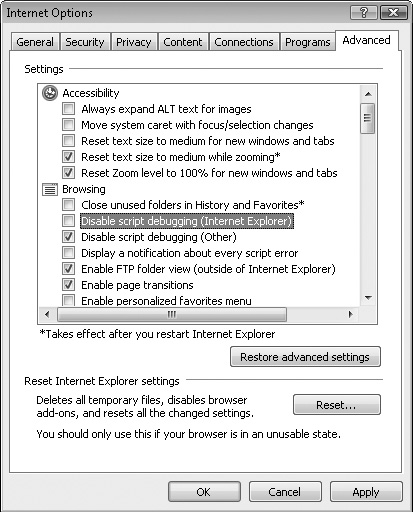
First you need to configure Internet Explorer to allow for script debugging.
Configuring Internet Explorer
Open Internet Explorer, click Tools, and then click Internet Options.
On the Advanced tab, clear the Disable Script Debugging (Internet Explorer) option.
Now you just need to add the debugger command in the JavaScript code and refresh the page in the browser to start the debugging process.
Example 7-1 offers a quick example of how this works. Add the simple JavaScript e-mail validation code shown in the listing to the onChange event of an account’s e-mail address and check the Event Is Enabled box. Notice that we added the debugger statement in thefirst line.
Example 7-1. JavaScript debugging example
debugger;
var oEmailAddress1 = document.crmForm.all.emailaddress1;
var sCleanedEmailAddress = oEmailAddress1.DataValue.replace(/[^0-9,A-Z,a-z,@,.]/g,
"");
var regexEmail = /^.+@.+..{2,3}$/;
// Test the cleaned e-mail string against the e-mail regular expression
if ( (regexEmail.test(sCleanedEmailAddress)) )
{
oEmailAddress1.DataValue = sCleanedEmailAddress;
}
else
{
alert("The E-mail Address appears to be invalid. Please correct.");
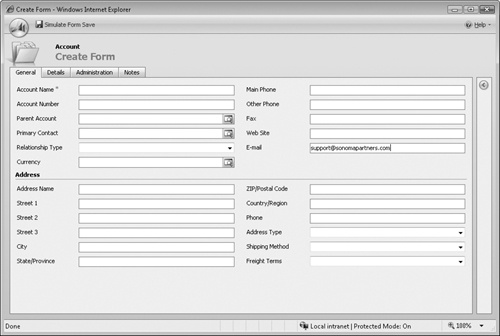
}Preview the account form and type an e-mail address in the E-mail field, as shown in Figure 7-2.
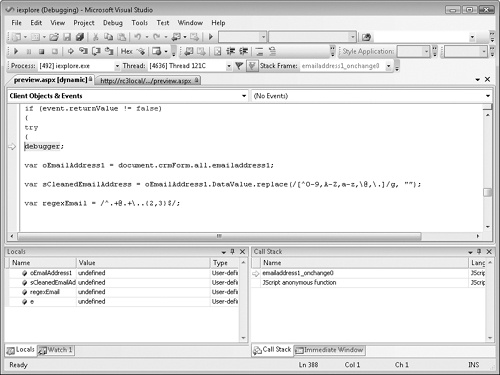
After you leave the field, the onChange code executes and your debugger statement displays the Visual Studio dialog box shown in Figure 7-3.

You can start a new instance of Visual Studio 2008 and then perform real-time debugging of the JavaScript code, as shown in Figure 7-4.
We recommend the following additional testing and debugging techniques when developing your custom scripts:
Always test your scripts in a Microsoft Dynamics CRM development environment and not on production servers.
When possible, set up a simple Web page with a test form, and test your JavaScriptoutside Microsoft Dynamics CRM. This approach provides for faster development and debugging. Then, copy and paste the final code into the appropriate Microsoft Dynamics CRM event.
Use the Preview command to test your client-side scripts before publishing.
If it appears that your code doesn’t work as expected, first ensure that you enabled your event. You should then use the JavaScript integrated debugging technique described earlier. If you have trouble getting integrated debugging to work, you can always use the alert() method to output various logic points and try to eliminate the interaction with Microsoft Dynamics CRM first. In many cases, the flaw may be contained in the code logic itself, independent of the integrated properties of Microsoft Dynamics CRM.