C H A P T E R 3
Introduction to Reporting Services Design with SQL Server Data Tools
The professional lines separating system administrators, DBAs, and developers are blurring. Products are often extensible through code or at least have the potential to create functionality that goes well beyond that of out-of-the-box offerings. SSRS is such an application. The days of the Microsoft Management Console (MMC) are numbered and will be overshadowed by the new interface on the block, the IDE, though even that isn’t new by any means, as any developer will tell you. However, system administrators, DBAs, and even report designers have had to become familiar with this new way of performing their day-to-day tasks. As you’re probably well aware, you can create reports for SSRS within Visual Studio 2005 and up, or within BIDS/SSDT. To remind you of these abbreviations, the designer included with SSRS 2005 through the 2008 R2 release was labeled as Business Intelligence Development Studio (BIDS). However, in the 2012 release, Microsoft decided to re-label the designer as SQL Server Data Tools (SSDT) because of the inclusion of features such as further development integration with SQL Azure environments. The ability to use SSDT/BIDS is advantageous for Visual Studio developers, because now they can use the same IDE for report creation and application development! For the rest of us, creating reports in Visual Studio 2010 presents a learning curve.
SQL Server 2005 introduced two new management and development environments, BIDS, a subset of Visual Studio 2005, and SSMS. In SQL Server 2008, 2008 R2 and 2012, these applications have been enhanced to improve the integration of design and management functionality in a common set of tools.
Now that you have developed your queries and stored procedures, you can turn your attention to the tools available to report designers when SQL Server is installed. Over the next three chapters we’ll familiarize you with the tools of report design before showing you how to create a full-blown SSRS report in Chapter 6. The topics we’ll cover include the following:
- The elements of SQL Server Data Tools (SSDT/BIDS)
- The role of RDL in SSRS with sample code from the various report objects it controls
- Creating a data source and dataset
- Defining query and report parameters
- Discussing report pagination
- Defining expressions and filters to demonstrate how you can use them together to control report content and formatting
- Implementing Tablix properties, new in SSRS 2008, which extend the functionality of several data regions by combining row grouping and column grouping
- Creating data region samples: the List, Textbox, Table, Rectangle, Matrix, Chart, and Image
- Implementing Maps, Data Bars, Sparklines and Indicators, all of which provide more sophisticated dashboard style elements to reporting
In this chapter, we’ll show you how to set up and explore the SSDT/BIDS IDE using the embedded elements of SSRS within the 2010 environment.
Everyone learns differently—some like to follow a step-by-step guide to a known conclusion, and some like to view a completed report to see the specific components of its design. We will therefore offer both approaches in this and subsequent chapters. Specifically, we’ll show you how to build each sample from the ground up and we’ll also point you to the completed sample in the Source Code download available from this book’s catalog page on www.apress.com, so you can analyze the report as you work through the steps to achieve the end result.
We provide all the data sources, reports, and projects you will work with throughout this chapter in a solution called Pro_SSRS. You can open this solution in both BIDS and Visual Studio 2010. As we mentioned earlier, Microsoft has changed the label from Business Intelligence Development Studio to SQL Server Data Tools (SSDT), but we will use BIDS and SSDT interchangeably throughout this book. You’ll find detailed instructions in the Source Code/Download area on the Apress site for installing the samples for each chapter. This chapter will focus primarily on the IDE of BIDS and provide a step-by-step guide to familiarize you with BIDS. Chapter 4 will describe the use of SSRS-specific report objects such as Lists and Tables, and Chapter 5 will introduce report objects like Charts, Gauges, Maps, Sparklines, and Data Bars. When you begin creating these specific report examples, you will have two reports for each object, a starting-point report and a completed report sample; we will point these out at the beginning and end of each main section. This approach lets you step through the procedure to produce the output in the starting-point report and then open and compare the end result to the completed report.
Exploring the Elements of BIDS
In BIDS, one or more projects contain all the reports and shared data sources. A project physically and logically groups reports together, and maintains properties specific to that project. These properties allow the project to work independently of other projects. All created projects are themselves contained within a solution. A solution is simply a collection of one or more projects that are made available to Visual Studio. A single solution can contain a Reporting Services, an Integration Services and an Analysis Services project as well as a Windows or Web application project.
We’ll now show you how to fire up BIDS to create a solution and a Reporting Services project. To create a solution, you’ll need to have BIDS loaded. Navigate to the shortcut to load the devenv executable by choosing Start ![]() All Programs
All Programs ![]() Microsoft SQL Server 2012
Microsoft SQL Server 2012 ![]() SQL Server Data Tools. Both SQL Server Data Tools (SSDT) and Business Intelligence Development Studio (BIDS) are shortcuts to the
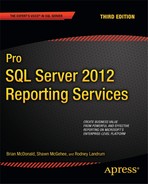
SQL Server Data Tools. Both SQL Server Data Tools (SSDT) and Business Intelligence Development Studio (BIDS) are shortcuts to the devenv executable. Throughout this chapter and the rest of the book, we may refer to SSDT as BIDS because most development initiatives using this tool are Business Intelligence related. However, BIDS and SSDT are interchangeable terms. Once you have BIDS open, you can get to the new project screen by selecting File, and then Project under the New submenu of the menu bar or simply by clicking the New Project button on the Start Page as shown in Figure 3-1.
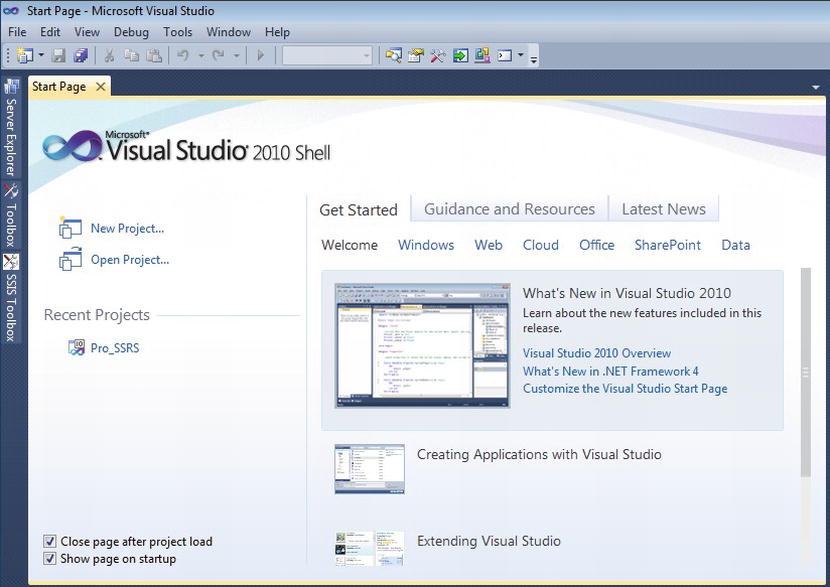
Figure 3-1. Business Intelligence Development Studio Start Page
The New Project dialog box opens. Select Report Server Project under Installed Templates ![]() Business Intelligence
Business Intelligence ![]() Reporting Services. If this is the first project that you have created, the project name defaults to Report Project1. The location of the project can be a local drive or a network location. In this case, make it
Reporting Services. If this is the first project that you have created, the project name defaults to Report Project1. The location of the project can be a local drive or a network location. In this case, make it C:Pro_SSRSReports.
By default, the solution is named according to the project name, Report Project1, as shown in Figure 3-2. If you check the Create Directory for Solution box, you can append a new directory to the base location. In this case, choose Solution1. After you click OK, both the project and solution are created, and you can create report items and data sources within the project.
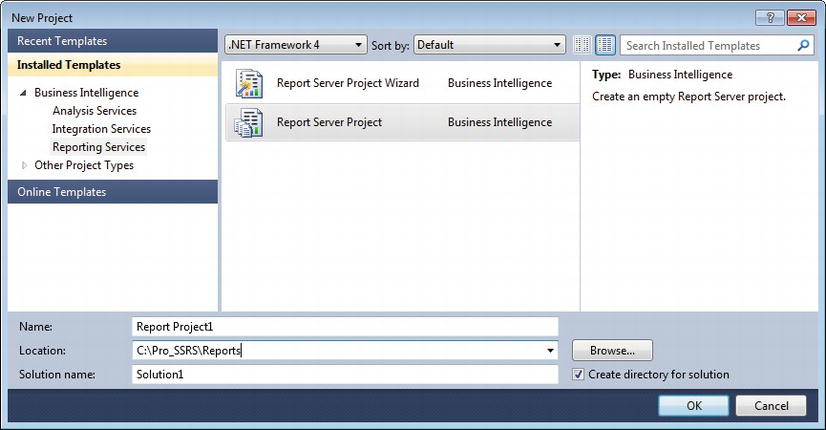
Figure 3-2. New Project dialog box
If you know where your reports are going to be deployed, it is considered good practice to add a few important project property settings: the target folder in which to deploy the reports on the SSRS server, and the SSRS server URL. You can view and set these properties using the Solution Explorer, whose window displays the opened solution and the projects it contains, as well as all the reports and other objects the individual projects might contain. By default, BIDS locates the Solution Explorer on the right side of the environment, but it may be docked or floating in a different location. If you do not see it, click View ![]() Solution Explorer on the menu bar. Highlight the project in the Solution Explorer and choose Project
Solution Explorer on the menu bar. Highlight the project in the Solution Explorer and choose Project ![]() Properties from the menu (or right-click the project and select Properties) to see a window like the one in Figure 3-3. The
Properties from the menu (or right-click the project and select Properties) to see a window like the one in Figure 3-3. The TargetReportFolder property controls the folder that is created to store the deployed reports and data sources on the SSRS server. You can use the TargetDataSourceFolder and TargetDatasetFolder properties to store the project specific data sources and shared datasets. The TargetServerURL property is the SSRS Web server URL (when you start to use SharePoint Integration Mode, as you will when you get to Chapter 12, this property will contain the SharePoint server URL). As Figure 3-3 shows, the TargetServerURL property is in the form http://servername/ReportServer. In this case, the SSRS Web server is localhost.
Figure 3-3. Project properties
![]() Note We’ll cover some of these other settings, such as
Note We’ll cover some of these other settings, such as TargetDatasetFolder, TargetDataSourceFolder, and TargetReportPartFolder, in Chapter 8. However, unless the object needs to be consumed by report developers or end users with no access to the specified TargetReportFolder, its good practice to store your project objects using the folder structure that you set in the TargetReportFolder. For example, the TargetReportFolder in Figure 3-3 is Pro_SSRS and the TargetDataSourceFolder is set to Pro_SSRS/DataSources. This prevents other developers overwriting your data sources, datasets or report parts.
Setting Up a Basic IDE
Now that you have a new solution and a new project to contain the reports you’ll build, it’s time to get personal. As a report designer, you’re going to spend many hours gazing at the pixels that are your creations, so it’s important to set up the environment exactly the way you want it. The ideal setup for designing reports is a personal choice. Some prefer high-resolution display settings with every available design toolbar always in view within the environment, while others like undocked toolbars and a dual monitor set up at a lower resolution. Whatever your preference, BIDS makes it easy to manipulate the design tools within the IDE to personalize your configuration. In addition to the Solution Explorer, covered in the previous section, you can use several common tools within the IDE to design reports:
The Toolbox: This is where you’ll find all the report objects covered in this chapter, such as the Matrix and Table data regions. Data regions are the defined report objects within the SSRS report design environment that contain the field values from the data set.
The Properties window: Here, you set the values for the various formatting and grouping properties for report items.
The Error List window: You will need this when troubleshooting report errors. Mismatched data types and invalid use of functions are common issues that arise when designing reports. The Error List window is the place to see the details of these errors.
The Report Data window: This holds the built-in fields, data sources, datasets, images, and the field information you’ve defined for the report.
Figure 3-4 shows a custom layout for designing reports in SSRS. You can dock any toolbar anywhere within the IDE or position them beyond it on the desktop. This setup works best with a high-resolution configuration, 1152 × 864 or higher. In the setup in Figure 3-4, the Toolbox is undocked, and the Solution Explorer is on the right side of the report design grid. If you wish, you can set the toolbars to hide automatically when not in use—in this example, the button to display the hidden Report Data pane is shown at top left. BIDS, like the full Visual Studio 2010 environment, has a dock position map that assists in precisely placing the dockable item. You can see the map, with a slight transparency at all edges and in the middle, as you move items around within the report designer.
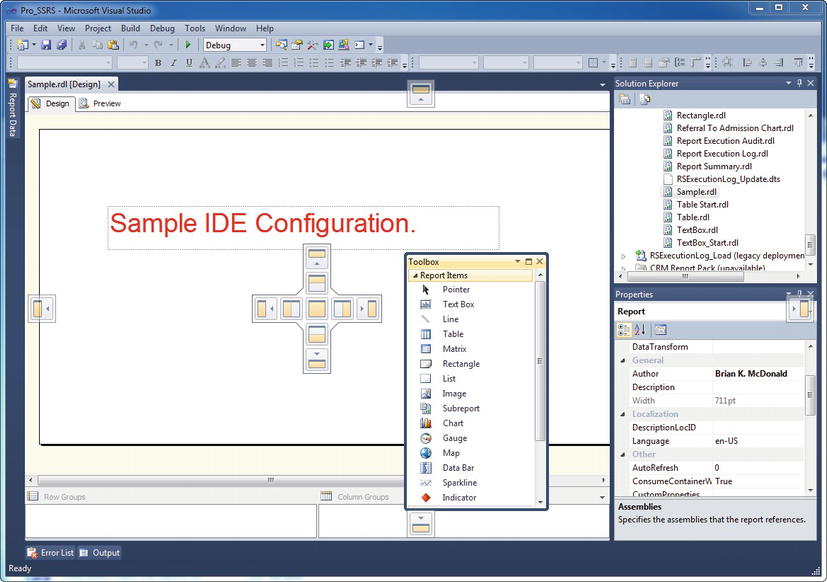
Figure 3-4. Sample IDE configuration
Understanding Report Definition Language (RDL)
RDL is the standard to which all reports created with the embedded SSRS tools in Visual Studio 2010 and other SSRS services adhere. RDL is an XML-based schema that defines each element of a report, such as formatting, dataset information, grouping and sorting, and parameters and filters. As you add items to the report, the RDL code changes to include each addition.
In the IDE, these code changes are typically invisible, as they take place in the background. Occasionally, however, you might need to modify the RDL directly to make global changes using a find-and-replace method. We’ve had to do this several times when a parameter or field name changed in a source’s stored procedure. When you are working on a report in Visual Studio 2010, you can view the RDL code directly by clicking View ![]() Code from the menu or by right-clicking a report and selecting View Code.
Code from the menu or by right-clicking a report and selecting View Code.
Visual Studio 2010 and BIDS are the main report designers for SSRS currently, but as more and more companies embrace RDL, other report designers may become available. In fact, in SQL Server 2005, Microsoft introduced a Report Builder application that allows an end user to design and publish SSRS reports. SQL Server 2008 included a new version, appropriately named Report Builder 2.0, with Microsoft Office Ribbon technology and a complete facelift taking it one step further toward putting report development into the hands of report requesters. Report Builder 3.0, released with SQL Server 2008 R2, had even more features for ad hoc end-user reporting. Report Builder 1.0 and 2.0 are still available for backward compatibility, and 1.0 still relies on report models for its data sources, unlike 2.0 and 3.0. Chapter 13 covers Report Builder 1.0, 2.0, and 3.0 applications, and their components, in more detail.
Throughout this chapter, we’ll present the RDL sections of the report objects on which you are working to show how the RDL is updated while designing a report. The complete RDL schema is available at http://schemas.microsoft.com/sqlserver/reporting/2008/01/reportdefinition.
Adding a Report
In line with Microsoft’s general policy, there is more than one way to add a report to a project. One way is to employ a wizard to work through the report creation process, but for now, we are just going to add a blank report to our project. Right-click the Reports folder in the Solution Explorer, select Add, and then New Item. Notice that you have the option of adding an existing item as well. This option is useful if you already have a report to add to a project or if you’ve built a template report file as a base starting point. For now, select Report in the Add New Item dialog box as shown in Figure 3-5 below, and then click Add to create a blank report named Report1.rdl in the project.
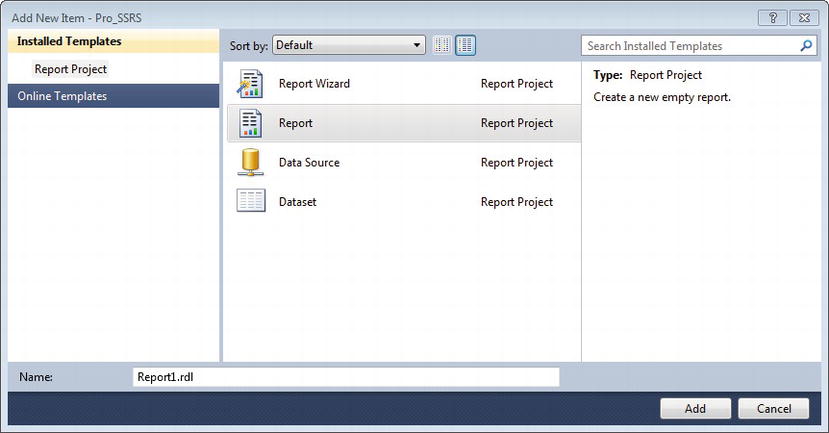
Figure 3-5. Add New Item Dialog Box in BIDS
The new report should open up in the design environment, but if it doesn’t, double-click the new report in the Solution Explorer. By default the report is named Report##.rdl, where ## is the next available report number in sequence. At this point, the report is a blank slate. Figure 3-6 shows the IDE, including the Solution Explorer, Toolbox and Report Data boxes. If you are familiar with creating reports in Visual Studio 2005, you will notice that the Data tab has been separated from the Design and Preview tab and now resides in a dedicated Report Data window. In the SQL Server 2008 R2 release, we were provided another folder in the Report Data pane called Data Sources. For now, just keep in mind that this new IDE has been designed to centralize your local and shared data sources. Again, coming from VS 2005, you will notice the new Row Groups and Column Groups areas, designed for easier management of Tablix-style groupings. As with any report that contains data from a data source, the first step is to create a link between the report and the data source as well as one or more datasets. We will do both in the next section.

Figure 3-6. BIDS IDE with Report1.rdl loaded
Setting Up Data Sources and Datasets
Each report created in SSRS contains both a data source and a dataset. A data source not only defines the type of connection that is established to retrieve the data, whether it’s SQL Server, Analysis Services, or Oracle, but also defines the specific connection properties, such as the server, database name and security credentials. A dataset, on the other hand, is the data, rows and columns, or fields that are returned from the data source. The dataset is created by building a query that retrieves information from the data source. This query, as in the case of a SQL Server data source, can be a text-based query embedded directly in the report, or a stored procedure.
In Chapter 2, you created a stored procedure called Emp_Svc_Cost, containing employee and patient visit information. You’ll use that procedure as your dataset as you work with most of the report objects in this chapter. For other report objects, such as the image report object, you will use direct queries instead of the Emp_Svc_Cost stored procedure.
Creating a Data Source
Each report can use one or more data sources. Reports that use the same data source—for example, one that connects to a specific SQL Server database—can use what is referred to in SSRS as a shared data source. Shared data sources are published along with the report and can be modified on the report server after deployment. In BIDS, shared data sources contain several properties that you must configure before you can use them.
Let’s step through the process of creating the shared data source for the stored procedure Emp_Svc_Cost. First, right-click Shared Data Sources in the Solution Explorer, and select Add New Data Source; the Shared Data Source Properties dialog box will appear. Second, click the Edit button in the dialog box to create the connection string. In this case, you know that the server that contains your source database and stored procedure is located on the local SQL Server, so you can type localhost as the server name. Because we left the default connection type on the previous window, the data source property is set to Microsoft SQL Server (SqlClient). After you type localhost as the server, you can choose the Pro_SSRS database from the database drop-down selection. In this case, because the database is configured to use both Windows and SQL authentication, choose the Use Windows Authentication option. If you choose to use SQL authentication, you can also choose to store the SQL username and password. Generally, Windows Authentication is the preferred method because it has a single point of login for users (Chapter 11 covers authentication for deployed reports). Figure 3-7 shows the data source connection properties. You can test the connection by clicking the Test Connection button.
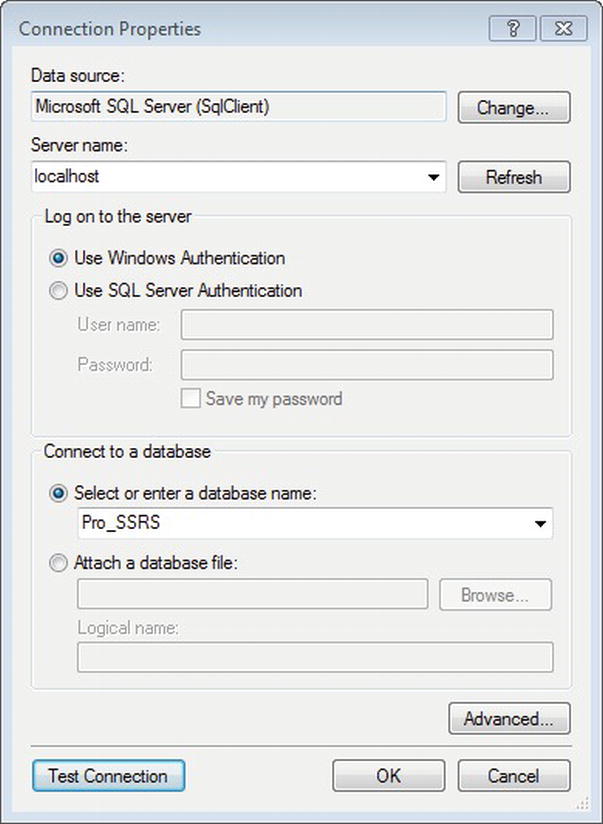
Figure 3-7. Data source connection properties
![]() Note In Reporting Services 2012, you can choose from many types of data source. SQL Server happens to be the default, but you can grab data from sources such as SQL Azure, Analysis Services, Oracle, SAP, and TERADATA. You can use generic OLE DB and ODBC data sources as well, of course.
Note In Reporting Services 2012, you can choose from many types of data source. SQL Server happens to be the default, but you can grab data from sources such as SQL Azure, Analysis Services, Oracle, SAP, and TERADATA. You can use generic OLE DB and ODBC data sources as well, of course.
You now have a shared data source. Notice that its name has defaulted to DataSource1. You can rename it by right-clicking it, selecting Rename, and entering Pro_SSRS.rds as the new name. It is good practice to give each data source a meaningful name, such as the name of the database it will connect to. In a real-world environment, you will be deploying your reports and/or databases on different servers, so it’s not advisable to prefix the data source name with the name of the server containing the database. In other words, it is not recommended to name your data source DEV_Pro_SSRS to represent a development data source, would you want to name your data source something like Server1_Pro_SSRS.
In practice, we’ve developed all our reports using an identical data source name. However, because each of our online customers had a database name that uniquely identified them, we designed an application that reset the database properties in the data source after it was published. In this way, we could use the same reports against the same database schema, but we could deploy them to multiple customers on the same report server.
In this example, the data source file you created has an .rds extension and is stored and published separately from the report. You can open an .rds file in a text editor, because it’s an XML file that defines the connection properties you just created graphically. Listing 3-1 shows the Pro_SSRS.rds file.
Listing 3-1. Pro_SSRS.rds File
<?xml version="1.0" encoding="utf-8"?>

<RptDataSource xmlns:xsi=http://www.w3.org/2001/XMLSchema-instance xmlns:xsd="http://www.w3.org/2001/XMLSchema">

<Name>Pro_SSRS</Name>

<ConnectionProperties>

<Extension>SQL</Extension>

<ConnectString>Data Source=localhost;Initial Catalog=Pro_SSRS </ConnectString>

<IntegratedSecurity>true</IntegratedSecurity>

</ConnectionProperties>

<DataSourceID xmlns="http://schemas.microsoft.com/SQLServer/reporting/ reportdesigner">99401d15-cd9b-489a-b3ee-e027de26a4e0 </DataSourceID> </RptDataSource>
Creating a Dataset
Your next step is to proceed to the Report Data area to create your first dataset. This is true regardless of whether you’ve developed a query or stored procedure in an application other than BIDS or whether you’re beginning it now within the report. In this example, you are going to use a stored procedure that is already complete and tested, so half the battle is done.
Using BIDS to develop SSRS 2008 R2 and SSRS 2011 reports, you create a dataset in two steps: creating a link to a data source and getting the data for the report.
- In the Report Data box, select
<New ~Dataset...>, which opens the Dataset Properties dialog box. Each dataset defaults to a name of the formDataSet##, where##is the next unused number in sequence.- You can use a shared dataset but in this example you will utilize a dataset embedded in the report. Choose Use a dataset embedded in my report option.
- Now create a link between this dataset and the data source that we created earlier. Click the New button next to the data source drop-down box.
- In the Data Source Properties window, name the data source
Pro_SSRSand choose Use shared data source reference.- Click on the drop-down list box and select the
Pro_SSRSshared data source that we created earlier.- Figure 3-8 shows the Data Source Properties windows with these settings. Click OK to save your settings.
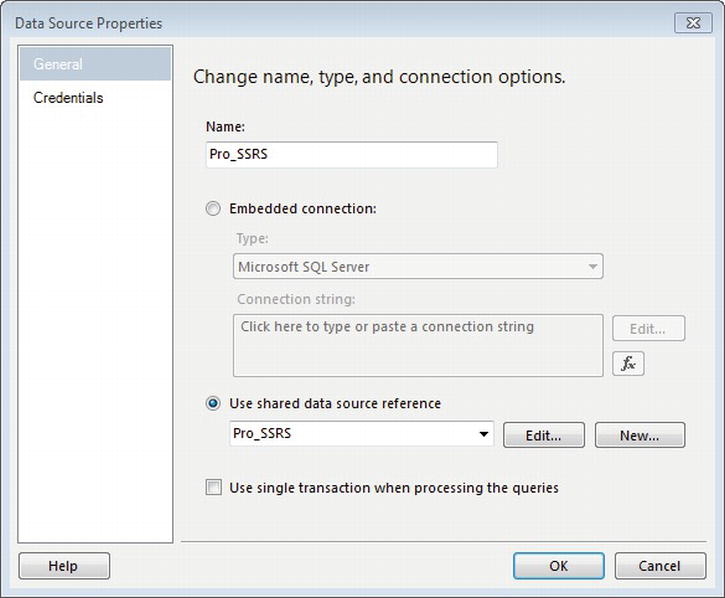
Figure 3-8. Data source properties
Now that we have a link to our shared data source, we can point the dataset to our stored procedure. In the Query Type section, change the default, Text, to Stored Procedure. In the Select or enter stored procedure name textbox, input the name of your stored procedure, Emp_Svc_Cost, as shown in Figure 3-9. Finally, enter Pro_SSRS_DS for the name of the new dataset and click OK to complete the dataset configuration.

Figure 3-9. Dataset properties
When you click OK, a few things happen behind the scenes in the Report Data window. A data source called Pro_SSRS is created under the Data Sources folder and a dataset named Pro_SSRS_DS is created under the Datasets folder. This dataset is populated with the available fields from the stored procedure. At the same time, BIDS creates all of the parameters that the stored procedure accepts. You can’t see the actual data at this point, but you can right-click the dataset and select Query… to bring up the default generic query editor where you can execute the stored procedure. At execution time, you are prompted for any parameters that have been defined by the stored procedure; you must supply the parameter values before data is returned. In the case of this stored procedure, define five parameters: @ServiceYear, @ServiceMonth, @BranchID, @EmployeeTblID, and @ServicesLogCtgryID. The available default values for the parameters, when the stored procedure is executed in the Report Data box, are either NULL or Blank. Unlike a NULL value, a Blank value can be an empty string. A NULL value indicates that the value is unknown, and NULL values can’t be evaluated with non-NULL values. In Chapter 2, you built logic into the stored procedure to handle NULL parameter values so that when the user doesn’t supply a value, the query returns all records. If the user selects a specific value, only the records that match that parameter value are returned. Execute the stored procedure with NULL values, and make sure you’re getting the results you expect. You can see the results of the stored procedure execution in Figure 3-10.

Figure 3-10. Data returned from the stored procedure
![]() Note When you are prompted for the parameter values,
Note When you are prompted for the parameter values, Blank is the default value. To have the stored procedure execute without a data type error, you must select the value of NULL.
An SSRS report can use multiple datasets simultaneously. This extends the flexibility of your reporting, as you can provide more data to the user in a single report. Multiple datasets are also useful for populating parameter drop-down lists, which you will do in Chapter 6. However, having too many datasets could affect a report’s performance, so it’s important to make sure the execution times for each result set are within acceptable ranges.
The RDL file for each report contains a section for each dataset defined for the report. Listing 3-2 shows a sample of the RDL for the dataset you’ve defined in this chapter.
Listing 3-2. Dataset Section of RDL
<DataSets>

   <DataSet Name="Pro_SSRS_DS">

<Fields>

   <Field Name="PatID">

<DataField>PatID</DataField>

        <rd:TypeName>System.Int32</rd:TypeName>

   </Field>

   <Field Name="Patient_Name">

<DataField>Patient Name</DataField>

<rd:TypeName>System.String</rd:TypeName>

   </Field>

   <Field Name="BranchName">

<DataField>BranchName</DataField>

<rd:TypeName>System.String</rd:TypeName>

   </Field>

   <Field Name="EmployeeID">

<DataField>EmployeeID</DataField>

<rd:TypeName>System.String</rd:TypeName>

   </Field>

   <Field Name="Employee_Name">

<DataField>Employee Name</DataField>

<rd:TypeName>System.String</rd:TypeName>

   </Field>

   <Field Name="EmployeeClassID">

<DataField>EmployeeClassID</DataField>

<rd:TypeName>System.String</rd:TypeName>

   </Field>

   <Field Name="Service_Type">
When creating a dataset, several additional tabs contain other configuration properties:
Fields: Defines additional fields such as calculated fields or fields that aren’t automatically defined with the data source. You derive calculated fields from an expression.
Options: Sets several options specific to the data as it’s retrieved from the data provider, such as case sensitivity and collation.
Parameters: Defines the query parameter values for the dataset and the order in which they’re evaluated. Stored procedures with declared parameters automatically generate the query parameters in SSRS.
Filters: Defines filter values for the dataset that you can use when the report is executed.
Creating Other Data Sources
One exciting aspect of SSRS is its ability to query multiple data source types as well as SQL Server. As mentioned previously, any ODBC or OLE DB provider can be a data source for SSRS, as can XML, SSIS, and SAP. For a simple example of using a data source other than a SQL Server database, let’s look at the OLE DB Provider for Microsoft Directory Services. Creating the data source to Directory Services is similar to procedure you used to create the SQL Server data source, except that you select OLE DB as the data source and OLE DB Provider for Microsoft Directory Services for the OLE DB provider in the data source properties.
By using a direct LDAP query, you can generate field information for use in SSRS like so:
SELECT en,sn,objectcategory,department

FROM  'LDAP://DirectoryServerName/OU=OuName,DC=Company,DC=Com'
The query uses a standard SQL dialect that returns the common name, surname, object category (computer or person), and department from Active Directory. The field names are automatically created and can be used like any other data field for a report.
You must consider a couple of caveats when querying Active Directory or any other data source that doesn’t support the graphical query designer in SSRS:
- Query parameters aren’t supported directly in the query. However, you can define and use report parameters in the query—referred to as a dynamic query—and to filter data.
- Because a graphical query designer isn’t available, you need to develop the query in the generic query designer by typing the query directly and testing. This requires knowledge of Active Directory objects and names.
![]() Tip Several tools are available to assist in managing Active Directory, such as Active Directory Application Mode (ADAM); LDP, an Active Directory tool; and ADSIEdit, a graphical Active Directory browser. Both are included with the Windows Support Tools.
Tip Several tools are available to assist in managing Active Directory, such as Active Directory Application Mode (ADAM); LDP, an Active Directory tool; and ADSIEdit, a graphical Active Directory browser. Both are included with the Windows Support Tools.
Configuring Parameters
Parameters in SSRS come in two flavors, query parameters and report parameters, and the two are often tied together closely.
You use a parameter that’s based on a SQL query or stored procedure to limit the record set returned to the report, typically in the WHERE clause of a query. In the source query, you define parameters by prefacing the parameter’s name with an @ symbol, such as @MyParameter. Within SSRS’s query design tools, this does two things: it forces the query to prompt for the value of the parameter when it’s executed. Secondly, it automatically creates the other parameter, the report parameter, using the same name. With stored procedures, such as Emp_Svc_Cost, which you created in the previous chapter and have used here, any parameters that have been defined in the stored procedure are also automatically created for the report.
Report parameters can exist that are disassociated from a query or stored procedure. For example, you could have a report parameter that controls a report’s behavior or layout properties. When you use a report parameter in this way, it’s often linked to a report filter or used in an expression that controls a property value of a report item. In Figure 3-11, you can see the report parameters that were created automatically for us when we executed the Emp_Svc_Cost stored procedure. You’ll also see the Report Parameters dialog of the individual parameters, such as ServiceMonth, which you open by either double-clicking the parameter or right-clicking and selecting Parameter Properties. The report parameters, in Visual Studio or BIDS, now appear consolidated in the Report Data box, whereas in previous versions they were contained within their own report parameters property box. Report parameters are used within a report, both for setting criteria for datasets and for controlling report design layout elements, which you will do in detail in Chapter 6.
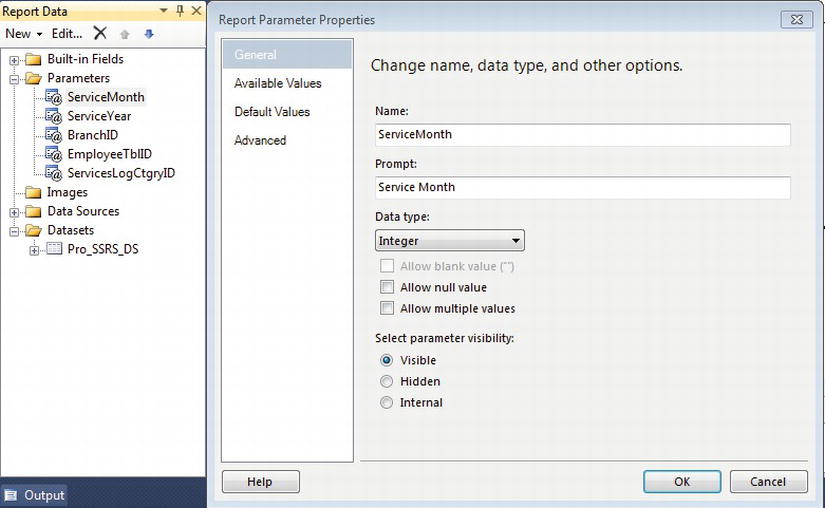
Figure 3-11. Report Parameters dialog box
Figure 3-11 also shows the Allow Multiple Values checkbox, a new SSRS feature for SQL Server 2005. Multivalue parameters allow users to select all values or combinations of values to be used within the report to limit the data that is displayed. When multiple values are chosen, they are passed to the query or stored procedure as a string array. It is important to note that multivalue parameters require the following special considerations when implementing in your reports:
Does not accept NULL values: This is important when deciding which parameters to make multivalued, as it will influence the design of the underlying query or stored procedure. In this case, you built logic into the
Emp_Svc_Coststored procedure to acceptNULLvalues and return all data whenNULLwas passed in from a parameter. You will have to modify this stored procedure to work with multivalue parameters.Will be evaluated as a String: Since a multivalue parameter returns a comma-separated string, you will need to consider the data type assignment for the stored procedure parameters—the report parameter and the query or stored procedure parameter need to have the same data type to work properly.
Affects performance: Multivalue parameters are best used when there is a relatively small list of values. Choosing to allow users to select a range of years—for example, “2010,2011,2012”—is much better than allowing them to select 1,000 patients based on their IDs, as these will all be passed into the stored procedure as a comma-separated string value to be evaluated with the
INorEXISTSclause.Cannot be used in filters: Unlike single-value or nullable parameters in SSRS, multivalue parameters can be used only to pass back to the query or stored procedure, so you can’t use them to limit with report filters.
Requires string manipulation logic in stored procedures: Stored procedures do not evaluate multivalue parameters correctly, so using
IN (@MyReportParameterArray)in a stored procedure, for example, will not return the expected result. This has been an issue with SQL for a long time, and numerous ways, both good and bad, exist to work with multivalue string arrays in stored procedures. Two possible choices are user-defined functions (UDFs) and dynamic SQL. In Chapter 6, which covers the building of a deployable report, we will discuss how to use a special UDF that parses the multivalue report parameter into a table that will work effectively to limit the result set to exactly what is expected.
Setting up Filters
Like parameters, report filters can limit the results of data on a report; however, you don’t necessarily have to use them in conjunction with a parameter. In fact, filters, which can be defined at many points in the report, evaluate an expression and filter the results based on that execution. Filters take this form:
<Filter Expression> <Operator><Filter Value>
An example of a filter is one that limits the data on a report to a specific user or that is based on user input from a parameter value.
Chapter 11 demonstrates how to use a filter that limits the report based on a built-in Global collection, which includes the username of the person executing the report. Filters are beneficial because once the report is rendered you can use them in conjunction with parameters to limit the data in the report without re-querying the data source. In Figure 3-12, you can see a filter that limits the data displayed based on a parameter called User. The logic is this: if the parameter value for User is equal to a field value of User, then include only those records where they match. Otherwise, include all records. Parameters and filters are included as elements of an RDL report file.
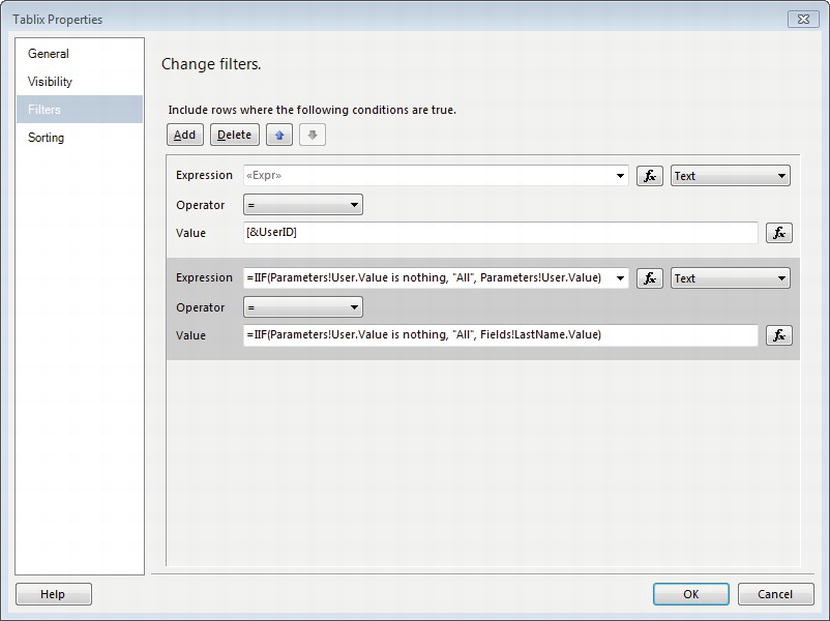
Figure 3-12. Sample filter on a table data region
Listing 3-3 shows the sample RDL elements of a filter.
Listing 3-3. Parameter and Filter RDL Elements
<Filters>

   <Filter>

      <FilterExpression>=IIF(Parameters!User.Value is nothing, "All", Parameters!User.Value)

      </FilterExpression>

      <Operator>Equal</Operator>

          <FilterValues>

               <FilterValue>=IIF(Parameters!User.Value is nothing, "All", Fields!LastName.Value)

               </FilterValue>

         </FilterValues>

   </Filter>

</Filters>
Expressions
Throughout this section, you’ll use fields from the dataset to create sample report segments. Because the values from the fields are derived from expressions that are essentially VB.NET code, we will cover them now because they play a crucial role in the report design process.
You can use expressions to produce a value for any report item that uses them. In SSRS, you can assign expressions to almost any report property, from formatting such as color or padding to the value of a textbox. A simple expression such as that of a field assignment is commonly used while designing reports. In fact, every time you add a field to an area of a report, it’s automatically converted to an expression, like so:
=Fields!FieldName.Value
An expression is signified by prefacing its content with the equal sign (=). You can also concatenate expressions with other functions and literals. We will show several examples of expressions throughout the book. We will list several sample expressions here and show you how to assign them to report items:
=Parameters!ParameterName.Value: Used to assign the value of a parameter to a report item such as a textbox or cell in a table.
=IIF(Fields!FieldName.Value > 10, "Red", "Black"): Used for conditional expressions. In this case, it would set the text color for a property to red if the value ofFieldNamewere greater than 10, black otherwise.
=Fields!FieldNamel.Value & " " & Fields!FieldName2.Value: Used to concatenate the value of two fields.
=Avg(Fields!FieldName.Value):Used to aggregate functions such asSum,Avg,Min,Count, andMaxthat return the aggregate, minimum, or maximum value of the specified field.
=RowNumber(Nothing): Used to maintain a running total for the row numbers in a report. “Nothing” in this case is a scope parameter passed to the function indicating a grouping or dataset. The scope parameter could be a group name or dataset, in which case a new row count would begin at the end of each group or dataset.
In SSRS for SQL Server 2005, the expression builder application used inside the report development environment was rebuilt to give it the type of functionality needed to assist users create useful expressions easily. Thankfully, all releases since then have retained the more advanced expression builder, which lists most of the common functions, along with examples using their syntax; in addition, they are categorized by type (Text, Conversion, and Date & Time). This makes it much quicker to find the right function and place it as part of the expression you are building. Another great feature that developers have become accustomed to, and frankly should not have to live without, is IntelliSense, a contextual, in-line command completion feature. As you can see in Figure 3-13, as you type an expression (in this case a field value expression from your stored procedure), you are prompted with all the possible selections based on that expression. Once the expression is complete and syntactically correct, you can click OK to make the expression part of the report object where you have associated it. If any syntax errors exist, a standard red underline indicates the problem, and a mouse-hover over it will display the type of error, in most cases “Invalid Syntax.” This is a quick introduction to expressions in SSRS, but in Chapter 6, we will use them to perform tasks such as setting default parameter and property values at runtime.
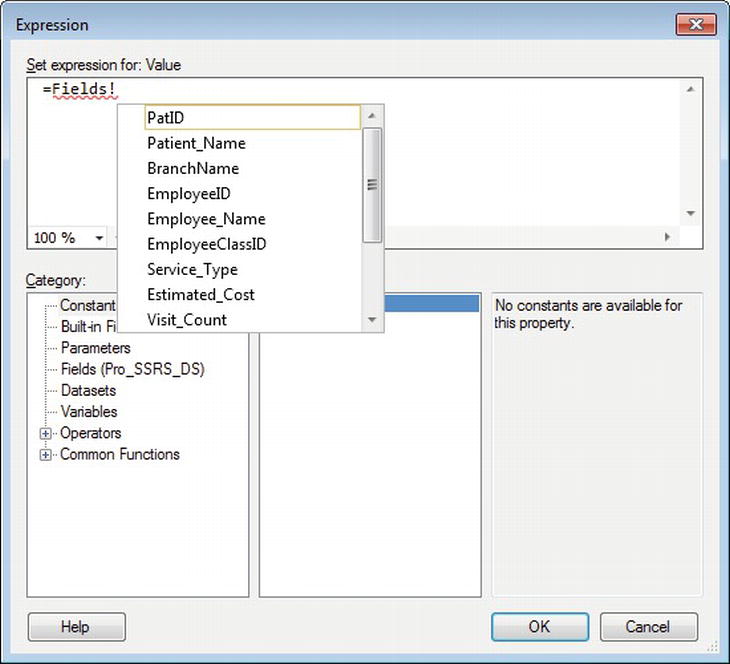
Figure 3-13. IntelliSense: Assigning an expression
Summary
At this point, we have only scratched the surface of what the development environment has to offer. In this chapter, you were introduced to the development environment and some of the basic elements of Reporting Services design. You learned that each report consists of defined elements based on a defined schema in the RDL, which gives SSRS the advantage of standardization. We covered some of the report objects that make up reports such as Data Sources and Datasets. In Chapters 4 and 5, you will learn about all of the objects that will be used to display or represent data returned by our datasets such as the Textbox, Rectangles, and Data Regions like Tablix, List, and Matrix.