C H A P T E R 2
Report Authoring: Designing Efficient Queries
SSRS provides a platform for developing and managing reports in an environment that includes multiple data sources of information. These data sources can include both relational data (for example, SQL Server, Oracle, MySQL, and so on) and non-relational data (for example, Active Directory, LDAP stores, and Exchange Server). Standards such as ODBC, OLE DB, and .NET facilitate the retrieval of data from these disparate data stores, so SSRS can access the data as long as your system has the relevant drivers. In the SSRS report design environment, configuring a dataset that drives the report content is the first step of the design process.
However, before we introduce the many elements of the report design environment, it’s important to begin with the heart of any data-driven report—whether it’s Business Objects Reports, SSRS, or Microsoft Access—and that is the query. With any report design application, developing a query that returns the desired data efficiently is the key to a successful report.
In this chapter, we will describe the following:
The healthcare database that is the target of the reporting queries in this book: You must understand the design of the data before you can design efficient queries. We’ll also describe an easy way to familiarize yourself with your data when the full schema details are not available.
How to design basic but effective SQL queries for reporting purposes: We’ll create queries based on real-world applications, the kind that report writers and database administrators create every day.
How to use SSMS to gauge query performance: The initial query defines the performance and value of the report, so it’s important to understand the tools required to create and test the query to ensure that it’s both accurate and tuned for high performance.
How to transform the optimized query into a parameterized, stored procedure: This gives you the benefit of pre-compilation and cached execution plans for faster performance and the benefit of the procedure being centrally updated and secured on SQL Server.
Introducing the Sample Relational Database
Throughout the book, we’ll show you how to design and deploy a reporting solution and build custom .NET SSRS applications for an SQL Server-based healthcare application, using relational tables and stored procedures. The application was originally designed for home health and hospice facilities that offer clinical care to their patients, typically in their homes. Our example for this book, the Online Transactional Processing (OLTP) database, powers this application, capturing billing and clinical information for home health and hospice patients. The database that we will use is called Pro_SSRS and is available for download in the Source Code/Download area of the Apress Web site (http://www.apress.com), together with instructions in the ReadMe.txt file on how to restore the database in preparation for use in this and subsequent chapters.
Introducing the Schema Design
Over the years, developers have added features to the application and altered the database schema many times to accommodate the new functionality and to capture required data. This data is needed not only to perform operational processes such as creating bills and posting payments to the patient’s account, but also to provide valuable reports that show how well the company is serving its patients. Because these types of healthcare facilities offer long-term care, our customers need to know if their patients’ conditions are improving over time and the overall cost of the care delivered to them.
The database designed for the application consists of more than 200 tables and has many stored procedures. In this book, you’ll use a subset of that database to learn how to develop reports that show the cost of care for patients. You’ll use eight main tables for the queries and stored procedures throughout the book, and you’ll begin using some of them to build reports as you work through the next three chapters. These tables are as follows:
Trx: The main transactional data table that stores detailed patient services information. We use the term services to refer to items with an associated cost that are provided for patient care.
Services: Stores the names and categories for the detailed line items found in theTrxtable. Services could be clinical visits such as a skilled nurse visit, but could also include billable supplies, such as a gauze bandage or syringes.
ServiceLogCtgry: The main grouping of services that are similar and provide a higher-level grouping. For example, all visits can be associated with a “Visits”ServiceLogCtgryfor reporting.
Employee: Stores records specific to the employee, in this case a clinician or other staff member such as a chaplain visiting a hospice patient. An employee is assigned to each visit stored in theTrxtable.
Patient: Includes demographic information about the patient receiving the care. This table, like theEmployeetable, links directly to theTrxtable for detailed transactional data.
Branch: Stores the branch name and location of the patient receiving the care. Branches, in the sample reports, are cost centers from which visits and services were delivered.
Chargelnfo: Contains additional information related to the individualTrxrecords that is specific to charges. Charges have an associated charge, unlike payments and adjustments, which are also stored in theTrxtable.
Diag: Stores the primary diagnoses of the patient being cared for and links to a record in theTrxtable.
Figure 2-1 shows a graphical layout of the eight tables and how they’re joined.

Figure 2-1. Viewing the sample application’s database tables
Knowing Your Data: A Quick Trick with a Small Procedure
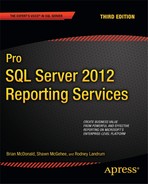
For every report writer, familiarity with the location of the data in a given database can come only with time. Of course, having a database diagram or schema provided by a vendor is a useful tool, and we have the luxury of that here, but this isn’t always available. One day, faced with the dilemma of trying to find the right table for a specific piece of missing data, we decided to put together a stored procedure, which we named sp_FieldInfo. It returns a list of all the tables in a specific database that share field names, typically the primary or foreign key fields. For example, in the healthcare database, if you want a list of tables that contain the PatID field (the patient’s ID number that’s used to join several tables), you would use the following command:
sp_FieldInfo PatID
The output would be similar to that shown in Table 2-1.
Armed with this information, you could at least deduce that, for example, the patient’s diagnosis information is stored in the PatDiag table. However, table and field names aren’t always intuitively named. When we encounter a database such as this from time to time, we can run a SQL Server Profiler trace and perform some routine tasks on the associated application, such as opening a form and searching for an identifiable record to get a starting point with the captured data. The Profiler returns the resulting query with table and field names that we can then use to discern the database structure.
![]() Tip SQL Server Profiler is an excellent tool for capturing not only the actual queries and stored procedures executing against the server, but also the performance data, such as the duration of the execution time, the central processing unit (CPU) cycles and input/output (I/O) measurements, and the application that initiated the query. Because you can save this data directly to an SQL table, you can analyze it readily, and it even makes a good source of data for a report in SSRS.
Tip SQL Server Profiler is an excellent tool for capturing not only the actual queries and stored procedures executing against the server, but also the performance data, such as the duration of the execution time, the central processing unit (CPU) cycles and input/output (I/O) measurements, and the application that initiated the query. Because you can save this data directly to an SQL table, you can analyze it readily, and it even makes a good source of data for a report in SSRS.
Listing 2-1 displays the code to create the sp_fieldinfo stored procedure. You can find the code for this query in the code download file CreateFieldInfo.sql in the SQL Queries folder.
Listing 2-1. Creating the sp_FielIinfo Stored Procedure
IF EXISTS (SELECT * FROM INFORMATION_SCHEMA.ROUTINES

               WHERE ROUTINE_NAME = 'sp_FieldInfo'

               AND SPECIFIC_SCHEMA = 'dbo')

       DROP PROCEDURE [dbo].[sp_FieldInfo]

GO

CREATE PROCEDURE [dbo].[sp_FieldInfo]

(

        @column_name VARCHAR(128) = NULL

)
AS

SELECT

        TABLE_NAME AS [Table Name]

        , RTRIM(COLUMN_NAME) AS [Field Name]

FROM

        INFORMATION_SCHEMA.COLUMNS

WHERE

        COLUMN_NAME LIKE '%' + @column_name + '%'
Introducing Query Design Basics
Whether you’re a seasoned pro at writing SQL queries manually through a text editor or someone who prefers to design queries graphically, the result is what matters. Accuracy, versatility, and efficiency of the underlying query are the three goals that designers strive to achieve. Accuracy is critical, but a query that performs well and is versatile enough to be used in more than one report makes the subsequent report design task much easier. For scalability and low response times, efficiency is paramount. A great report that takes 15 minutes to render will be a report your users rarely run. Keep the following goals in mind as you begin to develop your report queries:
The query must return accurate data: As the query logic becomes more complex, the chance of inaccuracy increases with extensive criteria and multiple joins.
The query must be scalable: As the query is developed and tested, be aware that its performance might change radically as the load increases with more users. We cover performance monitoring with simulated loads in Chapter 10. However, in this chapter we’ll show how to use tools to test query response times for a single execution in order to improve performance.
The query should be versatile: Often a single query or stored procedure can drive many reports at once, saving on the time it takes to maintain, administer, and develop reports. However, delivering too much data to a report at once, to support both details and a summary, can affect performance. It’s important to balance versatility with efficiency.
Creating a Simple Query Graphically
Query design typically begins with a request. As the report writer or database administrator (DBA), you’re probably often tasked with producing data that’s not available through the standard reports often delivered with third-party applications.
Let’s begin with a hypothetical scenario. Say you receive an e-mail that details a report to be created and deployed for an upcoming meeting. It has already been determined that the data is unavailable from any known reports, yet you can derive the data using a simple custom query.
In this first example, you’ll look at the following request for a healthcare organization:
Deliver a report that shows the ten most common diagnoses by service count.
Assuming you are familiar with the database, begin the query design process in SSMS, either graphically or by coding the query with the generic query designer. Both methods are available within SSMS.
![]() Note We’ll cover setting up the data source connection required for building an SSRS report in Chapter 3. For now, you’ll connect directly to the data with the available query design tools within SSMS. It is important to mention that though you are designing the query within SSMS, similar tools are available within the BIDS environment so that you can create your queries at the same time you create your report. We chose SSMS in this case because it contains lists of database objects that you may need to reference as you begin to develop the query.
Note We’ll cover setting up the data source connection required for building an SSRS report in Chapter 3. For now, you’ll connect directly to the data with the available query design tools within SSMS. It is important to mention that though you are designing the query within SSMS, similar tools are available within the BIDS environment so that you can create your queries at the same time you create your report. We chose SSMS in this case because it contains lists of database objects that you may need to reference as you begin to develop the query.
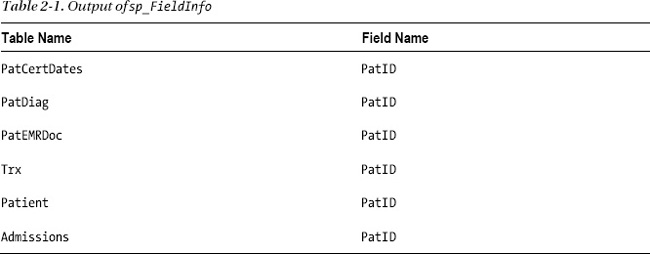
We’ll show you how to design the query with the graphical tool to demonstrate how the underlying SQL code is created. You can access the graphical query designer by right-clicking anywhere in the new query window within SSMS and selecting Design Query in Editor (see Figure 2-2).
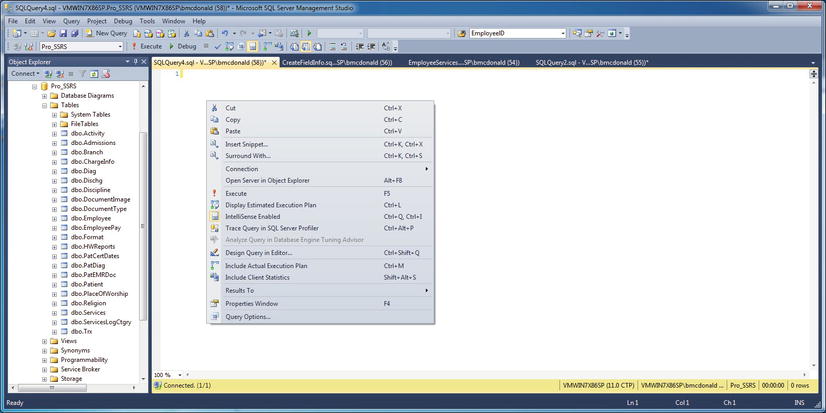
Figure 2-2. Accessing the query design tool in SSMS
After you open the query designer, you can perform tasks such as adding and joining additional tables and sorting, grouping, and selecting criteria using the task panes (see Figure 2-3).
Figure 2-3. Working with the graphical query designer in SSMS
This initial query is a relatively simple one; it uses four tables joined on relational columns. Through the graphical query designer, you can add basic criteria and sorting, and you can select only two fields for the report: a count of the patients and a specific medical diagnosis. You can make the Sort Type of the count Descending so that you can see the trend for the most common diagnoses. You can directly transport the SQL query to a report, and we’ll show you how to do that in Chapter 6. Listing 2-2 shows the query produced. You can find the code for this query in the code download file Top10Diagnosis.sql in the Source Code/Download area of the Apress Web site (http://www.apress.com) in the SQL Queries folder.
Listing 2-2. The SQL Query Produced Using the Graphical Query Designer to Return the Top Ten Patient Diagnoses
SELECT TOP 10

       COUNT(DISTINCT Patient.PatID) AS [Patient Count]

       , Diag.Dscr AS Diagnosis

FROM

       Admissions

       INNER JOIN Patient ON Admissions.PatID = Patient.PatID

       INNER JOIN PatDiag ON Admissions.PatProgramID = PatDiag.PatProgramID

       INNER JOIN Diag ON PatDiag.DiagTblID = Diag.DiagTblID

GROUP BY

       Diag.Dscr

ORDER BY

       COUNT(DISTINCT Patient.PatID) DESC
Table 2-2 shows the output of this query.

This particular aggregated query has a small result set. Even though it’s potentially working with tens of thousands of records to produce the resulting ten records, it runs in less than a second. This tells you that the query is efficient, at least in a single-user execution scenario.
This type of query is designed to deliver data for quick review by professionals who will make business decisions from the results of the summarized data. In this example, a healthcare administrator will notice a demand for physical therapy and might review the staffing level for physical therapists in the company. Because physical therapists are in high demand, the administrator might need to investigate the cost of caring for physical therapy patients.
Creating an Advanced Query
Next, we’ll show how to design a query that reports the cost of care for the physical therapy patients. The goal is to make the query and subsequent report flexible enough to include other types of medical services that can be analyzed as well, not only physical therapy. This query requires more data for analysis than the previous one did. Because you’ll process thousands of records, you need to assess the performance impact.
The design process is the same. Begin by adding the necessary tables to the graphical query designer and selecting the fields you want to include in the report. The required data output for the report needs to include the following information:
Listing 2-3 shows the query to produce this desired output from the healthcare application. You can find the code for this query in the code download file EmployeeServices.sql in the SQL Queries folder.
Listing 2-3. Employee Cost Query for Healthcare Database
SELECT

       Trx.PatID

       , RTRIM(RTRIM(Patient.LastName) +  ', '  + RTRIM(Patient.FirstName)) AS [Patient Name]

       , Employee.EmployeelD

       , RTRIM(RTRIM(Employee.LastName) +  ', '  + RTRIM(Employee.FirstName)) AS [Employee Name]

       , ServicesLogCtgry.Service AS  [Service Type]

       , SUM(Chargelnfo.Cost) AS  [Estimated Cost]

       , COUNT(Trx.ServicesTbllD) AS Visit_Count

       , Diag.Dscr AS Diagnosis

       , DATENAME(mm, Trx.ChargeServiceStartDate) AS [Month]

       , DATEPART(yy,  Trx.ChargeServiceStartDate) AS  [Year]

       , Branch.BranchName AS Branch

FROM

       Trx

       JOIN Chargelnfo ON Trx.ChargelnfoID = Chargelnfo.ChargelnfoID

       JOIN Patient ON Trx.PatID = Patient.PatID

       JOIN Services ON Trx.ServicesTbllD = Services.ServicesTbllD

       JOIN ServicesLogCtgry ON Services.ServicesLogCtgrylD = ServicesLogCtgry.ServicesLogCtgryID

       JOIN Employee ON Chargelnfo.EmployeeTbllD = Employee.EmployeeTbllD

       JOIN Diag ON Chargelnfo.DiagTbllD = Diag.DiagTbllD

       JOIN Branch ON TRX.BranchID = Branch.BranchID

WHERE

        (Trx.TrxTypelD = 1) AND (Services.ServiceTypelD =   'v')

GROUP BY

       ServicesLogCtgry.Service

       , Diag.Dscr

       , Trx.PatID

       , RTRIM(RTRIM(Patient.LastName) +  ', '  + RTRIM(Patient.FirstName))

       , RTRIM(RTRIM(Employee.LastName)    +  ', '  + RTRIM(Employee.FirstName))

       , Employee.EmployeelD

       , DATENAME(mm,  Trx.ChargeServiceStartDate)

       , DATEPART(yy,  Trx.ChargeServiceStartDate)

       , Branch.BranchName

ORDER BY

       Trx.PatID
The alias names identified with AS in the SELECT clause of the query should serve as pointers to the data that answers the requirements of the report request. Again, knowing the schema of the database that you’ll be working with to produce queries is important, but for the sake of the example, the joined tables are typical of a normalized database where detailed transactional data is stored in a separate table from the descriptive information and therefore must be joined. The Trx table in Listing 2-3 is where the transactional patient service information is stored, while the descriptive information of the specialty services such as “Physical Therapy” is stored in the Services table.
Other tables, such as the Patient and Employee tables, are also joined to retrieve their respective data elements. You use the SQL functions COUNT and SUM to provide aggregated calculations on cost and service information, and RTRIM to remove any trailing spaces in the concatenated patient and employee names. You can use the ORDER BY PATID clause for testing the query to ensure that it’s returning multiple rows per patient as expected. It isn’t necessary to add the burden of sorting to the query. As you’ll see in the next chapters, sorting is handled within the report. Dividing the load between the SQL Server machine that houses the report data and the report server itself is important and often requires performance monitoring to assess where such tasks as sorting, grouping, and calculating sums or averages for aggregated data will be performed. If the report server is substantial enough to shoulder the burden and is less taxed by user access than the actual data server is, it might be more efficient to allow it to handle more of the grouping and sorting loads. More often than not though, it is considered best practice to have the relational database engine perform as much of the work as possible to alleviate some of the load on the report server.
Testing Performance with SQL Server Management Studio (SSMS)
Now that you have developed the query, you’ll look at the output to make sure it’s returning accurate data within acceptable time frames before moving on to the next phase of development. Figure 2-4 shows the results of the output from SSMS and the time it took to execute the query. You can directly modify the query further in SSMS if you want to. However, one of the best features of SSMS you’ll notice is the ability to view quickly both the number of records returned and the execution time. Once you’ve done that, the next step is to create the stored procedure.
You now have the data the way you want, and the query is executing in an average of one second. To verify the execution times, run the query 15 times in sequence from two different sessions of SSMS. Execution times will vary from zero to two seconds for each execution. For 3,924 records, which is the number of records the query returns, the execution time is acceptable for a single-user execution. However, you need to improve it before you create the stored procedure, which you will want to scale out to accommodate hundreds of users, and begin building reports.
Looking at the Execution Plan tab in SSMS will give you a better understanding of what’s happening when you execute the query. In SSMS, click the Display Estimated Execution Plan button on the toolbar. When the query is executed, the Execution Plan tab appears in the Results pane. Alternatively, if you just want to see the execution plan without returning results, just press CTRL+L.

Figure 2-4. Viewing the query execution output in SSMS
The Execution Plan tab in SSMS shows graphically how the SQL query optimizer chose the most efficient method for executing the report, based on the different elements of the query. For example, the query optimizer may have chosen a clustered index instead of a table scan. Each execution step has an associated cost. Figure 2-5 shows the Execution Plan tab for this query.
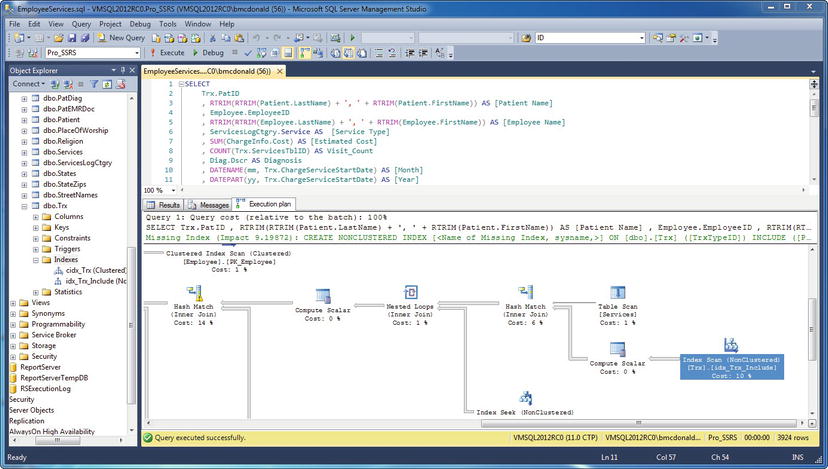
Figure 2-5. Viewing the Execution Plan tab displayed in SSMS
The query took one second to execute, and from this execution plan it’s easy to see which section of the query had the highest cost percentage. There was a total cost of 11 percent when determining the TrxTypeID and the ServiceTypeID values used as a filter in the WHERE clause. For reference, the TrxTypeID integer field specifies the type of financial transactions as charges, payments, or adjustments. You’re concerned only with the TrxTypeID value of 1, representing charges. For the service type, you’re interested only in “V,” representing visits, and not in other types of billable services, such as medical supplies. If you could get the cost of the WHERE clause down to a lower number, the query might improve the overall performance.
Optimizing Performance: Dividing the Load
Because SSRS and T-SQL share many data formatting and manipulation functions, you can choose in which process—query or report—these functions should be used. You can choose to have the query handle the bulk of the processing. This limits the number of rows that the report has to work with, making report rendering much faster. Alternatively, you can limit the selectivity of the query, allowing it to return more rows than are possibly required. You can then have the report perform additional filtering, grouping, and calculations, which allows the query or stored procedure to execute faster. With many users accessing the report simultaneously, having the report share the processing load also limits the impact on the data source server (in this case, SQL Server).
In this query, based on initial benchmarking, we’ve determined we’ll remove the portion of the WHERE clause that specifies that the query should return only service types with a value of “V” for visits. Instead, we’ll let the report filter out any service types that aren’t visits. When you remove the service type criteria from the query and re-execute it, you can see that the overall execution time remains constant at or is less than one second, and the cost of the WHERE clause goes from 11 percent to only 4 percent. Also, it’s important to note in the performance analysis that the record count went up by only 35 records, from 3,924 to 3,959, by removing the “V” from the WHERE clause. You can see this in the lower-right corner of Figure 2-6.
To take advantage of a report filter, you need to add a field—Services.ServiceTypeID—to the SELECT and GROUP BY portions of the query, like so:
Select

...

Branch.BranchName AS Branch,

Services.ServiceTypeID

…

GROUP BY

…

Branch.BranchName,

Services.ServiceTypeID
You will use the additional field Services.ServiceTypeID as the filter value in the report that you will be designing. By proceeding in this fashion, even though you’re returning more rows than you might need for a particular report, you also gain the benefit of using this same base query for other reports when you eventually make it a stored procedure, which you will do in the following sections. Other reports might need to show service types other than visits, and this query will serve this purpose with only slight modifications to the report. For example, you might need to investigate the cost or quantity of supplies (a service type of “S”) used by employees. You can use this same query and stored procedure for that report. We could make use of a parameterized stored procedure that would allow various reports to pass in a value to be used to filter the results, but we’ll progress to that in a moment.
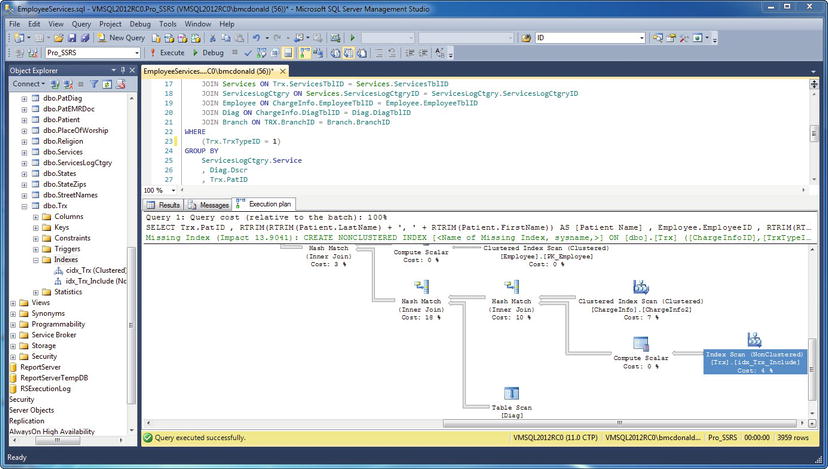
Figure 2-6. Viewing the execution plan with the modified query
The query as it stands, now including ServiceTypeID as a value in the SELECT clause and not as criteria, is ready to begin its life as a stored procedure. Queries serve many purposes, one of which is the development of reports, as you’ll do in Chapter 6. However, encapsulating queries in stored procedures is typically the preferred method of deployment for several reasons. Stored procedures, like ad hoc queries, execute according to the execution plan generated by the query optimizer. Having the ability to reuse the execution plan saves time and resources. Stored procedures, which are also beneficial because they’re precompiled, can reuse an execution plan even though the parameters passed to it at execution time might have changed values. You can hold stored procedures centrally on the SQL Server machine, unlike ad hoc queries that might be embedded in an application (or in the RDL file in this case). When the underlying schema of a database changes, you can update the stored procedure in one location, whereas embedded queries all need to be modified separately for each report in which they reside. In the next section, we’ll show you how to create a stored procedure based on the employee cost query.
Using a Parameterized Stored Procedure
You can use SSMS to produce the code to create a stored procedure based on the employee cost query, and to drop it if the stored procedure already exists in the database. To create a stored procedure, expand the database where you want to create the stored procedure, navigate to the Programmability folder and expand it to see a folder named Stored Procedures. Right-click on that folder and choose, New Stored Procedure. This opens a window containing a sample CREATE PROCEDURE command for the new stored procedure.
CREATE PROCEDURE <Procedure_Name, sysname, ProcedureName>
To complete the new stored procedure, which you should name Emp_Svc_Cost, you simply need to paste in your SELECT statement. However, you can add optional parameters to limit the result set based on the following criteria:
- Service time (year and month)
- The branch where the employee works
- The individual employee
- The type of service
To create parameters for a stored procedure, you add the variable names, each prefixed by an @ character and provide the appropriate data types along with their default values if desired. The default values for all the parameters are set to NULL, as Listing 2-4 shows. You can find the code for this query in the code download file CreateEmpSvcCost.sql in the SQL Queries folder.
Listing 2-4. Creating the Emp_Svc_Cost Stored Procedure
IF EXISTS (SELECT * FROM INFORMATION_SCHEMA.ROUTINES

               WHERE ROUTINE_NAME = 'Emp_Svc_Cost'

               AND ROUTINE_SCHEMA = 'dbo')

        DROP PROCEDURE dbo.Emp_Svc_Cost

GO

CREATE PROCEDURE [dbo].[Emp_Svc_Cost]

(

        @ServiceMonth INT = NULL

        , @ServiceYear INT = NULL
        , @BranchID INT = NULL

        , @EmployeeTblID INT = NULL

        , @ServicesLogCtgryID CHAR(5) = NULL

)

AS

SELECT

        T.PatID

        , RTRIM(RTRIM(P.LastName) + ', ' + RTRIM(P.FirstName)) AS [Patient Name]

        , B.BranchName

        , E.EmployeeID

        , RTRIM(RTRIM(E.LastName) + ', ' + RTRIM(E.FirstName)) AS [Employee Name]

        , E.EmployeeClassID

        , SLC.Service AS [Service Type]

        , SUM(CI.Cost) AS [Estimated Cost]

        , COUNT(T.ServicesTblID) AS Visit_Count

        , D.Dscr AS Diagnosis

        , DATENAME(mm, T.ChargeServiceStartDate) AS [Month]

        , DATEPART(yy, T.ChargeServiceStartDate) AS [Year]

        , S.ServiceTypeID

        , T.ChargeServiceStartDate

FROM

        Trx AS T

        INNER JOIN Branch AS B ON T.Branchid = B.BranchID

        INNER JOIN ChargeInfo AS CI ON T.ChargeInfoID = CI.ChargeInfoID

        INNER JOIN Patient AS P ON T.PatID = P.PatID

        INNER JOIN Services AS S ON T.ServicesTblID = S.ServicesTblID

        INNER JOIN ServicesLogCtgry AS SLC ON S.ServicesLogCtgryID = SLC.ServicesLogCtgryID

        INNER JOIN Employee AS E ON CI.EmployeeTblID = E.EmployeeTblID

        INNER JOIN Diag AS D ON CI.DiagTblID = D.DiagTblID

WHERE

        (T.TrxTypeID = 1)

        AND (ISNULL(B.BranchID,0) = ISNULL(@BranchID,ISNULL(B.BranchID,0)))

        AND (ISNULL(S.ServicesLogCtgryID,0) = ISNULL(@ServicesLogCtgryID,

                ISNULL(S.ServicesLogCtgryID,0)))

        AND (ISNULL(E.EmployeeTblID,0) = ISNULL(@EmployeeTblID,

        ISNULL(E.EmployeeTblID,0)))

        AND

       --Determine if Year and Month was passed in

        ((CAST(DATEPART(yy, T.ChargeServiceStartDate) AS INT) = @ServiceYear

                AND @ServiceYear IS NOT NULL)

                OR @ServiceYear IS NULL)

        AND

        ((CAST(DATEPART(mm, T.ChargeServiceStartDate) AS INT) = @ServiceMonth

                AND @ServiceMonth IS NOT NULL)

                OR @ServiceMonth IS NULL)

GROUP BY

        SLC.Service

        , D.Dscr

        , T.PatID

        , B.BranchName

        , RTRIM(RTRIM(P.LastName) + ', ' + RTRIM(P.FirstName))

        , RTRIM(RTRIM(E.LastName)  + ', ' + RTRIM(E.FirstName))
        , E.EmployeeClassid

        , E.EmployeeID

        , DATENAME(mm, T.ChargeServiceStartDate)

        , DATEPART(yy, T.ChargeServiceStartDate)

        , S.ServiceTypeID

        , T.ChargeServiceStartDate

ORDER BY

        T.PatID

GO
Using ISNULL to Evaluate the Parameters
In the previous query, you added several new criteria to the WHERE clause for evaluating the parameters. One of those criteria was the ISNULL function, used to evaluate the values of the database fields and parameters.
(ISNULL(B.BranchID,0) = ISNULL(@BranchID,ISNULL(B.BranchID,0)))

AND

((CAST(DATEPART(yy, T.ChargeServiceStartDate) AS INT) = @ServiceYear

                AND @ServiceYear IS NOT NULL)

                OR @ServiceYear IS NULL)

        AND

        ((CAST(DATEPART(mm, T.ChargeServiceStartDate) AS INT) = @ServiceMonth

                AND @ServiceMonth IS NOT NULL)

                OR @ServiceMonth IS NULL)
At first, the logic for these evaluations might seem a bit confusing, but remember that as long as the criteria are equal, results are returned. This is true through the entire WHERE clause because it’s evaluated with AND. This is easier to understand with the following sample statement:
SELECT * from Table1 WHERE 1 = 1
In this statement, all rows are returned, because 1 always equals 1. It doesn’t matter that you aren’t comparing values from the table itself.
For the ISNULL function, you look to see whether the value of a database field—BranchID, for example—contains a NULL value, and if so, ISNULL replaces NULL with zero. The right side of that equation looks to see whether the @BranchID parameter was passed in as NULL; if so, then the value for @BranchID is set to the value of BranchID in the database table and equals every row. If the @BranchID parameter is passed to the stored procedure as a value—say, 2 for the branch Grid Iron—then only BranchID 2 is returned because BranchID = @BranchID = 2. This evaluation is performed when there might be NULL values in the field because NULL values can’t be compared with standard operators such as =.
For the two time values, Service Year and Month, you use similar logic. If the parameters @ServiceMonth and @ServiceYear are passed in as NULL to the stored procedure, then the stored procedure returns every record. If the parameters contain legitimate values, such as 2009 for the year, the WHERE clause applies a filter when the parameter value equals the database value.
Query Performance and Indexes
While we’re talking about designing efficient queries, there are many things that DBAs can do for a table to increase query performance. To list a few problems, statistics can get out of date, and indexes (where there are any on a table) can become fragmented or insufficient. Each of these will affect query performance in different ways, but always in the wrong way—a query from a poorly designed or badly designed table will always take longer to execute than on from a table that is well designed and maintained.
You may not have appropriate permissions to manage indexes, but one thing you can do is to design a query to use the indexes that do exist. Here are a few tips to help you increase performance and decrease the time it takes to return results to your reports.
- SELECT: Only return the columns that are absolutely needed in your reports.
- JOIN: Only join tables that you need and use existing indexed columns in join conditions.
- WHERE: Use indexed columns in the order in which they are defined and eliminate the use of the
LIKEoperator using the wildcard (%) in front of the filtered value.
If your query is not performing as well as you would like, you may be able to ask your DBAs to run some performance checks on the table(s) that you are using in your query. They may just need to modify existing indexes to include the columns used in your queries. The cure could even be as simple as creating a maintenance plan on the database to update the statistics. Either way, try to use these tips when writing your queries. Performance-tuning queries is a large subject and many books are available to help you write optimized queries, such as SQL Server 2012 Query Performance Tuning by Grant Fritchey (Apress 2012).
Column and Table Aliasing
Column and table aliasing does not actually make your queries run more efficiently. However, it does make them easier to read and quicker to write. Aliasing lets you use an abbreviated (or more descriptive) label for columns and tables. This way, you don’t have to type out the entire name of a table every time you use a column from it, or you can assign a more appropriate name for a column. Using the AS keyword, we tell SQL Server to alias the field or table as some other label.
SELECT

…

, DATENAME(mm, T.ChargeServiceStartDate) AS [Month]

…

INNER JOIN ServicesLogCtgry AS SLC ON S.ServicesLogCtgryID = SLC.ServicesLogCtgryID
This statement uses the DATENAME function to alias the Trx table’s ChargeServicesStartDate as the Month. The next line shows how you can alias a table named ServicesLogCtgry so you can refer to it as SLC. This way, whenever you need a column from the ServicesLogCtgry table, you can reference the alias followed by a period, then the column name.
Testing the Procedure
The next step is to grant execute privileges for the stored procedure in SSMS by navigating to the database Pro_SSRS and then expanding the Programmability folder. From here, select Stored Procedures, right-click Emp_Svc_Cost, and finally select Properties. A Permissions property page will allow you to add the public role and grant execute permission to any group or user you desire. In this case, click Add on the Permissions page, find Public in the list of available users, and grant the Execute permission. (We’re sure the humor of this wasn’t lost on the developer, who knew someone would grant a public execution.)
![]() Note The test server on which we’re developing the reports is an isolated and secure system. Typically, granting execution privileges to the public role isn’t recommended. We’ll lock down both the stored procedure and the report in Chapter 11.
Note The test server on which we’re developing the reports is an isolated and secure system. Typically, granting execution privileges to the public role isn’t recommended. We’ll lock down both the stored procedure and the report in Chapter 11.
You can now test the procedure directly in SSMS with the following command:
EXEC Emp_Svc_Cost
Because you have allowed NULL values for the parameters, you don’t explicitly have to pass them in on the command line. However, to test the functionality of the stored procedure, you can pass in the full command line with the appropriate parameters; for example, you can pass all services rendered in September 2009, like so:
EXEC Emp_Svc_Cost 09, 2009, NULL, NULL, NULL
Executing the procedure in this way returns 893 records in a fraction of a second, and the results verify that, indeed, only services in September 2009 were returned (see Figure 2-7).
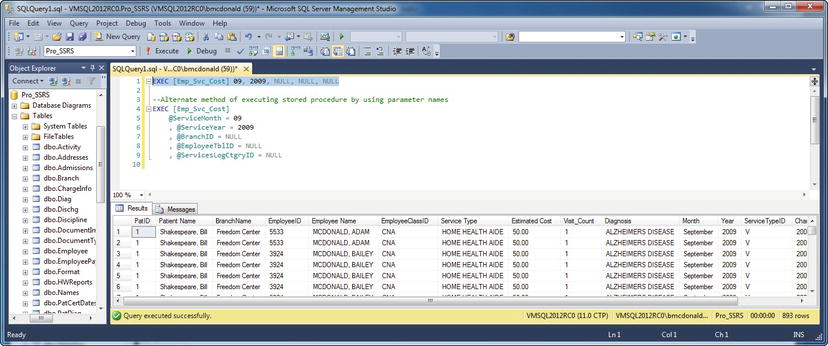
Figure 2-7. Viewing the results of Emp_Svc_Cost with year and date parameters
Summary
In this chapter, you began to design the essential part of a report: the query and stored procedure. By using stored procedures, you gain the benefits of central administration and security while also gaining the ability to execute compiled code to return the dataset instead of a stand-alone query. You can develop queries in conjunction with the report, using the built-in query tools within SSRS. However, it is considered best practice to deploy the report with a stored procedure whenever possible.
A report request and the target audience are the deciding factors when determining the layout and default rendering of the report. However, even though reports are often designed to answer a specific need, if they’re based on the same tried-and-true stored procedures, with similar parameters and groupings, the data will be accurate across all reports. You can then focus the design time on the report itself and not on rewriting queries.