C H A P T E R 6
Building Reports
In the previous chapter, you laid the foundation for your first report by creating a query and subsequent stored procedure. You also learned about the fundamental elements used to build reports and are now familiar with the design environment. Now, it is time to put all the pieces together and begin building reports. You can easily apply the concepts introduced in this chapter to any company that uses SQL Server and relational database systems. This chapter will focus primarily on creating a reporting solution based on data from a SQL Server health care database; it will use many of the report elements that have been available since SSRS’s inception in SQL Server 2000 through 2012. SSRS 2008 and 2008 R2 introduced many new features such as report variables, enhanced charting, and data visualizations. The most significant additions were the Tablix data regions and dashboard style elements like Sparklines, Data Bars, and the Indicator. We are excited to incorporate these significant and long-awaited enhancements into the reports featured in this book.
The report you will be creating in this chapter is called the Employee Service Cost report. This report will utilize the same query and stored procedure, Emp_Svc_Cost, which you have been working with since Chapter 2 to provide the report data. As a reminder, the query returns detail records that represent services performed for patients, such as visits by skilled nurses or home health aides. Each type of service has an associated cost for the health care company. This report, when complete, will show important cost points based on associated data provided by the query, such as the patient’s diagnosis, the employees who performed the services, the date of each service, and the branch location of the patient. By grouping and sorting the report at these cost points, you will be able to see the cost of services from the individual patient all the way up to the branch location, which might serve hundreds of patients. You will group and calculate the cost amount at each level.
Specifically, in the following sections, you will create the Employee Service Cost report initially with the Report Wizard, which produces a report based on predefined selections, and then from scratch. We will show the process of using the wizard for demonstration purposes only and therefore will not continue with the report that it produces. For the report that you build from scratch, you will add all the features that the Report Wizard can add, plus much more. The following list highlights the design goals for the Employee Service Cost report:
- Step through adding a base report that uses the Table data region based on the dataset you defined for the Emp_Svc_Cost query.
- Add several basic formatting elements to the report.
- Add interactivity to the report, with document mapping, visibility, hyperlink actions, and interactive sorting (introduced in SSRS 2005). Both document mapping and hyperlink actions allow the user to navigate to defined locations either within the report or outside the report, such as a Website. In this chapter, you will use visibility properties within your report to expand and collapse report items from summary to detail. Interactive sorting gives an SSRS report versatility by allowing it to be sorted in much the same way that Microsoft Outlook allows sorting by clicking column headers.
- Add parameters to the report automatically by changing the dataset from a query to a parameterized stored procedure. You will also add other datasets to populate the parameters defined by the stored procedure.
- Learn how to use multivalued parameters using a modified stored procedure and UDF.
- Add a filter to the Table data region to show only service types that are visits.
- Add a Chart data region for the top ten diagnoses to the report.
- Add a report variable (introduced in 2008) to use as a constant threshold value.
- Add a gauge control to the report to show threshold information.
- Add a column grouping to the report Table region. Column groupings within the Table region are part of the new Tablix functionality for the Table, Matrix, and List data regions. The Tablix functionality was covered in detail in Chapter 4.
- Add the final touches to the report, such as a page header and footer, title, and page numbers.
In addition, as you begin to work more closely with report and query parameters, you will learn how to use multivalued parameters. As mentioned in previous chapters, multivalued parameters require special consideration when designing the underlying query. Therefore, in this chapter, you will use a modified version of your stored procedure that takes advantage of a UDF; this will teach you how to best utilize this feature.
In the preceding chapters, we covered the steps for creating the solution, project, and data source that your report will use, so we will not cover these steps again here. We will, however, show how to use the same data source properties to connect to the health care database where the data for your report reside. The same database also contains the stored procedure you created in Chapter 2, Emp_Svc_Cost, which you will use later in this chapter.
Creating a Report with the Report Wizard
In many scenarios, the Report Wizard is a fast method for creating a basic report that can be further enhanced before deployment. The Report Wizard is suitable for reports that are primarily data listings that do not require much special formatting. In this section, you will step through the Report Wizard to create the Employee Service Cost report before designing the same report manually.
To open the Report Wizard in your report project, right-click the Reports folder in the Solution Explorer and select Add New Report. The first wizard screen defines the data source. For this example, check New Data Source; however, you also have the choice to use a shared data source that has already been defined as part of the project. Supply the same data source information as you did in the previous chapter to connect to the Pro_SSRS database. The connection string should look similar to the following:
Data Source=localhost;Initial Catalog=Pro_SSRS
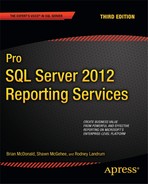
The next screen in the wizard defines the query. Paste the query you created in Chapter 2 into the Query String area (see Figure 6-1). You can open this query from the Query folder in the code download for the book. The file is called Report_Wizard_Query.sql. Clicking the Query Builder button launches the graphical query designer.
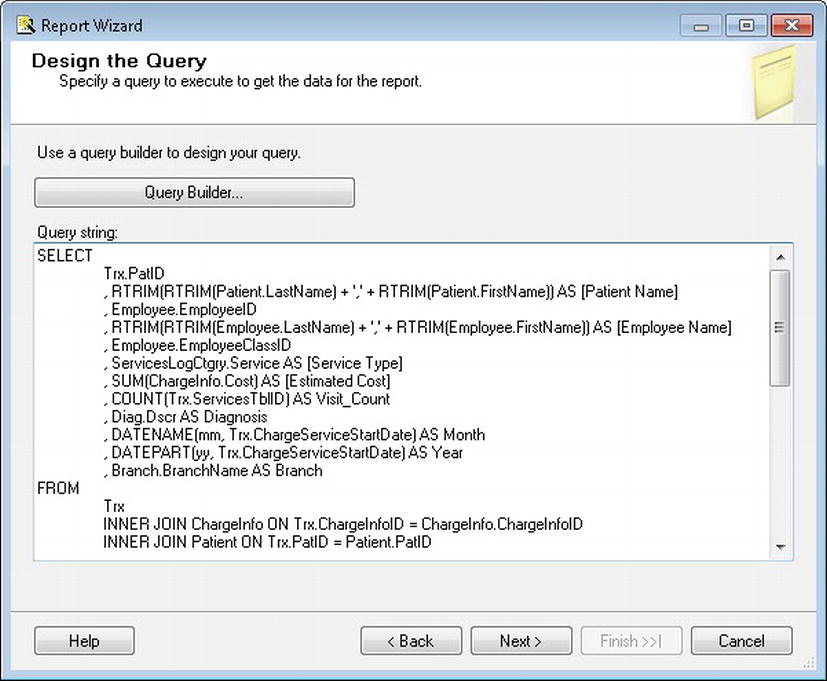
Figure 6-1. Pasting the query in the Query String area
The next screen of the Report Wizard asks whether the report should be in tabular or matrix form. Selecting Tabular will trigger the wizard to provide grouping information on the next screen; selecting Matrix will provide a similar screen for rows and columns instead of groups. For this example, select Tabular, click Next, and choose the grouping and detail layout to show Year as the primary group, with Month, EmployeeClassID, and Employee_Name next. For details, you want to see the patient-specific information—Diagnosis, Visit_Count, Estimated_Cost, and Service_Type—as shown in Figure 6-2.
Once you have grouped the data that will be in the report, the next two screens are primarily for formatting. Here, you can specify whether you want the report to have a stepped or block layout, as well as whether the report will include subtotals and provide drill-down functionality. You can also choose a custom style for the report.

Figure 6-2. Report Wizard group and details selections
For now, choose Stepped with No Drill-Down functionality and click Next. On the Table Style screen, apply the Corporate style to the report, click Next in the wizard, and change the name from the default, ReportX, where X is the next number in sequence of created reports, to Employee Cost Report Wizard. Next, check the Preview Report box to have the report executed upon creation, and then click Finish to generate the report. After a few moments, the resultant report appears. Although at first glance it appears to need many cosmetic changes, such as extending the size of the several columns (e.g., Employee Name and Diagnosis), resetting the background color of the groups to White, the font color of [Year] to Black, and formatting the Estimated Cost column for currency, the report is at least functional. Depending on the desired layout, it could need a good deal of work to get it the way you want it. Assuming you accepted one of the default styles, this would be a good starting point for modification, as shown in Figure 6-3.
To take full advantage of the flexibility of SSRS and the report design environment of BIDS, let’s create the same report from scratch.
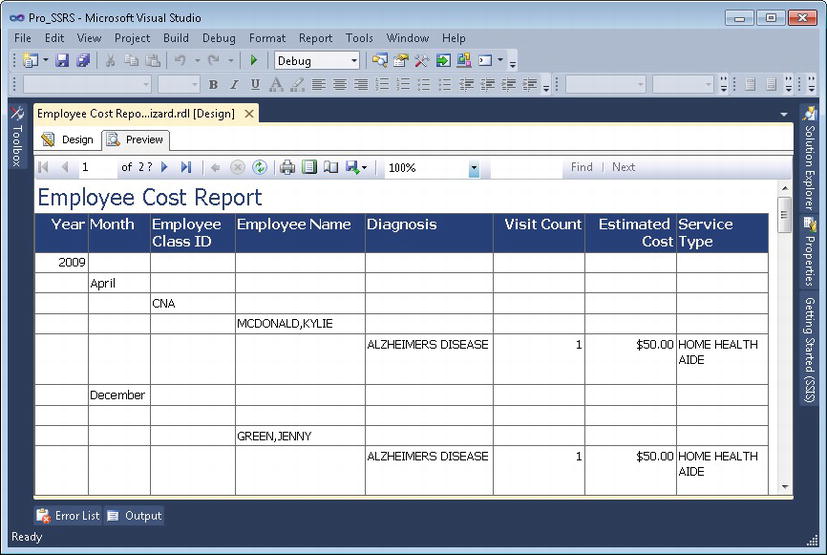
Figure 6-3. Report generated from the Report Wizard
Building Reports from Scratch
When working with a blank report, the first decision will be to choose which data regions to use in the body of the report. This decision is driven mostly by the type of data you are working with and by the report audience. For example, a chief executive officer (CEO) might not be concerned with details, preferring to see summary information about the status of the business products and services, and therefore would be more inclined to view a matrix report with column and row totals. However, in the initial report, you will be working with the Table data region because you want to show the interrelationships between patients and employees with multiple groupings in tabular rows, not columns. The final modification to the report that you will build in this chapter will include column and row groupings to show you how to incorporate elements of the Tablix data region.
In this section, you will follow specific steps to get your report to a basic starting point by adding a Table data region, and then you will continue to add formatting and functionality. When you are finished, the report will contain many SSRS features, including interactive drill-down and navigation links, custom formatting, interactive sorting, populated drop-down parameters, and a chart that displays the top ten diagnoses by cost. You will finish the report by adding several design touches, such as page numbers and execution times. You will examine how to modify the report to work with multi-value parameters. You will also explore another feature added in SSRS 2008: report variables. For this project, you will add a new report from the Solution Explorer and create a dataset that uses the same query from the previous section of this chapter for the Report Wizard. For simplicity, we have included the starting-point report in the Pro_SSRS project. The EmployeeServiceCost_Start report already has the datasets and initial query defined for the localhost SQL Server, which should match your environment. You will begin by using just the basic query, not the stored procedure. The dataset you will use to begin within the EmployeeServiceCost_Start report is called Emp_Svc_Cost. Later, in the “Setting Report Parameters with Stored Procedures” section, you will modify the dataset to use the stored procedure and see how the parameters defined in the stored procedure will automatically create the report parameters.
In the following sections, you will go through several steps to add functionality to a single report. The steps are provided so that you can walk through the process of building the report, starting with the EmployeeServiceCost_Start report; however, at several intervals, you may choose to open one of the several sample reports that reflect the completed steps. If a report is available, we will point it out in the text.
With the EmployeeServiceCost_Start report open in BIDS, move to the Design tab. The following steps get you to your starting point in the report, where you will begin to apply more advanced formatting and logic:
- Drag the Table report element to a blank section of the design grid.
- On the Report Data pane, drag the fields—Estimated_Cost and Visit_Count from the Emp_Svc_Cost dataset—to the detail row in the order listed. Delete the extra column by right clicking on the column and selecting Delete Columns. Notice that the column headings—Estimated Cost and Visit Count—were automatically created for you for each field dragged to the detail row. If you do not see the Report Data Pane, you can pull it up by using CTRL + ALT + D or by selecting it under the View menu.
- Edit the Visit_Count and Estimated_Cost field expressions to be sums, as in =Sum(Fields!Estimated_Cost.Value) by right clicking on each detail field and choosing Expression in the submenu. You will notice that when you develop your report in BIDS, each value that you enter into the report regions will be enclosed with brackets or be represented as “<<expr>>”. For example, the expression =Sum(Fields!Estimated_Cost.Value) will be visually represented as [Sum(Estimated_Cost)] in the table cell because the expression is a known value, even though it is an expression itself. You can also highlight the field, right click, and then select Sum under the Summarize By… submenu.
- Drag the Employee_Name field down to the Row Groups pane and release it above the (Details) group. This will create a grouping on Fields!Employee_Name.Value and add a new column to the Table. By default, the group is named the same as the field being grouped on. You will also notice that a vertical dashed line is placed between the details section and the new Employee_Name column of our Tablix: this gives you a visual indicator of where the group section ends and the details section begins.
- Next, drag the Patient_Name field and release it above the Employee_Name group to create a row group on Patient_Name. Do this step for Service_Type and Diagnosis with each one being above the former. This will create a hierarchy of Diagnosis, Service_Type, Patient_Name, and Employee_Name, respectively.
- Right click on the (Details) group in the Row Group pane and select Group Properties. Click Add under Group Expressions and select [Employee_Name] in the Group On drop-down list.
- To give our report a clean stepped look, right click on the Employee_Name field in the table, select Insert Row and then Outside Group –as shown in Figure 6-4. Next, drag the Patient_Name field that was added in step 5 into the new empty cell above Employee_Name. Right click on Patient_Name and then do the same thing by selecting Insert Row and then Outside Group – Above. This time, drag the Service_Type that was added in step 5 into the new empty space. With two of our groupings down, let’s do the same thing for the next level up in our hierarchy. Right click on Service_Type and Outside Group – Above. This time, drag our Diagnosis field above the Service_Type. Figure 6-5 shows what our report should look like in the designer.
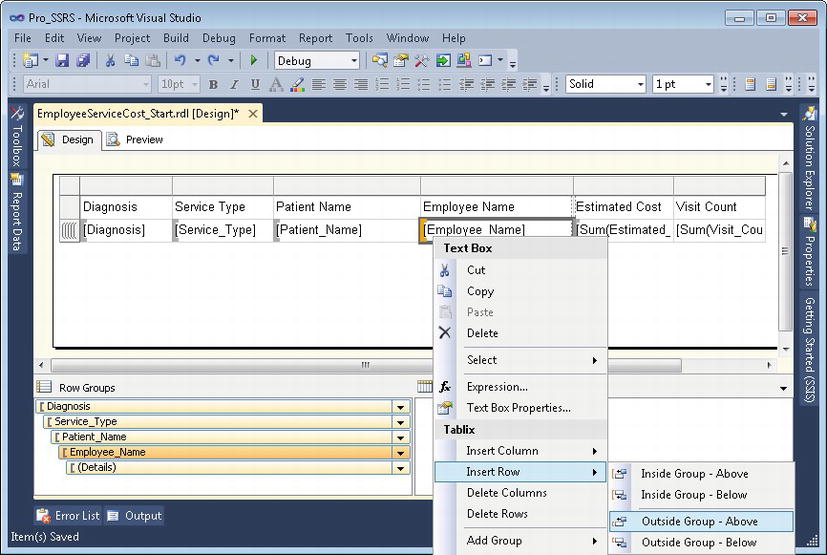
Figure 6-4. Employee Service Cost report Add Outside Group – Above for stepped look
- Now, remove the three columns with headers that read Diagnosis, Service Type, and Patient Name by right clicking each of them and choosing Delete Columns. After you remove the three columns, drag your Tablix closer to the left side of the Design pane. Then make the column labeled Employee Name about three inches wide so that the values don’t end up wrapping to the next line.
- Select the textbox containing the [Service_Type] in our table and hit F4 to show our Properties Window. Scroll until you see Padding and expand the properties by clicking the arrow. Modify the Left padding to be 10pt. Do the same thing for [Patient_Name] and [Employee_Name] but set them to 20pt and 30pt, respectively.

Figure 6-5. Employee Service Cost report Outside Groups- Above
After these nine steps, the report is starting to take form, as you can see in the preview. Although not yet aesthetically appealing, it displays the data in the appropriate, hard-fixed groupings and is tabulated so that it is easy to discern the detailed service information, such as the cost and counts of services for each patient (see Figure 6-6).

Figure 6-6. Employee Service Cost report details and groups
Formatting the Output
You can modify several quick and easy report properties to add a more professional look and feel to the report:
- Border Style
- Format
By using the Shift or Control key, or by clicking and dragging the mouse, it is easy to apply report properties to many cells simultaneously. For the Estimated Cost and Service Count header cells, you will add a border to the bottom, separating the record header from the actual data. First, highlight the two header column cells by holding down the Control key and clicking each cell. Next, open or expand the Properties window. The Properties window contains a Border Style property for each area of the selected cells—top, bottom, left, and right. For this example, select Solid for the bottom border.
With the Properties window still open, click the Estimated Cost detail row cell. Format the cell in the Properties window to make it currency by adding the formatting command C0 for the Format property.
Next, rename the header cell labeled Employee Name to Diagnosis > Service > Patient > Employee and extend the column to accommodate the width of the new label.
After you apply the formatting, you can immediately see how these changes affect the output by clicking the Preview tab (see Figure 6-7).

Figure 6-7. Report output with formatting
The EmployeeServiceCost_Format.rdl report in the Pro_SSRS project has the formatting elements applied.
Adding Subtotals
Having subtotals at each grouping level makes the report much easier for the user to read. This is especially true if the report has interactive drill-down features, as yours will have.
Adding subtotals to the groups is as easy as copying and pasting or entering the field value expressions— in this case, =Sum(Fields!Visit_Count.Value) and =Sum(Fields!Estimated_Cost.Value)—to the upper level grouping cells in the report. For this report, you have defined a group for the Employee_Name field in the detail row. This forces the report to calculate the sums of the Estimated_Cost and Visit_Count fields for each employee. For this report, this is all that is required, but for many other reports you will be creating, you will need to include the detail records for a more granular analysis.
In preparation for adding interactivity to the report, you will sum the Estimated_Cost and Visit_Count fields at all grouping levels by copying the Employee Cost and Visit Count textboxes at the Employee Name group level and pasting them into the cells in each group heading row—in this case, for Diagnosis, Service Type, and Patient Name. Alternatively, you could choose to enter the Sum value expression or to select Sum under the Summarize By submenu, as mentioned previously. If you choose one of these methods rather than copying and pasting, you will need to apply the currency formatting (C0) as you did previously. You will also make the topmost grouping (the Diagnosis field) bold by holding the Control key and clicking to highlight each of the Estimated Cost and Visit Count values in the Diagnosis group and then clicking the Bold button on the toolbar. With the bold formatting applied, the summed values at the group level will be easy to distinguish from the detail row values. The design of the report should look like Figure 6-8.

Figure 6-8. Report design with grouping level subtotals
The output of the report, which you can see by selecting the Preview tab, has much more valuable information now for each grouping. For Abnormality of Gait’s disease, for example, you can now see that there were 194 services for a total estimated cost of $9,700, and the bold formatting helps visually separate the values. The patient Russel Hansen (whose name is indented because of the padding you applied to the Patient group) is an Abnormality of Gait patient and has had 16 of the 68 home health aide visits. You can further see each employee’s visit count and the cost for this patient in the rows containing the Employee_Name grouping (see Figure 6-9).

Figure 6-9. Report output with grouping level subtotals
The EmployeeServiceCost_Subtotals.rdl report in the Pro_SSRS project includes subtotals.
Adding Interactivity
Regardless of the audience for a particular report—whether it is a decision maker interested in on-screen summarized data or a knowledge worker who needs the ability to print reports— interactivity within the report makes navigating to specific information easier and more efficient. You can provide interactivity within an SSRS report in several ways. You will be working with four basic types of interactivity in the following sections:
- Document mapping: Provides a navigation pane within the report with values based on a field or grouping.
- Visibility: Adds interactivity to a report by hiding and showing report items based on user input.
- Interactive sorting: Allows users to interactively select how the report data will be sorted.
- Hyperlink actions: Allows the user to click a report item that is linked to a location within the same report or external to the report.
The different rendering formats provided with SSRS, which are covered in detail in Chapter 7, accommodate viewing and printing reports to meet the needs of different types of workers. However, this produces a limitation in that some of the functionality of one rendering format is not available in other formats. This is most evident when working with interactivity, as you will see in the “Interactive Sorting” section.
Document Mapping
Creating a document map in an SSRS report will present users with an integrated navigation pane when the report is rendered. The user can select an item in the navigation pane, which will cause the report to jump to the position where that item is located. In the example report, for instance, a user might be interested in viewing information about Alzheimer’s patients. You can create a document map for the Diagnosis group in the report so that when the user selects Alzheimer’s from the navigation pane, the report will automatically skip to that section; in other words, the user will not have to manually search through the report to find the desired information. You can also add document maps at multiple levels, creating a hierarchical selection in the navigation pane. Keeping with the example, you can add a document map to the Service_Type group in addition to the Diagnosis group; the user can then expand Alzheimer’s in the navigation pane to see all the types of services—home health aides, for example—that have been performed for each diagnosis.
You create document maps by adding an expression to the Document Map Label property available for individual report items or for groups. Begin this example by opening the EmployeeServiceCost_DocumentMap_Start.rdl report in the Pro_SSRS project. By following these steps, you will add a document map label to the Service_Type and Diagnosis groups:
- On the Design tab, right click the Service_Type group in the Row Groups pane and select Group Properties. Next click on the Advanced tab.
- In the Advanced tab of the Group Properties, select Service_Type in the Document map dropdown.
- Complete steps 1 and 2 for the Diagnosis group, which is the first-level grouping above Service_Type. Select Diagnosis for the Document Map Label option.
Now when you preview the report, the navigation pane will automatically be displayed on the left side of the report. The preview, which is in HTML by default, displays in one of the rendering formats that supports document mapping, such as PDF (see Figure 6-10).

Figure 6-10. Report with navigation pane from document map
The EmployeeServiceCost_DocumentMap.rdl report in the Pro_SSRS project includes a document map.
![]() Note Adobe Acrobat views document mapping as bookmarks when the report is rendered in PDF. Bookmarks in SSRS perform a different function altogether. They are embedded within the report, and report items are assigned bookmark links.
Note Adobe Acrobat views document mapping as bookmarks when the report is rendered in PDF. Bookmarks in SSRS perform a different function altogether. They are embedded within the report, and report items are assigned bookmark links.
Visibility
Another feature of SSRS is the ability to show or hide areas of the rendered report based on user input, results returned in a dataset or based on some predefined logic. Often users want to see only summary information on a report, but would like to be able to drill into the summary data to see the detail information if necessary. Report designers might make two reports, a summary and a detail report, which have to be updated and maintained separately. These reports are often based on the same query. Fortunately, SSRS’s ability to show or hide report data does away with the need to create separate reports. The visibility properties for report items control which report items are shown or hidden.
Let’s assume you have distributed your report to your intended audience, and they have come back with “suggestions” for how to improve the report—this is real world reporting, after all. They indicate that they would like to see the following:
- Summary totals for the visit count and the estimated cost of each diagnosis when the report is first rendered, but with the ability to drill into the details of the patients and employees if warranted.
- The number of patients who have a specific diagnosis.
- The number of individual employees who have provided care for these patients.
With SSRS, this is fairly straightforward, and you can knock out an improved report quickly. Start this example by opening up the EmployeeServiceCost_Visibility_Start.rdl report in the Pro_SSRS project. Then, you’ll just need to follow these design steps before modifying the visibility properties:
- On the Design tab, right-click the entire column labeled Diagnosis > Service > Patient > Employee, and select Insert Column Inside Group - Right. Complete this step one more time so that we have two empty columns between the groups and the Estimated Cost and Visit Count columns.
- Enter Employee Count and Patient Count as the new column header text in the second and third columns, respectively.
- Resize the second and third columns in the table from right to left so that they are approximately 1 inch each. If, by default, you do not see the ruler, you can right-click a blank area of the design environment and select Ruler under the View Menu.
- Highlight every cell in the Service Type, Patient Name, and Details rows. You can accomplish this by holding down the Control key and clicking the row marker to the left of the first column in the table. Once all the rows are highlighted, select an 8-point font size from the formatting toolbar.
You can control the visibility state of report items, hidden or visible, by setting the visibility property values. You can hide report items at any level in the report and toggle their visibility property values when a user clicks the + or – icon to show or hide them. The toggle point of the hidden items is another report level, such as a group. In this example, you would like to hide every level except the Diagnosis and Service_Type fields, but give the user the ability to show or hide the details. To begin, hide every group except Diagnosis and Service_Type. The steps to accomplish this are as follows:
- Right-click the Employee_Name group in the Row Groups section and select Group Properties. Then click the Visibility tab.
- On the Visibility tab, select the Hide radio button.
- Enable the checkbox to Display Can Be Toggled by This Report Item.
- In the Report Item drop-down list, select Patient_Name.
- Perform steps 1 through 4 for the Patient Name group, selecting or typing Service_Type as the toggle report item.
The other two requests were to be able to see the patient and employee totals for each diagnosis. You can add an expression, CountDistinct, to the report that will count each unique patient and employee and calculate the amounts at the diagnosis level. The syntax used for the patient count is as follows:
=CountDistinct(Fields!FieldName.Value)
By adding the CountDistinct expression for the field PatID (which you know to be unique per patient) as well as for the field EmployeeID, it will be much easier to see at a glance how many patients with a specific diagnosis have received care.
Place the following two expressions for the Diagnosis group in the cells just below the Employee Count and Patient Count header cells:
=CountDistinct(Fields!EmployeeID.Value) =CountDistinct(Fields!PatID.Value)
Though the report is still similar to the non-interactive report, with the drill-down additions it will look much different when previewed (see Figure 6-11). In the screenshot in Figure 6-11, you will notice that we hid the document map to provide more space for the report. You can show or hide the document map by double clicking the tiny arrow in the center of the bar separating the document map and the body of the report.
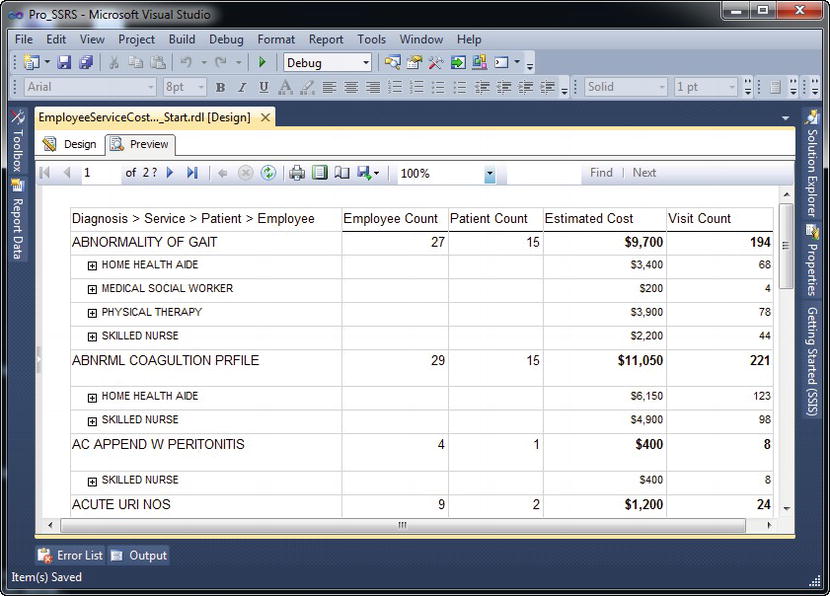
Figure 6-11. Report with interactive drill-down
The EmployeeServiceCost_Visibility.rdl report in the Pro_SSRS project includes the visibility properties.
Interactive Sorting
It never fails when deploying a report to a large audience: someone will ask that the report be sorted in a certain way that usually differs from the way it was originally designed. When this scenario happens, typically the report designer is torn between creating a second, almost identical, report with custom sorting to appease the requestor and placing the request in queue for a future enhancement to the report. Interactive sorting allows users to sort the report at runtime on any number of fields that have been defined to use this functionality.
In the sample report, you know that you have a broad audience that may use this report for different purposes. A chief financial officer (CFO), for example, may want to view the report to see which diagnosis has the most number of visits. In contrast, another user may need to understand how many patients have a certain diagnosis and would like the report sorted by patient count, rather than visit count, at the Diagnosis group level. In this section, you will add interactive sorting to the report to meet these two needs, knowing that it is possible to sort the report using any other criteria if requested without having to create additional reports based on a user subdivision.
Since you know that the interactive sorting you will apply to your report will be patient count and not visit count, all that you have to do is add this criterion to each of the textboxes where the users will click to change the sorting based on their needs. Using the EmployeeServiceCost_InteractiveSort_Start.rdl as our starting point, add the interactive sorting to the header cells Patient Count and Visit Count by following these steps:
- On the Design tab, right-click the Patient Count header textbox, and select Textbox Properties. Click the Interactive Sorting tab.
- Check the box titled Enable Interactive Sorting on This Text Box.
- In the Choose what to sort area, select the Groups radio button and add Diagnosis as the group expression. In the Sort by area enter =CountDistinct(Fields!PatID.Value).
- Check the option Apply This Sorting to all Groups or Data Regions in and then select the Emp_Svc_Cost data region, or type in that region name. Click OK
- Right-click the Visit Count header cell, and perform steps 1 through 4, replacing the sort expression with =Sum(Fields!Visit_Count.Value), as shown in Figure 6-12.
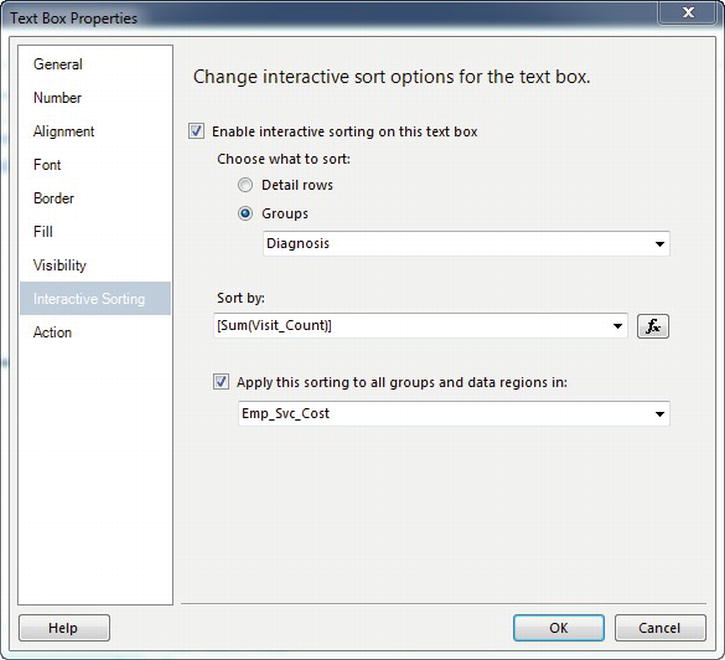
Figure 6-12. Interactive sort properties for the visit count
When you view the report with the new interactive sorting expressions in place, you can see the automatic addition of a selectable sort icon in the Patient Count and Visit Count header fields, as shown in Figure 6-13. When a user clicks this icon in the browser, the report will automatically re-sort to show either the greatest or least number of patients per diagnosis or the greatest or least number of visits per diagnosis. Figure 6-13 shows the diagnosis with the most number of visits, which is Physical Therapy NEC with 1,579 visits and 76 unique patients diagnosed with this illness. The user could also choose to sort the report in ascending or descending order by the number of patients.
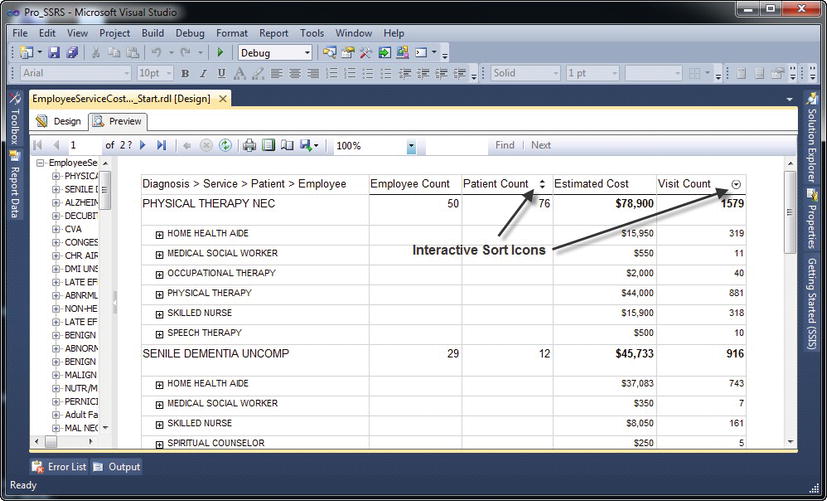
Figure 6-13. Report sorted interactively to show the number of patients
Interactive sorting is a property of the textbox report item and is typically used on column headings in a Table or Matrix data region. A single textbox can control sorting for one or more data regions as long as they are within the same scope or grouping. For example, it is possible to sort multiple tables that are nested within a List data region.
The EmployeeServiceCost_InteractiveSort.rdl report in the Pro_SSRS project includes interactive sorting.
Hyperlink Actions
Having the ability to link one report item, such as the contents of a textbox, to another report or URL adds another valuable level of interactivity in SSRS. By adding hyperlinks to an SSRS report, users can work with the report as they would an application or a Web page, making their tasks more efficient. The sections to follow show how to add several links or actions to your reports to aid users in linking to other reports and locations, such as a company intranet site. You can associate three basic actions with values in a report:
- Jumping to a bookmark
- Jumping to a URL
- Jumping to a report
You can find these on the Action tab of the report items that support these actions, such as textboxes, charts, and images.
To demonstrate each of these hyperlink actions, we will use a report that is more suited to hyperlink actions than the one you have been designing thus far, which already contains one level of interactivity in the drill-down functionality. The next report, Employee Listing, will provide a simple list of employees, grouped according to their clinical specialty. Two reports are available in the code download for the Employee Listing report. One is provided with only the dataset created so that you can step through the following procedures to create the report. It is called EmployeeListing_Start.rdl. The other report is a complete version called EmployeeListing.rdl.
You will add the three interactive hyperlink actions to the report to deliver the following features:
Bookmark: When the employee name is selected, the report will jump to a bookmarked location within the report that contains more details about the employee, such as the number of patients they have seen.
URL: You will also set up a link to the employee’s department web site, based on the employee’s discipline or clinical specialty. You will also use a report parameter that you will set up specifically for the purpose of selecting the employee’s branch location. When users select a branch location from a drop-down list provided with the report parameter, they will be taken to their own department’s intranet site. This functionality is shown for example purposes only and will not actually take you to an intranet website; that is, unless you have intranet sites set up for the branches and subfolders for each, containing the disciplines.
Report: You will add a link to your Employee Service Cost report that will pass an EmployeelD parameter to limit the results of the linked report. You will use the same technique in the Employee Service Cost report that will link to a patient survey form using rich-textbox formatting.
The completed Employee Listing report will contain two Table data regions: one for summary information and one for detailed information about the employee’s visits. You will add the hyperlink actions to the summary portion of the report, which will be the first page the user sees. Listing 6-1 shows the query for the dataset that delivers employee information. For this report, you will limit the employees to a known set, as shown in the WHERE clause, to keep the report small. You will also add a date range with two parameters, @DateFrom and @DateTo, which you will create and utilize later. The EmployeeListing_Start.rdl report contains default values for a date range from January 1, 2007, to the current date using the Today() function. This query with sample variable settings can be found under the Queries folder in a script named EmployeeListingQuery.sql.
Listing 6-1. Employee Listing Query
SELECT

        RTRIM(E.EmployeeID) AS EmployeeID

        , E.LastName

        , E.FirstName

        , E.EmployeeTblID AS EmpTblID

        , E.EmploymentTypeID AS EmploymentType

        , E.HireDate

        , D.Dscr AS Discipline

        , P.LastName AS patlastname

        , P.FirstName AS patfirstname
, T.ChargeServiceStartDate
, D.DisciplineID
, P.PatID
FROM
Trx AS T
JOIN ChargeInfo AS CI ON T.ChargeInfoID = CI.ChargeInfoID
JOIN Employee AS E ON E.EmployeeTblID = CI.EmployeeTblID
JOIN Discipline AS D ON E.DisciplineTblID = D.DisciplineTblID
JOIN Patient AS P ON T.PatID = P.PatID
WHERE
(T.ChargeServiceStartDate BETWEEN @DateFrom AND @DateTo)
To begin, open the EmployeeListing_Start.rdl report. The steps to produce the initial basic report, as shown in Figure 6-14 are straightforward, with only a few pointers needed. First, you will be using a Table data region again, so simply drag the table to the report area on the Design surface. When you add a table, BIDS automatically generates three columns. Add another column to the table. Next, add the following fields onto the detail columns: EmployeeID, LastName, HireDate, and Discipline. The employee Discipline field references an employee’s clinical specialty, such as Home Health Aide or Skilled Nurse. Now that we have a start, let’s edit the Lastname field to make it a concatenated value for Employee Name using the LastName and FirstName columns separated by a comma (Ex. LastName, FirstName). Right click on the Lastname textbox in the details row and select Expression. Because the first and last name fields have been padded with spaces, you will want to use the RTRIM function to remove the extra spaces. The expression for the last name text box should look like this:
=RTRIM(Fields!LastName.Value) & ", " & RTRIM(Fields!FirstName.Value)
Now that you have combined LastName and FirstName into one, change the header from Last Name to Employee Name. Make the entire header row of the table Bold. Finally, let’s change the Employee column to look a little more like a hyperlink. Select the EmployeeID detail field and then set text to be underlined and the font color to blue.
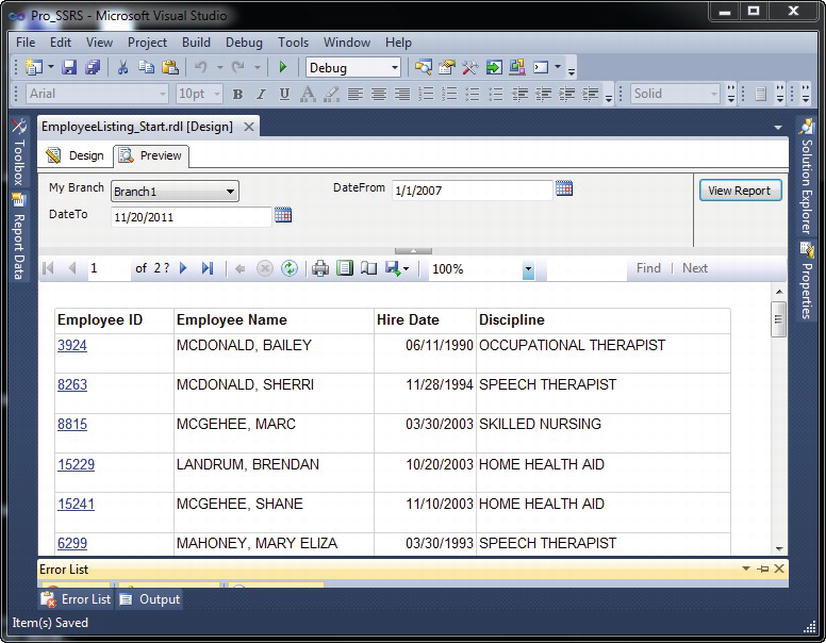
Figure 6-14. Employee Listing report with hyperlink actions
Additionally, when using dates, the default format includes the date and time values, even if there is no time associated with the date. The hire date might look like this, for example: 10/20/2003 12:00:00 AM. By right clicking and selecting the Textbox Properties of the Hire Date cell, you can change the format from the default to a more standard format. Change the format under the Number tab to MM/DD/YYYY format, such as 10/20/2011, excluding any time value. The format code for this date is d or you can enter MM/dd/yyyy.
Next, because you are returning detail records, with more than one per employee, you need to group the detail row itself using the value of the Employee Name field. You can do this by right-clicking the detail row grouping in the Row Groups area and selecting Group Properties. In the Group On expression field, add the same trimmed employee name as shown in the previous code line. Now, when you preview the report, you have your list of employees to which you can add hyperlink actions. Finally, force a page break after this table so you can add a detailed table that will be used as a bookmark link. To add a page break to a report, simply select the tablix, then right-click a column to get to the table properties, as shown in Figure 6-15. On the General tab, select Add a Page Break After.

Figure 6-15. Tablix Properties
Adding a Bookmark Link
In this section, you will add a bookmark link to the Employee Name field in the Employee Listing report that, when clicked, will jump to a defined location within the report. In this case, you will not add another Table data region to the report to contain detail information about employee visits. Bookmarks ease the navigation burden on large reports when users are looking for specific information. As discussed previously, summary and detail information can exist within the same report; in the case of adding a bookmark, you are not hiding the data so much as moving it to another location within the same report. The net effect for the user is the same, however, in that they control when they see the detail information.
To add a bookmark to the Employee Listing report, first follow the procedure to drag a new table element to the Design tab. Next, drag the patLastName over into the first column of the table. Right click it and choose Expression. Write an expression similar to the one you did for the Employee Name column earlier, but utilize the patLastName and patFirstName columns. Rename the header Patient Name. Now, for this table, you will want to group by the employee name, so right-click your detail row and select Add Group and then select Parent Group. You will use the same trimmed expression as the group value expression, as follows:
=RTRIM(Fields!LastName.Value) & ", " & RTRIM(Fields!FirstName.Value)
Change the name of the group to Employee_Name. Then, on the Page Break tab, select the option to enable a break Between each instance of a group. This will force the detail line for each employee to start on a new page. Next, add the date field that represents when the service was performed, =Fields!ChargeServiceStartDate.Value, to the third column, and format the date as you did earlier using the MM/dd/yyyy style.
Now when you preview the report, the summary employee listing will appear on the first page, and the detail records that show the employee visits will appear on each subsequent page.
Next, you will add a Bookmark property value to the Employee_Name field in the detail row of the second table. In SSRS 2012, you will need to add the Bookmark to a field using the Properties window. With the Properties window visible, click the Employee Name field in the details row, shown in Figure 6-16. In the Properties window, enter your trimmed employee name expression into the bookmark value box. This will serve as the pointer record for the bookmark link you will now create.
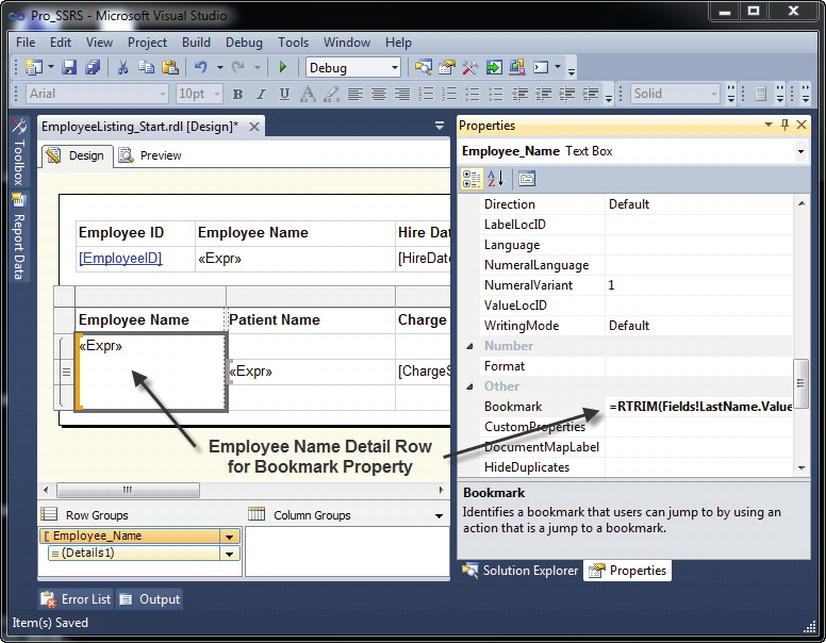
Figure 6-16. Setting a Bookmark Property Value
To create the bookmark link: In the first table, right-click the Employee Name detail row and select Textbox Properties and then click the Action tab. In the Change Hyperlink Options section of the tab, select Go to Bookmark and paste in the trimmed employee name expression you used for the Bookmark property.
![]() Tip Hyperlink actions do not automatically change the formatting of the field to indicate an associated hyperlink. You can manually change the color and add underline formatting so that the user knows to click the link.
Tip Hyperlink actions do not automatically change the formatting of the field to indicate an associated hyperlink. You can manually change the color and add underline formatting so that the user knows to click the link.
When you preview the report, and click the new bookmark link, you see the detailed information for the selected employee, as shown in Figure 6-17. You should see detailed information for employee Bailey McDonald; the first three pages of the report are the Employee Listing table, where you clicked the bookmark link in the Employee_Name field.
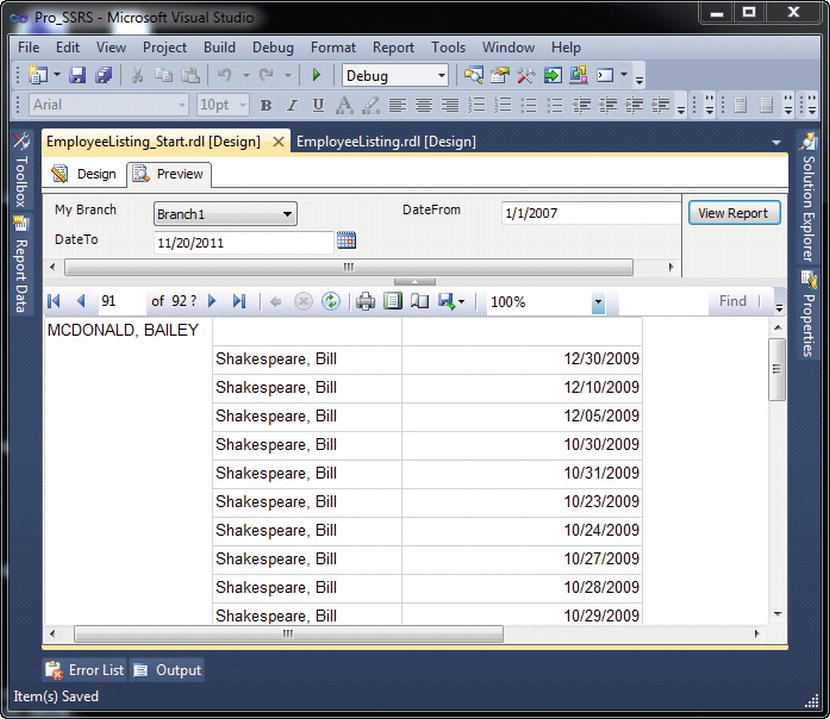
Figure 6-17. Employee visit detail report called from a bookmark link
Adding a URL Link
URL links connect a report to information stored in other locations, such as a Microsoft SharePoint site or the Internet. Like bookmark links, URL links are defined on the Action tab and can be applied to many report items. As discussed in Chapter 4, in almost every value field that is used in SSRS, expressions define the contents. In the case of the URL, you will build an expression that will define the HTTP location, using a combination of the literal URL and a field value from the dataset.
For example, let’s assume that your intranet site has a home page that is designed specifically for each employee discipline. An employee who is a home health aide would have a DisciplineID of HHA, and your Web site designed for home health aides would be at http://webserver1/hha. Assuming that the same is true for each discipline, it would be easy to add a URL link for each discipline to your report.
Just as you did for the bookmark link for Employee_Name, open the Action tab for the Discipline field. Select Go to URL, and add the following expression:
="http://webserver1/" & Fields!DisciplineID.Value
When the DisciplineID field is selected within the report, the browser will open and connect to the site of the specific employee’s discipline—for example, HHA for the home health aides site or RN for the skilled nursing site.
Building the URL Link with a Report Parameter
Taking the concept one step further, if you had multiple Web servers at different locations or branches, you would not want to hard-fix the Web server name in the URL string. Using a report parameter to select the server name based on the branch location would make it possible to control the Web server portion of the URL string that you created in the previous example. Let’s step through this procedure. Figure 6-18 shows how the Report Parameter Properties dialog box should look.
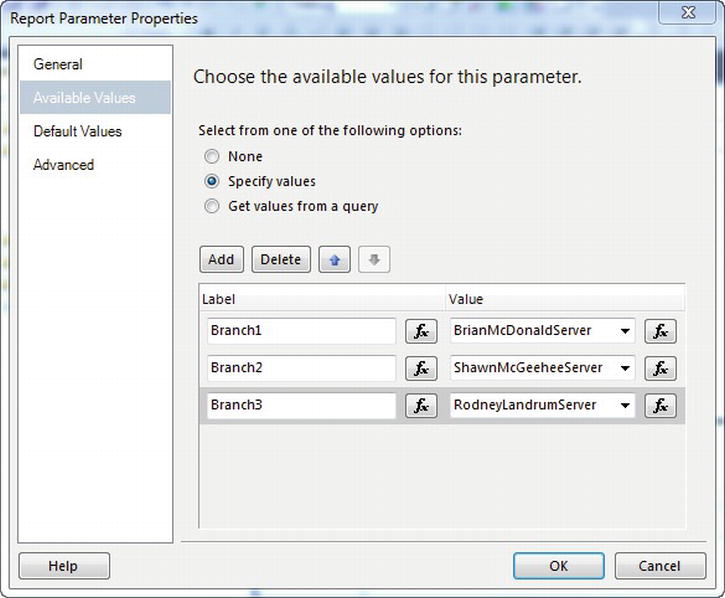
Figure 6-18. Report Parameter Properties dialog box
- While on the Design tab, right-click the Parameters folder in the Report Data pane and select Add Parameter.
- Enter Branch_URL for the parameter name.
- Enter My Branch for the prompt.
- In the Available Values section, enter the following labels/values: Branch1 = BrianMcDonaldServer, Branch2 = ShawnMcGeeheeServer, and Branch3 = RodneyLandrumServer.
- Set the default value to be BrianMcDonaldServer.
- Return to the Action tab for the Discipline field, and apply the new expression
="http://" & Parameters!Branch_URL.Value & "/" & Fields!DisciplineID.Value. - Preview the report. Notice that you have a new parameter drop-down list called My Branch that was set to Branch1 based on the default value of BrianMcDonaldServer.
With the URL location assigned to be that of the parameter Branch_URL, whenever a different branch is selected from the drop-down list, the appropriate server for that branch will be selected.
Jumping to a Report
Quite possibly the most useful hyperlink action in SSRS is the ability to link to another report, called a drill-through report, from a specified location within the current report. In this section, you will link to a new report, the Patient Survey Letter report, from the Employee Listing report. The Patient Survey Letter report uses a single textbox and demonstrates how you can take advantage of the new rich text formatting made available with SSRS 2008 to form a mail merge style report using both HTML formatting as well as literal text strings, all formatted independently.
You will tie the two reports —the Employee Listing report and the Patient Survey Letter report—together by creating a hyperlink from one to the other. You will also pass a parameter value along with the hyperlink to narrow the results of the Patient Survey Letter report when it is called from the Employee Listing report. The parameter values will be PatID, ServiceMonth, and ServiceYear.
To add the hyperlink action that links to the Patient Survey Letter report, return to the Action tab, this time from the Patient Name detail row textbox within the Employee Listing report. The Patient Name detail textbox is in the second table, shown in Figure 6-19.

Figure 6-19. Patient Name detail textbox to add Go to Report hyperlink action
After clicking the Go to Report button, a drop-down list appears with all the reports that are available in the current solution. If the report has already been deployed to the report server and is not in the current solution, you can use the relative path based on the target server that is defined in the project. In this example, the target server is http://localhost/reportserver. You could add the relative path to any report on the report server. In this case, select the PatientSurveyLetter.rdl report, and then click the Add button three times to add PatID, ServiceMonth, and ServiceYear. Choose the parameters that are populated when the report is selected. Later in the “Setting Report Parameters with Stored Procedures” section, we will show how to add these parameters to the report. Choose PatID as the parameter, and assign its value as =Fields!PatID.Value, which is a field in the Employee Listing report that has a corresponding value to the PatID parameter. Next create an expression for ServiceMonth as =MONTH(Fields!ChargeServiceStartDate.Value) and ServiceYear as =YEAR(Fields!ChargeServiceStartDate.Value) respectively. After applying the new action, if the Patient Name textbox is clicked when previewing the Employee Listing report, the Patient Survey Letter report will be called and the parameter passed, thus narrowing the dataset for that report to only that for the selected patient.
For the Patient Survey Letter report, you will use a modified version of the Emp_Svc_Cost stored procedure that includes a parameter for the PatID field. The reason for doing this is because the Textbox control does not support filter criteria, and you will need to limit the letter to one patient as it is linked with a single parameter. For merge letters, it is of course possible to use more than one patient. To show both linking to another report and to demonstrate the new textbox formatting, we simply wanted to show the basics of both.
Let’s look at the Patient Survey Letter report and the textbox with rich formatting. As you may recall from Chapter 4, textboxes now support placeholders, which can be simple and complex expressions as well as HTML code imported from a table. You will combine elements of each to produce a simple letter addressed to an individual patient. As you can see in Figure 6-20, the letter itself consists of one textbox and one table. The textbox contains a placeholder at its beginning, titled Template_Letter_Header. This placeholder gets its formatting via HTML imported from a dataset that stores the HTML tags in a field.

Figure 6-20. Patient Survey Letter report with multiple placeholders
The HTML code is derived from the Format table in the Pro_SSRS database. You can see the sample output of the field in Figure 6-21.
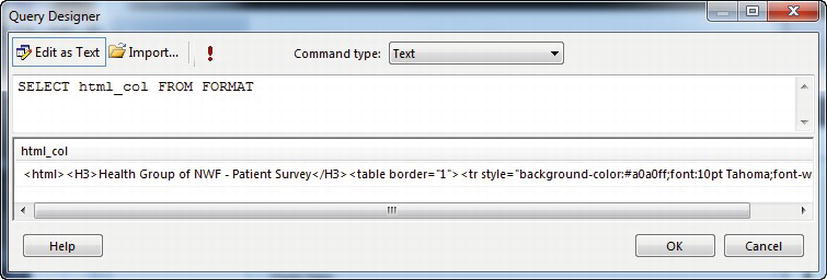
Figure 6-21. Output of the HTML code from the Format table
To assign the HTML code to the textbox placeholder, all that you need to do is right-click anywhere in the textbox and select Add Placeholder. You will label each placeholder as well as assign it an expression value. In this case, you will assign it the value =FIRST(Fields!html_col.Value, "DataSet1") as there is only one row in the format table for this example. In order for the HTML to be displayed correctly in the textbox, with all formatting, it is important to select HTML – Interpret HTML Tags as Styles from the Placeholder Properties box, as in Figure 6-22.

Figure 6-22. Placeholder Properties dialog with HTML selected
The textbox can also contain expressions that correspond to other field values from datasets as well, just as you would expect. After the greeting, you can see that we have added the patient’s name as another placeholder. This name, which contains the value expression =FIRST(Fields!Patient_Name.Value, "DataSet2"), will change with the parameter value that we set up for the PatID field.
The remainder of the textbox contains additional formatting, such as bold, italicized, and font color of some text, all of which are independent of the header placeholder that contains the HTML code. This kind of formatting was not available before SSRS 2008. With the ability to also export to Microsoft Word, rich text formatting opens up new avenues of report creation for your business. Figure 6-23 shows the rendered Patient Survey Letter report.
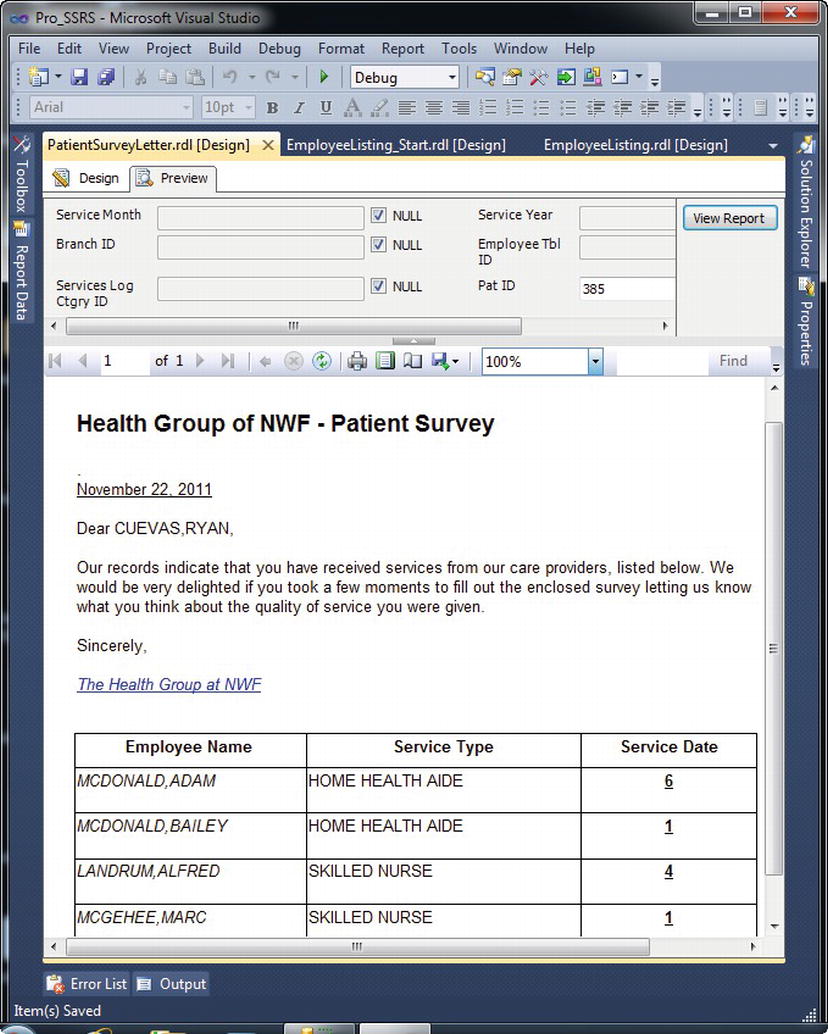
Figure 6-23. Patient Survey Letter rendered
The Patient_Survey_Letter.rdl report is available in the Pro_SSRS project.
Adding Hyperlink Formatting and Tooltips
Before you save the new Employee Listing report with added links, let’s add two formatting properties that will make the link more obvious as well as provide feedback on what will happen when the link is selected. The first task is simply to make the EmployeeID field resemble a hyperlink. Select the field, and apply an underline and color format of blue (see Figure 6-24).

Figure 6-24. Employee Listing report with visible hyperlinks
Next you will add a tooltip to the same field. Tooltips appear whenever a user hover’s the cursor over the field, and they provide additional information. In this case, you will use one simply to show which report will be called when the EmployeeID box is clicked—the Patient Survey Letter report. The ToolTip property is located on the General tab of the Textbox Properties window. After selecting the field, open the Properties box, and enter Patient Survey Letter as the tooltip. Notice that the tooltip, like most other values, can be an expression as well as a literal string.
It is possible to assign multiple parameter selections, dataset fields, expressions, and fixed literals as input for the drill-through report. Now that you have linked to a report that could potentially have multiple parameters, let’s take a closer look at how parameters and filters work together to deliver data to a report.
Setting Report Parameters with Stored Procedures
In Chapter 3, we introduced parameters and explained how you can use them within reports and queries to limit the results returned from the data source. Up to this point, you have been working with different kinds of datasets, queries, and stored procedures to build reports, but we have only touched the surface of how you can use parameters within SSRS. Parameters get their values primarily from user input and are most often associated with a dataset; they are used to limit the amount of data returned. When a parameter is used in this way, it is called a query parameter. Query parameters that are part of a dataset, such as a SQL query or stored procedure, automatically generate report parameters within SSRS.
In this section, you will modify the dataset of your Employee Service Cost report to use a parameterized stored procedure instead of a query. By default, report parameters generated from stored procedures do not have populated drop-down lists of data for users to select, so in this section you will also populate the report parameter lists with valid data for user-selectable input. Finally, you will see how SSRS works with NULL parameter values and how to generate a NULL value for the parameter. This will become especially important when retrieving data for your SSRS report, as we will explain later in this section.
You will return to the stored procedure you have already created, called Emp_Svc_Cost, which, as you might recall, will deliver the same dataset as the SQL query you have been using. The stored procedure has the added benefit of accepting all the parameters you want to use in the report. SSRS will automatically create the report parameters from the stored procedure. Let’s quickly review the parameters that will be passed into the report from the stored procedure:
- BranchID
- EmployeeTbllD
- ServiceMonth
- ServiceYear
- ServiceLogCtgrylD
To create the parameters automatically for your Employee Service Cost report, which is currently using a non-parameterized query, you will simply change the dataset for your report to the stored procedure.
Open the EmployeeServiceCost_SP report from the project included in the code download. In the Report Data window that has the dataset Emp_Svc_Cost, you can right-click the Emp_Svc_Cost dataset and select Dataset Properties to open the Properties window. In the Dataset Properties dialog, change the Query type from Text to Stored Procedure. Next, select or type the name of the stored procedure, Emp_Svc_Cost, in the Query String window, and click OK. When you click OK, the parameters will be created automatically for you. Next, right-click the Emp_Svc_Cost dataset again and select Query. You should see that the query will execute the Emp_Svc_Cost stored procedure. Click the Run button, which will prompt you to input the parameter values, as shown in Figure 6-25. Since the stored procedure is designed to accept NULL values, change the default input value in the Define Query Parameters dialog box from Blank to NULL, and click OK to complete the execution. If you do not select NULL instead of Blank, the query will fail with an error message, “Failed to convert parameter value from a string to Int32.”
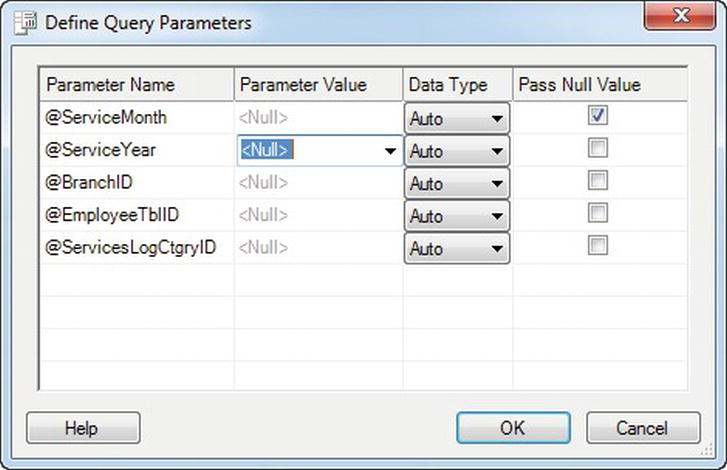
Figure 6-25. Parameters required for the stored procedure Emp_Svc_Cost
In the Report Data window, you can see that the report parameters were automatically created from the stored procedure. Although SSRS did correctly assign the datatype for each parameter, integer, and string, it did not automatically set the field to allow NULL values (see Figure 6-26). For the purpose of this report, which expects NULL values as possible parameters, it is important that the Allow Null Value checkbox is selected for each parameter so that when the report is previewed, NULL will be the default value, and the NULL checkbox will be automatically checked so that the report executes without requiring user input. Go ahead and update all of the parameters to Allow null value by right clicking each of them and selecting Properties. Then put a check in the option Allow null value under the General tab.

Figure 6-26. Report Properties dialog box, showing the Allow Null Value field
Default parameter values will also need to be manually configured. If no default parameter value is assigned to an available parameter, the report, when rendered or previewed, will not process the incoming data until a user supplies a value. Previewing the report without modifying the parameter selection reveals that the user would need to enter a value for each parameter that has no default value assigned. The user would not be able to choose from a list of values, but would have to enter them manually. This is often unacceptable because the user may not always know the correct values to enter; good examples of this are the EmployeeTblID field that is used to select a specific employee and the BranchID field used to retrieve the branch name.
The first step is to provide valid query-assigned values for the parameter drop-down lists. It would be beneficial to provide a view of the report in preview mode prior to adding descriptive parameter values from a new dataset (see Figure 6-27). Notice that there is a NULL checkbox selected next to the parameter selections. The NULL checkboxes appear when the parameter allows NULL values, as you set earlier, and there are no other available values.
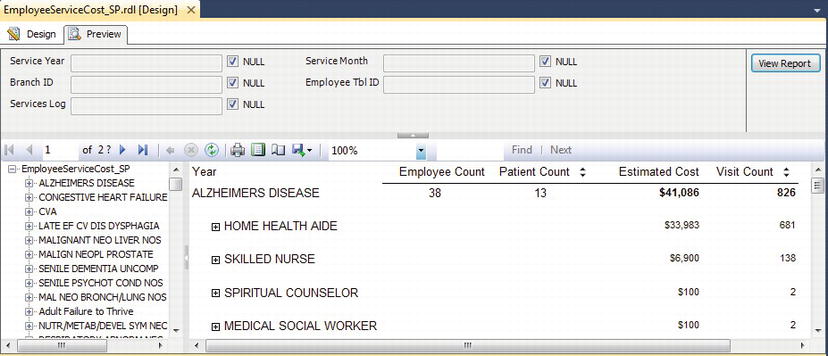
Figure 6-27. No parameter values available via drop-down list
The following scripts can be used to add two datasets to populate the Branch and Employee drop-down lists for the parameters:
- In the Report Data window, create two new datasets embedded in the report, Employee_DS and Branch_DS, by right-clicking the Datasets folder and selecting New Dataset. For both datasets you create, you will add simple queries that will return the IDs (for the Value attribute) and names (for the Label attribute) for the employee and the branch. Notice in the WHERE clause of the employee query that follows that you are including only a known set of employees for simplicity. In a real world scenario, business rules dictate filters, but you probably wouldn’t hard code your values in this fashion. We are just showing one way that you could hard code a filter to return a subset of data to be used in our parameter drop-down list.
--Query for Employee Parameter

SELECT

        EmployeeTblID

        , RTRIM(RTRIM(E.LastName)  +  ', '  + RTRIM(E.FirstName)) as Employee_Name

FROM

        Employee E

WHERE

        (E.EmployeeTblID IN (32, 15, 34, 44, 129, 146, 159, 155, 26))

--Query for Branch Parameter

SELECT

        BranchID, BranchName

FROM

        Branch

UNION

SELECT NULL AS BranchID, NULL AS BranchName - After you have created the datasets with the previous queries and verified that they execute properly via Query in the Report Data window, expand the Parameters folder. Right-click the BranchID parameter, select Parameter Properties, and enter Branch for the prompt for clarity. You will be selecting the branch name in the drop-down list.
- In the available values for the branch parameters, select Get Values from Query, and then select the Branch_DS dataset. The Value field will be BranchID, and the Label field will be BranchName.
- Follow the same steps to modify the Employee parameters, assigning Employee_DS and choosing the Value and Label fields as EmployeeTblID and Employee_Name, respectively. Finally change the prompt to Employee for clarity as we performed in step 2. When finished, select OK.
- Finally, on the Design tab, you will add a grouping for Branch Name to the table in the report so that as the parameters are selected, you can see that the report is specific to a branch. To do this, right-click the row header to the left of the Diagnosis textbox in the table, and select Add Group >> Parent Group. This will make the Diagnosis group, formerly the first group, now the second group and will add a new group. Assign the expression value of =Fields!BranchName.Value to the new group, select the option to Add group header and click OK in the Grouping dialog box. Next, move the BranchName field from the new first column row for the Branch group you just created and into the blank area just above Diagnosis. Also, make the field bold, and resize the font to 12 points. Now that it is formatted, delete the column that was created when you added the new BranchName group. You can delete the column by right clicking it and selecting Delete Columns.
The report will now have populated drop-down lists for the available parameter values, as shown in Figure 6-28. Notice that for the two parameters where you have added available values, the NULL checkbox has disappeared.
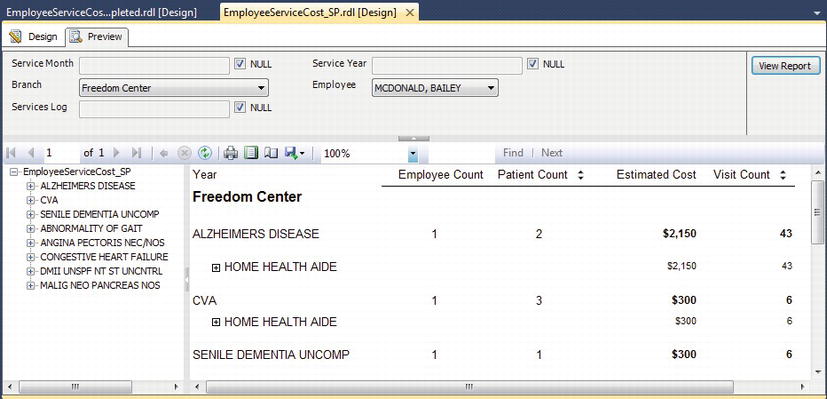
Figure 6-28 Report with populated parameter selections
You could perform the same steps for the ServiceLogCtgryID parameter and provide a valid drop-down list from the table values. However, since you may also be viewing the report in a custom report viewer that will also accept parameter values, this particular parameter value is of little use to you now for direct user input. That being the case, it will be beneficial to take advantage of another new and much needed feature, the ability to hide parameters. This functionality was added in Service Pack 2 for SSRS for SQL Server 2000 and is available all other releases since. Sometimes a parameter can and should be populated by events other than user input. In these instances, users will only be confused by seeing these additional parameters. In the Report Parameters dialog box, select the ServicesLogCtgryID property, and check the Hidden box. It will also be beneficial to modify the time-based parameters (Service Year and Service Month) for this report. Time-based values are often tricky to deal with because of the special formatting needs of the DateTime datatype, which can store years, months, and days as well as hours, minutes, and seconds. The procedures for setting up the Service Year and Service Month parameters with valid values is almost identical to the Branch and Employee procedures covered earlier, with the exception that the Service Year needs to default to the current year and not NULL.
The first step is to create a dataset for the Service Year and Month parameters based on the service date, which is the field ChargeServiceStartDate in the stored procedure. You will use the DatePart and DateName functions in the two queries to derive valid values. The valid values for the dates are contingent upon their existence in the table, so, for example, if your data contained values for 2009 and 2010, only those two years would show up in the drop-down list. Populating the date values in this way precludes the user from having to enter a date and also prevents the report designer from having to hard-code year and month values into the report. These Year and Month datasets have already been added to the report. However, we need to set the parameters Available Values to use Get values from query as we did previously. For ServiceMonth, use the Month dataset and set ServiceYear to use the Year dataset.
Listing 6-2 shows the two queries that drive the parameter values.
Listing 6-2. Parameter Value Queries
--Query to Derive Year

SELECT

        DISTINCT DATEPART(yy, ChargeServiceStartDate) AS Year

FROM

        Trx

UNION

SELECT Null AS Year ORDER BY Year


--Query to Derive Month

SELECT

        DISTINCT DATEPART(mm, ChargeServiceStartDate) AS DateNum

        , DATENAME(mm, ChargeServiceStartDate) AS Month

FROM

        trx

UNION

SELECT Null AS DateNum, Null AS Month ORDER BY DATEPART(mm, ChargeServiceStartDate)
To finish the report, add the Service Year field to the report by right clicking the BranchName field, Insert Row and then Inside Group – Below. Select the Year field from field selector list by placing the cursor over the top right corner of the blank space created underneath BranchName and clicking the field list box. Change the aggregation to be FIRST rather than the default SUM. Next, format it with a distinct color (in this case, dark salmon), set the alignment to be left justified and then resize the field to 12 points. Then, set the default value for all of the parameters with the exception of Service Year to be (NULL). To do this, use the Default Values tab under the Report Parameter Properties. Then select Specify values and click the Add button. Before you preview the report, it is important to set the default value for the year so that a valid Service Month selection is not based on the default Service Year field of NULL. This could potentially have undesired results; in other words, the user might select January and assume that it means January for the current year, when in fact it would be all occurrences of January.
To make the Service Year parameter default to the current year, go to the Parameters dialog box and set the Default Value option to the following expression:
=CINT(DATEPART("yyyy", Now()))
Also, in this report, we want to show the Service Year parameter before Service Month, so let’s move the ServiceYear parameter above ServiceMonth parameter. Re-organizing the parameters like this changes their order at runtime as well. Open up the Report Data pane and expand the Parameters folder. Select the ServiceYear parameter and click the up arrow in the Report Data pane menu. You can preview the report and provide parameter values (see Figure 6-29).
![]() Note Most of the data in the Pro_SSRS database is from 2009 and 2010. If the current year is defaulted to a different year, the data you see may not be the same as in Figure 6-29.
Note Most of the data in the Pro_SSRS database is from 2009 and 2010. If the current year is defaulted to a different year, the data you see may not be the same as in Figure 6-29.

Figure 6-29. Report with valid year and month values
The EmployeeServiceCost_SP_Completed.rdl report in the Pro_SSRS project includes populated parameters.
Working with Multivalued Parameters
Multivalued parameters, an enhancement released for SQL Server 2005, represent probably one of the most awaited features for an SSRS update. Having the ability to select multiple values individually to feed into the report is a powerful feature that most other reporting applications take for granted, but was not available in SSRS for SQL Server 2000. Working with multivalued parameters to achieve the most usefulness from them, however, requires special design considerations, as mentioned in Chapter 3. The reason for this, especially when working with stored procedures, is that the multivalued parameters are passed back to the stored procedure as a string value. The only way to work effectively with multivalued parameters is to know that the query or stored procedure will evaluate all, one, or multiple values returned to it based on user selection. Because SQL Server does not evaluate a string in the same way it does a single value in a stored procedure, which honestly has been the bane of SQL developers for years, you have to go into multivalued parameters knowing that you may have to parse string values if you want to use stored procedures and multivalued parameters together with SSRS. For writers/logicians like us, this is a fun game. For others, who have to develop reports with multivalued input parameters for a large audience, this can be a nightmare. Rest assured that once you understand string manipulation techniques, multivalued parameters will be a worthwhile time investment.
SSRS does support multivalued parameters out of the box for queries as long as they are not stored procedures. To work with multivalued parameters with queries, all that is required is to use the IN keyword in the WHERE clause of the query that will be a dataset in the report. SSRS, in the case of multivalued parameters used in this way, will rewrite the query for you at runtime based on the selections you choose in the report. This is a straightforward and well-documented process. However, we like using stored procedures for reasons already covered, and thus we have to make special accommodations, which you will see.
To accurately demonstrate how to use a store procedure with multivalued parameters, which we will affectionately refer to as MVPs henceforth, let’s take a copy of the Employee Service Cost report with the assumption that you will redesign it to accept the Year and Month parameters as multivalues. To begin, you will have to first modify your base stored procedure. Previously, it was fine to evaluate the expression of your Year and Month parameters with the logic in Listing 6-3.
Listing 6-3. Logic to Evaluate Year and Month Parameters Without MVPs
1=Case

                When (@ServiceYear IS  NULL) then 1

                When (@ServiceYear IS  NOT NULL) AND @ServiceYear =

        Cast(DatePart(YYYY, ChargeServiceStartDate) as int)  then 1

        else 0

        End

AND

        1=Case

                When (@ServiceMonth is NULL)  then 1

                When (@ServiceMonth is NOT NULL) AND @ServiceMonth =

                Cast(DatePart(MM, ChargeServiceStartDate) as int) then 1

        else 0

        END
However, now that you will be using MVPs, NULL values are not acceptable. The value of NULL in your logic was to select all values. This precluded you from accepting more than one value. For example, if you had the years 2007, 2008, 2009, and 2010 as valid values, you could either select all the values by selecting NULL or select only one value to filter the data. You could not have selected 2008 and 2009. With multivalued parameters you can. The only way to effectively use MVPs is through the WHERE clause of the query or stored procedure, with parameters, that feeds the report data. You will have to take advantage of the IN clause of T-SQL to make the best use of MVPs. Unfortunately though, it is not as simple as modifying the stored procedure to say Where value IN (@MyParameter), because SQL does not evaluate the IN clause as a string when using a stored procedure parameter. We can best explain this with the following example which can be seen by opening up the EmployeeServiceCost_MVP.rdl report in Pro_SSRS project from the book source code.
Let’s say you make the Year and Month report parameters multivalued parameters. You can do this quite simply by checking the Allow Multiple Values box in the Report Parameter Properties window, as shown in Figure 6-30. Notice also that the Allow Null Value checkbox is unchecked. The Allow Null Value option cannot be checked if you want MVPs to work.

If you were to execute the report now, you would see, as you did in the previous example using a dataset to populate the available values, that you are able to select one or more or all values for the year and month options, as shown in Figure 6-31.
Because the values for the MVP will be returned as a string—taking the year, for example, as “2007,2008”—this will not work with the stored procedure logic that you have defined. You will need to modify the stored procedure to use the IN clause so that the value will be equivalent to the following expression:
WHERE 1 = CASE WHEN CAST(DATEPART(YYYY, ChargeServiceStartDate) AS VARCHAR((20)) IN (@Year)

END
The problem here is that the variable @Year will be evaluated as a string and not an integer as it is defined in the stored procedure. If you were to select a single value—2007, for example—this would be fine because SQL would correctly evaluate the single value within the IN clause. However, when multiple values or Select All is chosen, SSRS passes a string such as “2007,2008,2009,2010”. When evaluated within the stored procedure, the query will fail. You need to first change the datatype of Year and Month to be a character or string value. So, you will choose varchar(20) for your stored procedure and parse out the values as they are passed in. Using varchar(20) will allow you to select a wide enough range to cover the Year and Month value strings.
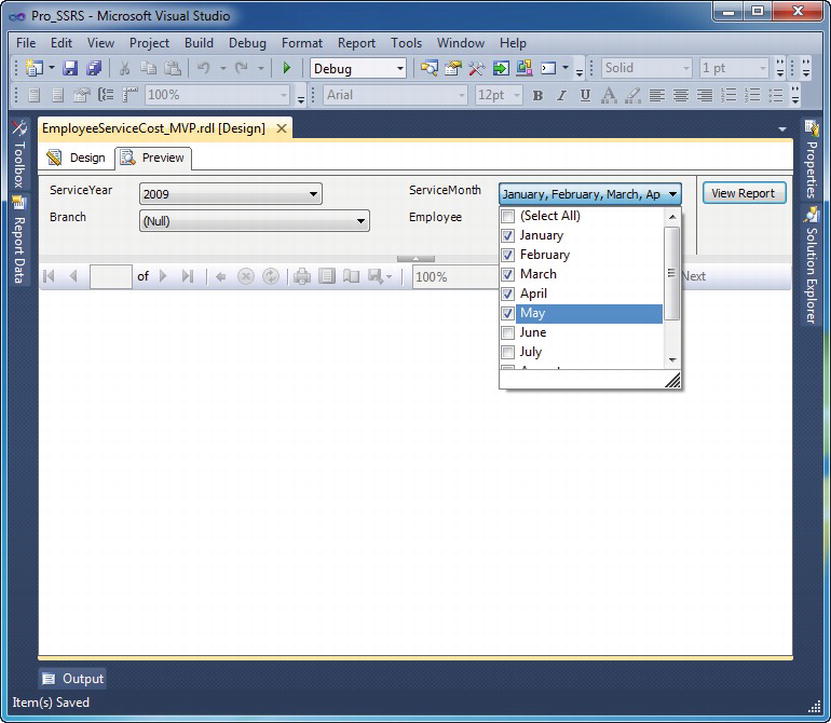
Figure 6-31. Multiple parameter selection
You also have to decide the best way to parse the string as it is returned from the report, both for performance and versatility. You have two effective methods for doing this, either dynamic SQL or a UDF. Creating dynamic SQL, which is essentially building a variable SQL expression using variables defined by user input, is cumbersome and syntactically challenging. Wrapping SQL statements within quotes and programmatically concatenating variables is time-consuming and often frustrating, and yields unpredictable results. What is worse is that it opens itself up to SQL injection hacks where users can interject values as strings that may execute statements that the developer did not intend. The best way to handle string values for MVPs is through a UDF that parses the individual values and feeds these into the IN clause of the query. Knowing that the values will always be returned in a comma-separated string makes loading the values into an accessible table much easier, by using a function designed for this purpose. This type of function is called a table-valued function, because the parsed rows of the input string are loaded into a table that can then be referenced as a subquery in the calling stored procedure. Let’s take a look at a parsing function that you will use in your stored procedure while working with MVPs. Listing 6-4 defines the UDF called fn_MVParam. This function is in the Pro_SSRS database that you have been using.
Listing 6-4. fn_MVParam, String-Parsing Function
CREATE FUNCTION dbo.fn_MVParam(@RepParam nvarchar(4000), @Delim char(1)= ',')

RETURNS @Values TABLE (Param nvarchar(4000))AS

    BEGIN

    DECLARE @chrind INT

    DECLARE @Piece nvarchar(4000)

    SELECT @chrind = 1

    WHILE @chrind > 0

        BEGIN

            SELECT @chrind = CHARINDEX(@Delim,@RepParam)

            IF @chrind  > 0

                SELECT @Piece = LEFT(@RepParam,@chrind - 1)

            ELSE

                SELECT @Piece = @RepParam

            INSERT  @Values(Param) VALUES(@Piece)

            SELECT @RepParam = RIGHT(@RepParam,LEN(@RepParam) - @chrind)

            IF LEN(@RepParam) = 0 BREAK

    END

    RETURN

END
This function, when called from your Emp_Svc_Cost_MVP stored procedure, will return the parsed values from SSRS’s multivalued parameter selection and allow you to use this as criteria for selecting data to include in the report. The key point of this function is that it uses several T-SQL functions itself, such as CHARINDEX, LEN, and LEFT, to populate the @Values table with the individual items from your report parameter string. The modification to the base Emp_Svc_Cost stored procedure shown in Listing 6-5 will be required to make the Emp_Svc_Cost_MVP stored procedure effectively work with the MVPs.
Listing 6-5. Modification to WHERE Clause for MVP
1 = CASE WHEN CAST(DATEPART(YYYY, ChargeServiceStartDate) AS VARCHAR(20)) IN

        (SELECT [PARAM] FROM fn_MVParam(@ServiceYear, ',')) THEN 1

    ELSE 0

    END

AND

1 = CASE WHEN CAST(DATEPART(MM, ChargeServiceStartDate) AS VARCHAR(20)) IN

        (SELECT [PARAM] FROM fn_MVParam(@ServiceMonth, ',' )) THEN 1

    ELSE 0

    END
Notice that instead of saying IN (@Year), for example, which will not work, you are calling your function fn_MVParam. The function takes two values: the string and the delimiter. In this case, you are using a comma as the delimiter.
When the report is run and the new function is called, you can see that you can select one, two, any combination, or all values from the populated drop-down, and you know that your stored procedure will effectively handle the parsing, evaluating, and criteria to deliver only the data that you want to see in the report, as shown in Figure 6-32.

Figure 6-32. Report generated with multiple selection criteria
The completed report for multivalued parameters in the Pro_SSRS project is called EmployeeServiceCost_MVP.rdl.
Applying a Filter
You might recall from Chapter 2 that you enhanced the performance of your stored procedure, Emp_Svc_Cost, by removing the criteria that looked only at visits. You will now apply a filter to the report to take the place of the original query criteria so that only visits will be displayed.
You can use filters to exclude values from a report after the results have been returned by the query. Filters, in that sense, will prevent a re-query; however, the full dataset will be returned to the report. In the example in Chapter 2, you knew that a limited number of excess rows would be returned. You should use filters when a query parameter is not supported by the data provider or with report snapshots. You should also use filters in reports that address a specific request or solution, and that are based on the same stored procedure as other reports, because you can use filters without modifying an existing stored procedure. Here is a simple filter expression applied to the Table data region of your report that will exclude any rows that are not visits:
=Fields!ServiceTypeID.Value = "V"
To add the filter expression, on the Layout tab, right-click the upper-left section of the table, and select Tablix Properties. On the Filters tab, enter the previous expression so that it looks like Figure 6-33. Add the filter to the EmployeeServiceCost_MVP.rdl report included in the Pro_SSRS project from the book source code.
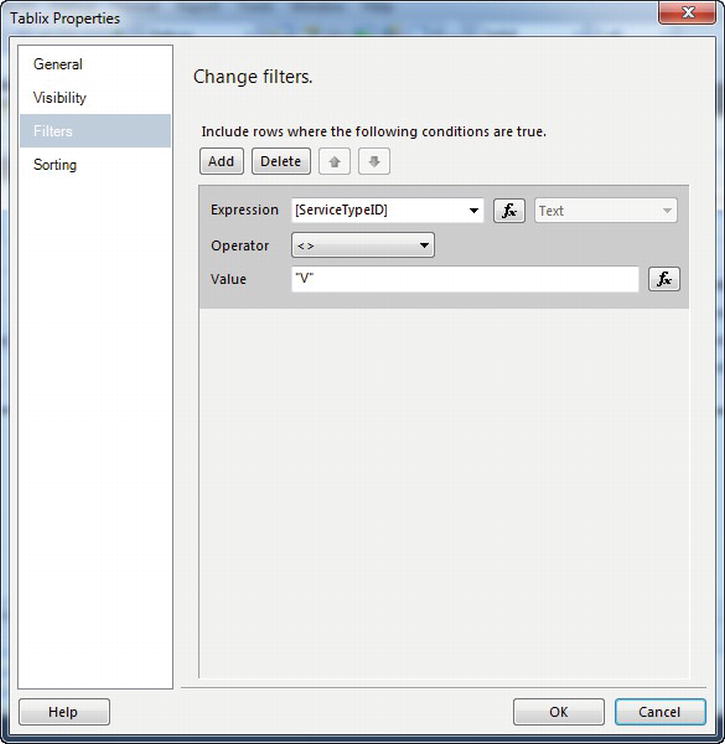
Figure 6-33. Filter dialog box to exclude non-visits
The completed report with a filter applied to a Tablix data region in the Pro_SSRS project is called EmployeeServiceCost_MVP_Filter.rdl.
Adding a Chart
SSRS provides a Chart data region that has a style similar to Microsoft Excel. Charts can be scoped within the current dataset or can use their own dataset. For this example, you will add a stacked bar chart to the beginning of the report that will show the top ten diagnoses and a count of the number of services for each diagnosis. This will essentially mirror the data provided in the report thus far. This report is now also grouped by Branch, which will automatically separate the values in the Branch group you have defined. You will want to emulate this for your chart. You have only three branches in this particular dataset, so the result should be in line with the details of the report. Open the EmployeeServiceCost_MVP_Chart_Start.rdl report found in the Pro_SSRS project and follow these steps to add the chart to the report:
- On the Design tab, click and drag the table you have already defined to make room for the chart.
- Click and drag the Chart data region to an area above the table.
- Right-click anywhere on the chart, select Change Chart Type, and in the Bar area select Stacked Bar.
- Using the Chart_DS dataset already defined for your report; drag the DiagVisits to the Values area of the chart.
- Drag the Diagnosis field to the Category Groups area of the chart.
- Drag the Patient_Count field to the Values area underneath the DiagVisits series of the chart.
- Resize the chart so that it aligns with the table below it. You can select both report elements, and on the toolbar select the Make Same Width icon.
- Right click on the Diagnosis Category Group and then click on the Filters tab. Click the Add button to add a filter to the category group. Because you want to make the report show only the top ten diagnoses, you need to add a filter to this grouping. You will use the Top N operator to make this happen, as shown in Figure 6-34, based on the top ten diagnoses by a sum of the Diagnosis visit count. While you’re in the Diagnosis Category Group properties, click on the Sorting tab. Change the default sort by to the expression =SUM(Fields!DiagVisits.Value) and select A to Z for the sort order.
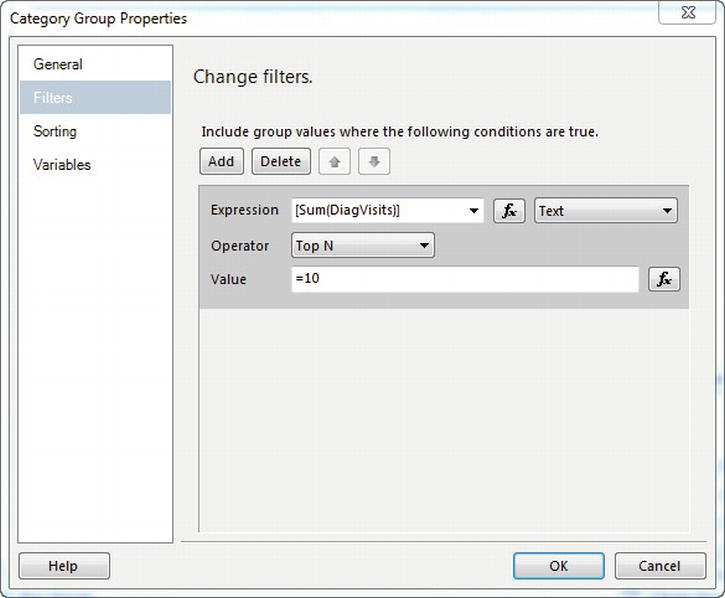
Figure 6-34. Filter value for top ten diagnoses
Finally, you can preview the report. Sometimes a report needs a chart up front for a quick view of the data prior to analyzing the details. Someone perusing this report might find it interesting that the chart shows, for example, that the Physical Therapy NEC diagnosis seems to be more prolific in the Nested Valley branch. This initial preview might warrant more investigation, which can be gleaned from the details in the report.
When previewed, the report should look like Figure 6-35.

Figure 6-35. Employee Service Cost report with a chart
The Chart data region has many properties that you can apply, as covered in Chapter 5; however, the appearance of the stacked bar is suitable for your report and can be deployed as is. Nevertheless, with a few slight tweaks like removing the chart title, axis titles, and choosing the Default color scheme, the final report starts to take on a cleaner look and feel. The completed report with a filter applied to a Chart data region in the Pro_SSRS project is called EmployeeServiceCost_MVP_Chart.rdl.
Adding Tablix Elements
SSRS 2008 introduced a significant change in report design by way of the Tablix data region. Essentially, the Tablix, as covered in detail in Chapter 4, combines aspects of the Table and Matrix data regions. The Table region available in SSRS 2005 worked well with row data of variable length based on the dataset. In turn, the Matrix data region included support for a variable number of columns. Reporting Services 2008 allowed use of either control to include custom row or column groupings anywhere in the report. As you will see in the subsequent addition to the Employee Service Cost report, adding column groupings to a table data region is straightforward.
In the section “Configuring Report and Group Variables” that follows, you will add a column grouping to the EmployeeServiceCost_Tablix_Start report using the Year field. The Year field, as you may recall, indicates what year the types of services were rendered for the patients. So far in the report, you have a distinct patient and employee count as well as estimated cost and visit count. So, what if you wanted to see each of these values grouped by the year of service for multiple years?
You will perform the following actions to add a column group for the Year to the Employee Service Cost report:
- Right-click the [CountDistinct(PatID)] cell in the table and select Add Group and then Parent Group under the Column Group section.
- In the Group by Expression field, select [Year]. Do not check the Add Group Header or Add Group Footer button. Click OK.
- Since we want to have groups that are independent of one another, we now need to add what is called an Adjacent Group. On the new [Year] field that we just created (which should be just above the No of Patients label), right-click and select Add Group and then Adjacent Right. Group on the [Year], as you did in step 2. Click OK. This new column will hold all of the values in the No of Employees column that currently exists. In step 5, we will shift all of the values to be underneath the new [Year] columns.
- Perform step 3 two more times, each time using the right-most [Year] field.
- Now that we have three columns that just have the [Year] in the column groupings, we need to move our existing values underneath of them. At this point, the design surface should look like Figure 6-36. Next select all of the fields from the No of Employees, Estimated Cost, and Service Count columns. Be sure to select the header text too! Then cut and paste the values from their original cells into the three empty columns under our new Adjacent Groups that we created in steps 2 and 3.
- The three columns on the right are no longer needed. Delete them by right-clicking the column and choosing Delete Columns. You can select all three of them by holding the CTRL key as you select them.
- Finally, adjust the widths of the columns with enough room to show the labels as shown in Figure 6-37.
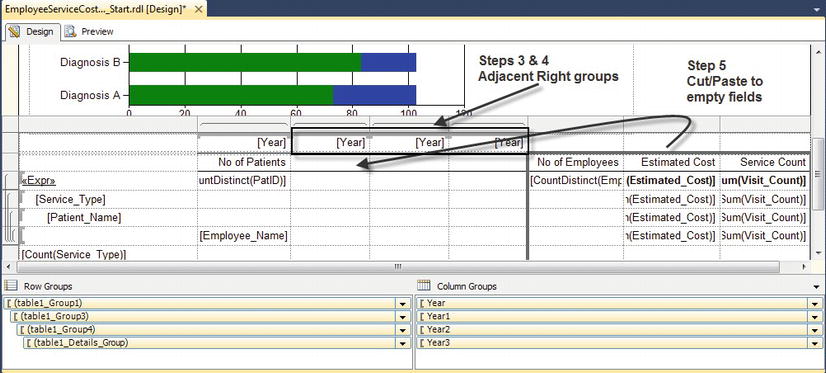
Figure 6-36. Design layout for before moving fields over
When you are finished, the report should resemble Figure 6-37 on the Design tab. You can also see the visual cues of the groupings, both row and column on the table as well as the Row Groups and Column Groups regions, of which you now have four groups for each. The completed report with Column Groups applied in the Tablix data region in the Pro_SSRS project is called EmployeeServiceCost_Tablix.rdl.
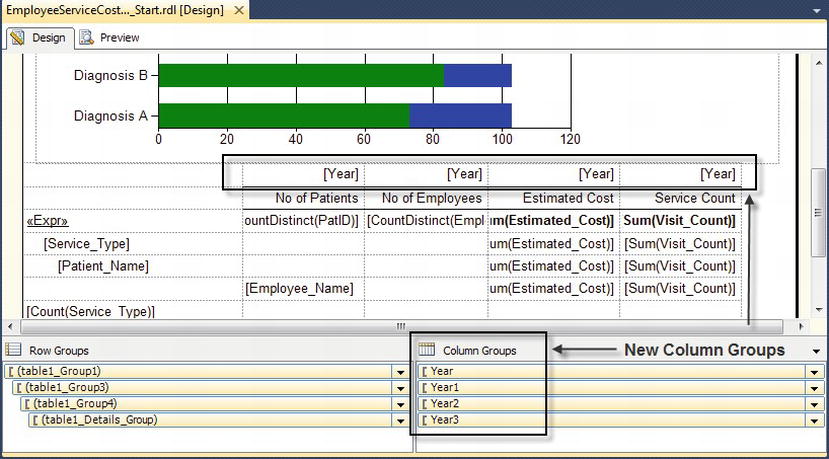
Figure 6-37. Design layout for column groupings
When you preview the report and select multiple years, as in Figure 6-38 where years 2009 and 2010 and all months are selected, you can see the column groupings automatically expand horizontally and group the values accordingly. For example, there are 75 Home Health Aide visits in 2009 for Congestive Heart Failure and only 16 visits in 2010 for the months selected.

Figure 6-38. Preview of Employee Service Cost report with column groupings
Configuring Report and Group Variables
SSRS has implemented global variables since its initial release in SQL 2000. These variables, such as ExecutionTime and UserID, can be used in reports. For example, the expression =Globals!ExecutionTime returns the time at which the report was executed. This value, unlike that returned by the expression Now(), does not change after the report is rendered, so paging through the report will not change the value of the global variable.
SSRS 2008 introduced two new types of variables—report variables and group variables— that can be configured at design or runtime to be static throughout report execution and viewing. You will use a report variable in this section to create a threshold for the Visit_Count field so that when the report is run, you can calculate whether the number of visits have met the report variable threshold. You will use the same variable again in the new SSRS Gauge control.
To configure a report variable, go into design mode, click Report Properties under the Report menu, and then select the Variables tab. You will need to add the report variable as in Figure 6-39. The threshold that you will set will be for the average number of visits per day. The method to derive this value is a simple calculation of a distinct count of the unique field Trx.ServicesTblID divided by a range of days, say 365 for a year. Our calculation for the Pro_SSRS database reveals an average of 44 daily visits for 2009. The next step, then, is to create a report variable that will hold this threshold value.
To set up a report variable, open up the EmployeeServiceCost_Variables_Start.rdl report from the Pro_SSRS project and go to the Design tab, click Report Properties under the Report menu, and click the Variables tab. Click Add and enter Threshold as the name of the variable, 44 as the value, and remove the check from Read-Only, as shown in Figure 6-39.
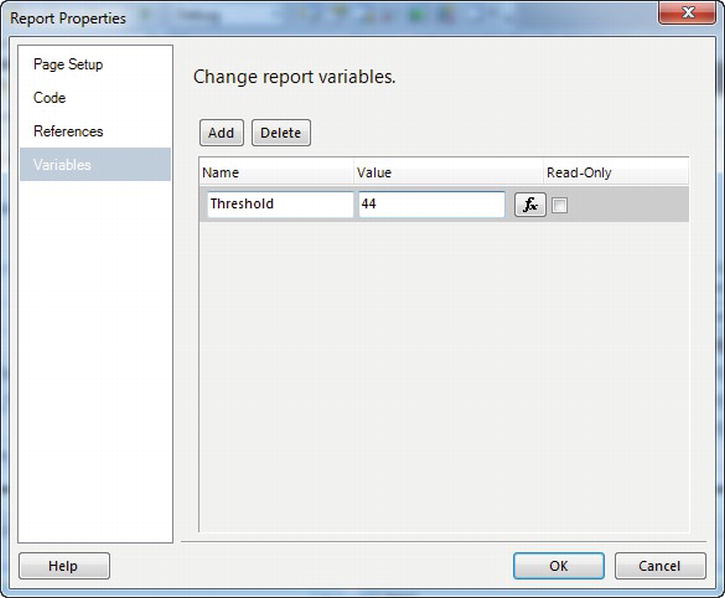
Figure 6-39. Adding a report variable
Like report variables, group variables can be configured for one or more row or column groups. They are useful for storing static values, such as differing tax values for products and product subcategories, or subgroups.
Adding the Gauge Control
Gauge controls are one of the most aesthetically appealing types and are useful for reports that focus on Key Performance Indicators (KPIs). Such reports are designed to be viewed in dashboard format for at-a-glance views of data, as you saw in Chapter5. In this section, we will combine the report variable we created in the previous section with one of these new controls to create a visual cue within the Employee Service Cost report. This report will show us how many visits have been made per day for the time period we are analyzing.
You can determine the average number of visits by a very simple calculation dividing the sum of the visit counts by a distinct count of the ChargeServiceStartDate field. You can perform that computation using the Emp_Svc_Cost_MVP stored procedure. This average number of visits value will become one of the two pointers in the gauge control, which will be the multiple bar gauge. The other pointer in the control will hold the threshold value of 44.
To begin, drag a Gauge control from the Toolbox onto the report to the right of the chart. Just make sure it is inside the Rectangle. Select the Multiple Bar Pointers gauge. There will be three bars by default. You will only use two of the bars for this report, LinearPointer1 and LinearPointer2. Go ahead and delete the small one (LinearPointer3) by right-clicking it and choosing to Delete Pointer. Assign the expression =Variables!Threshold.Value to LinearPointer1 by right-clicking the pointer and selecting Pointer Properties. In the Properties window, assign the variable expression value as shown in Figure 6-40.
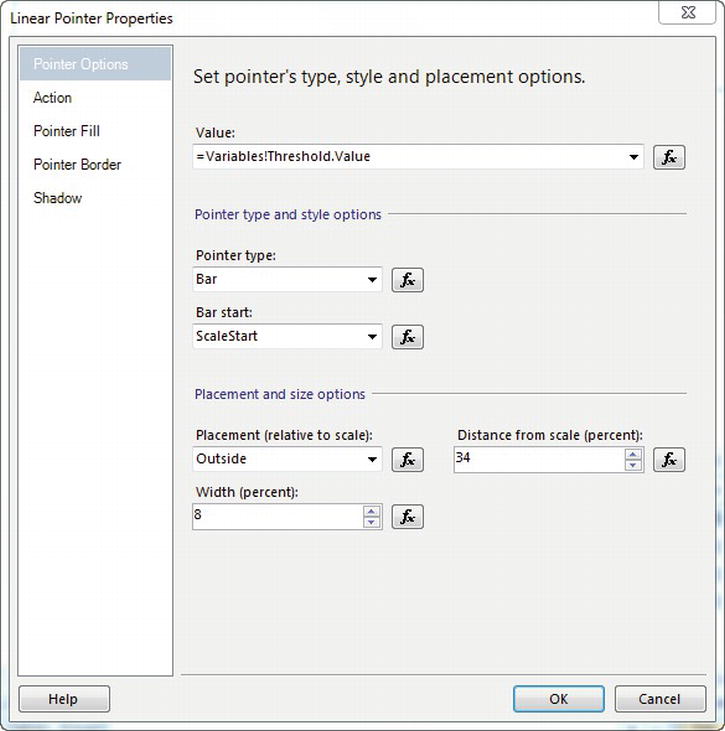
Figure 6-40. Assigning a report variable value to the gauge pointer
Next, assign the expression to determine the average number of visits for the time frame selected from the parameters to LinearPointer2. Because the multivalued parameters are query parameters, you know that the data in the report will be limited to the values selected from the Month and Year parameters. This would not be the case if you were using report parameters and subsequently filtering the data within the report. Knowing, for example, that the number of days over which to calculate the average will change based on the Month and Year parameter values selected makes it easy to do the calculation for LinearPointer2. You can write that calculation as
=SUM(Fields!Visit_Count.Value) / CountDistinct(Fields!ChargeServiceStartDate.Value)
Your final step is to set the color coding for the pointer such that the pointer will show red for 44 and under, and green for over 44. Right-click on LinearPointer2 and select the Pointer Properties option. Next, click the Pointer Fill tab. Click the Expression button to the right of the secondary color, enter the following expression, and click OK:
=IIF(Sum(Fields!Visit_Count.Value) / CountDistinct(DAY(Fields!ChargeServiceStartDate.Value) &

YEAR(Fields!ChargeServiceStartDate.Value)) < Variables!Threshold.Value, "Red", "Green")
The final view of the report in Figure 6-41 has the parameter value for ServiceYear of 2009 and 2010 selected. You can see that the threshold has been met for the year and month values selected. The completed report with all the final touches can be seen in the Pro_SSRS project is called EmployeeServiceCost_Variables.rdl.
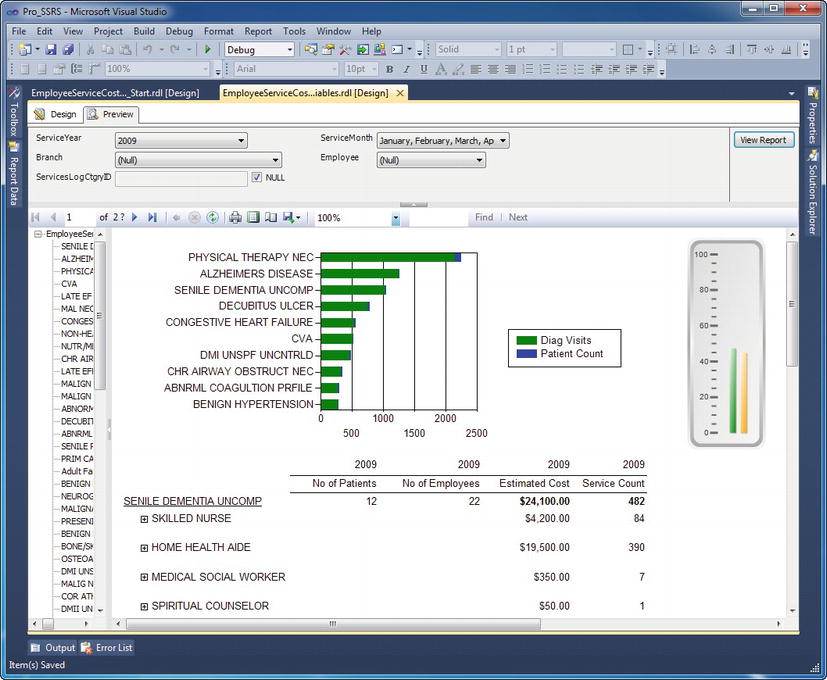
Figure 6-41. Final view of the report with the gauge control
Adding the Final Touches
In many projects, the final touches can be quite time-consuming. You now have the Employee Service Cost report to the point where it is functioning the way you expect and has had formatting applied to some extent during development. You have only a few final elements to apply before you call the report complete and before it’s ready to deploy to your SSRS Web server for production:
- Adding a page header and footer
- Adding a report title
- Adding page numbers
- Adding the report execution time
To add a page header and footer to the report, select the Report menu and then Add Page Header and Add Page Footer. This will add the two new sections to the report where you will add the values that will print on every page.
In the Toolbox, you’ll see two report items, a textbox and a line, that you can use in the page header and footer sections. First drag two textboxes to the header and one to the footer. Then align one of the header textboxes to be the same width as the table, enter your report title as Employee Service Cost by Diagnosis, change the font size to 16 points, and apply bold formatting. Next, drag a line into the header section, and position it between the chart and the report title textbox you just created.
In the second textbox in the header section, add the following expression based on global parameters as defined in the Edit Expression window:
="Page " & Globals!PageNumber & " of " & Globals!TotalPages
Finally, in the textbox in the footer, add the following expression for the report execution time:
=Globals!ExecutionTime
You are now ready to preview your report one last time before you deploy it to your users. This time, let’s take a look at the final version in the browser (see Figure 6-42). This is what the report will look like when it has been deployed to the Web server. (We will discuss methods for deploying reports in Chapter 8). After previewing the report, scroll down to the bottom of the report to see the report execution time in the footer. The completed report with all the final touches can be seen in the Pro_SSRS project is called EmployeeServiceCost_Final.rdl.
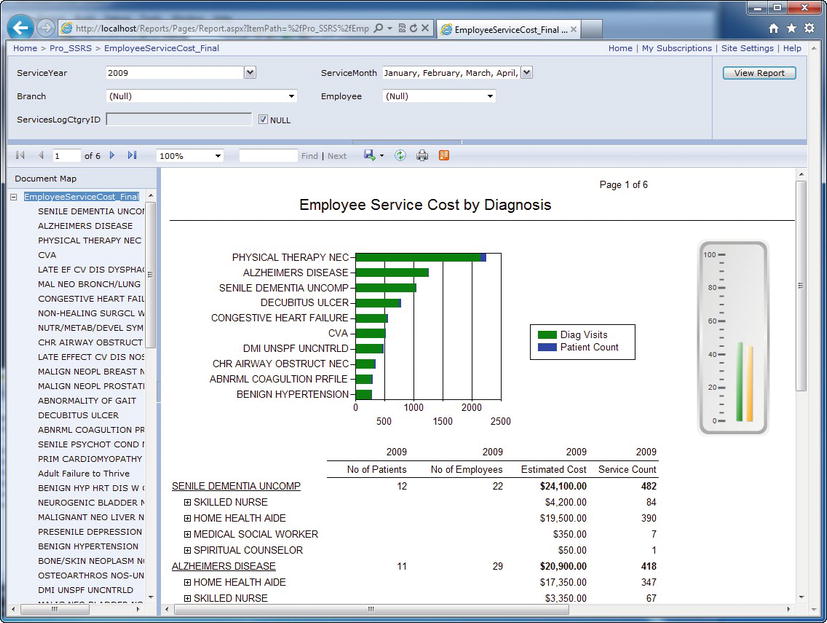
Figure 6-42. Report rendered in the browser
Summary
It seems as if we have covered much ground in the actual design of a reporting solution with SSRS. However, at the same time, we have only scratched the surface of getting to the raw power and flexibility of SSRS. We have yet to show how to interweave custom assemblies to perform specific functions that go beyond basic expressions. You will also be working with other data regions in other parts of the book that we have not touched on here. Additionally, you have been working with only a small number of reports in this chapter; often in a business, especially when facing migrating existing reports to SSRS, you will be working with many reports simultaneously. Deploying, administering, and securing these reports are going to become critical next steps.
Luckily, a robust and flexible design environment is only one component of SSRS. In the upcoming chapters, you will deploy, secure, and analyze the performance of the reports you are designing here, using a variety of methods.