This console delivers a wide variety of functions that can be used to monitor and manage the SOA composites through the entire lifecycle, once a service has been deployed. It can also be used to monitor performance of the server using several metrics.
In this section we will focus on showing how to:
- Monitor the health of the SOA infrastructure
- Monitor the performance of SOA composites
- Monitor composite instances
To monitor the health status of the different managed servers within a specific SOA WebLogic domain, follow these steps:
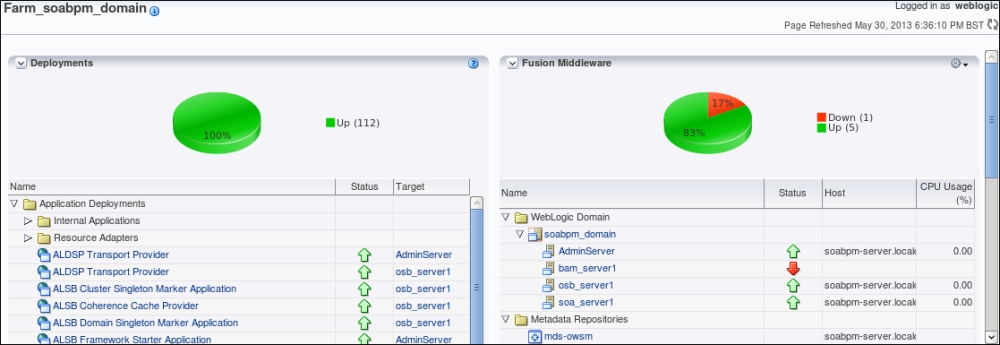
- Log in to Fusion Middleware Control with the WebLogic user from the URL:
http://<SOA admin server host>:<port>/em - On successful authentication, the landing page will show a dashboard of the SOA infrastructure components within that WebLogic domain. The dashboard on the left-hand side shows the health of the individual applications deployed on the servers, whereas the dashboard on the right-hand side shows the status of the managed servers supporting all SOA applications. In this example, the BAM managed server is down and therefore is shown with a red arrow:
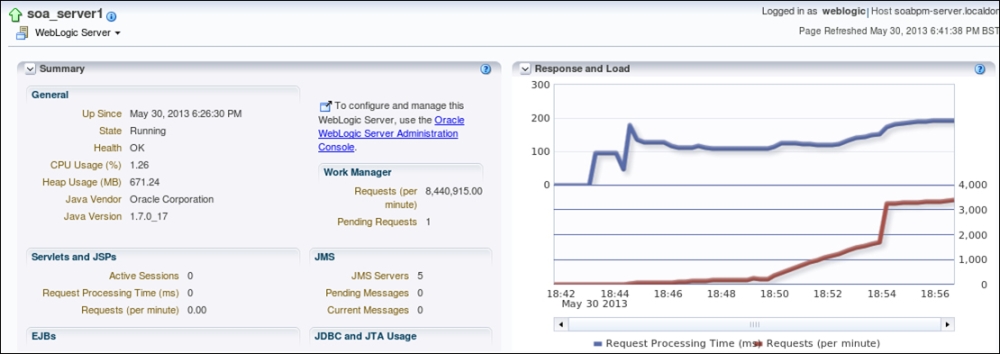
- Click on an individual application or server, to drill down into further levels of detail. For example, click on the soa_server1 link to see further details regarding this server's performance such as Request Processing Time (ms) or Requests (per minute):
Composite performance can also be monitored within Fusion Middleware Control. To do so:
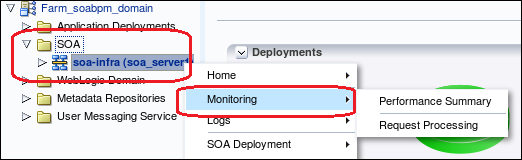
- From the main Farm menu, expand the SOA folder. Then right-click on the soa-infra item and select Monitoring, and then select either Performance Summary or Request Processing.
- If Performance Summary is selected, then a page with two main dashboards will appear. One displays the Total number of composites since server startup and the other shows the Total number of faults since server startup. To show more metrics in the graphs, the Metric Palette can be opened by clicking on the Show Metric Palette button. From the Metric Palette, it is possible to select a wide variety of metrics such as Composite Policies, Composite Instances among many others:

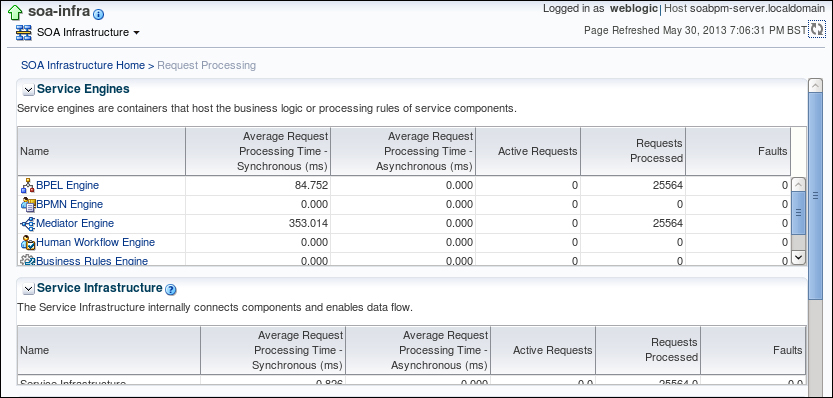
- If Request Processing is selected then a page with three main containers will appear, showing different statistics for the Service Engines (for example, BPEL, BPMN, and Mediator engines), Service Infrastructure, and Binding Components (for example, inbound and outbound services and JCA adapters).
SOA composite instances can also be monitored, visualized, searched, or managed from within Fusion Middleware Control. To do so:
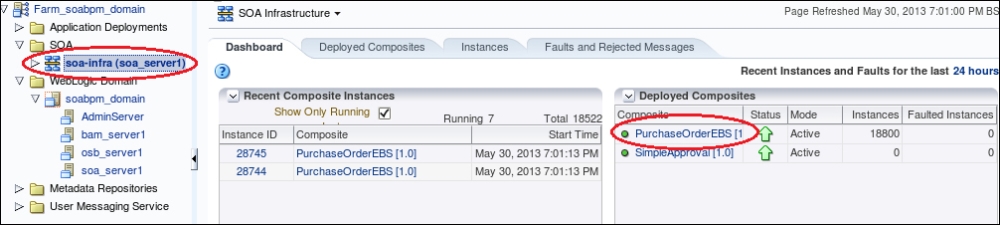
- Under the SOA folder, click on the soa-infra item. And then on the right-hand side container, select the Composite for which you wish to monitor the instances. Alternatively, you can click on the Instances tab to monitor all instances for all composites available in the SOA domain.
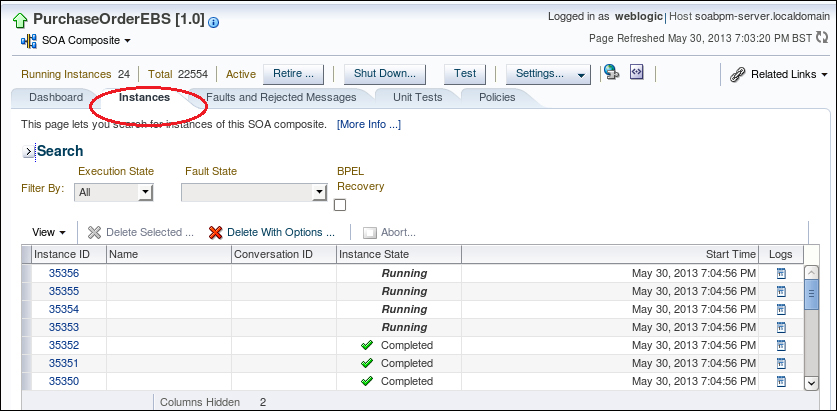
- If you click on an individual composite, then the composite main page will open showing the Dashboard tab. From this tab, a summary of recent and faulted instances is available. However, by clicking on the Instances tab, it is possible to conduct advanced searches on all available instances (and their state) for the composite, and based on specific criteria such as time, different IDs, and even composite name.
..................Content has been hidden....................
You can't read the all page of ebook, please click here login for view all page.