Up until this chapter, we have focused on planning, designing, implementing, and migrating to a Windows Server 2003 environment. This chapter looks at the logging and debugging tools available for Windows Server 2003 that help an organization identify and isolate problems in its networking environment.
Many of the tools identified in this chapter are similar to those used in a Windows 2000 or even a Windows NT4 environment; however, as with most features of the Windows server family of products, the features and functions of the tools have been improved and expanded in the Windows Server 2003 operating environment.
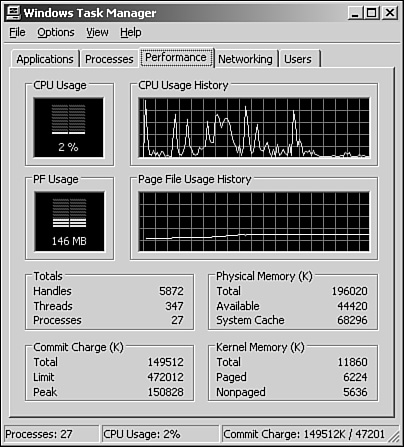
One of the monitoring tools available in Windows Server 2003 is the Task Manager. It provides an instant view of system resources such as processor activity, process activity, memory usage, and resource consumption. Rather than loading up special monitoring tools and utilities or creating extensive monitoring parameters, you can use the Task Manager to quickly (usually within seconds) and at a glance see the operational state of key network system parameters.
In addition to monitoring processor activity, process activity, memory usage, and resource consumption, the Windows Server 2003 Task Manager provides two additional monitoring components not included in the Task Manager in Windows 2000 server. These two additional components enable you to monitor networking and user activity.
The Windows Server 2003 Task Manager is very useful for an immediate view of system operations. It comes in handy when a user notes slow response time, system problems, or other nondescript problems with the network. With just a quick glance at the Task Manager, you can see whether a server is using all available disk, processor, memory, or networking resources.
There are three methods to launch the Task Manager:
Right-click the taskbar and select Task Manager.
Press Ctrl+Shift+Esc.
Press Ctrl+Alt+Del, and when the Windows Security dialog box launches, click Task Manager.
When the Task Manager loads, you will notice five tabs, as shown in Figure 34.1.
If you are working on other applications and want to hide the Task Manager, deselect Always on Top in the Task Manager’s Options menu. You can also keep the Task Manager off the taskbar when minimized by selecting Options, Hide When Minimized. The following sections provide a closer look at how helpful these components can be.
The first tab on the Task Manager is the Applications tab. The default view is the Details view, but you can change the view to large or small icons by selecting View, Large Icons or View, Small Icons, respectively.
The application view provides a list of tasks on the left pane and the status of the corresponding applications on the right pane. The status enables you to determine whether an application is running and allows you to terminate an application that is not responding or that you determine is in trouble or is causing trouble for your server. To stop such an application, highlight the particular application and click End Task at the bottom of the Task Manager. You can also switch to another application if you have several applications running. To do so, highlight the program and click Switch To at the bottom of the Task Manager.
The second Task Manager tab is the Processes tab. It provides a list of running processes on the server. It also measures the performance in simple data format. This information includes CPU percent used, memory allocated to each process, and username used in initiating a process, which includes system, local, and network services.
If the initial analysis of the process on your server takes up too much CPU percentage or uses too many memory resources, thereby hindering server performance, you can sort the processes by clicking the CPU or Mem Usage column header. The processes are then sorted in order of usage. This way, you can tell which one is slowing down performance on your server. You can terminate a process by selecting the process and clicking the End Process button.
Tip
A command-line tool located in the Windows Server 2003 Resource Kit called the Process Resource Monitor (PMon) can also be used to monitor system and application processes.
Several other performance or process measures can be removed or added to the processes view. They include PID (process identifier), CPU time, virtual memory size, session ID, page faults, and so on. To add these measures, select View, Select Columns to open the Select Column property page. Here, you can add process counters to or remove them from the process list.
The Performance tab allows you to view the CPU and page file usage in graphical form. This information is especially useful when you need a quick view of a performance bottleneck.
The Performance tab makes it possible to graph a percentage of processor time in Kernel mode. To show this, select View, Show Kernel Times. The kernel time is represented by the red line in the graph. The kernel time is the measure of time that applications are using operating system services. The other processor time is known as User mode. User mode processor time is spent in threads that are spawned by applications on the system.
If your server has multiple CPU processors installed, you can view multiple CPU graphs at a time by selecting View, CPU History.
The Networking tab provides a measurement of the network traffic for the connections on the local server in graphical form, as shown in Figure 34.2.

For a multiple network connection—whether it is a dial-up LAN connection, WAN connection, VPN connection, or the like—the Networking tab displays a graphical comparison of the traffic for each connection. It provides a quick overview of the adapter, network utilization, link speed, and state of your connection.
To show a visible line on the graph for network traffic on any interface, the view automatically scales to magnify the view of traffic versus available bandwidth. The graph scales from 0% to 100% if the Auto Scale option is not enabled. The greater the percentage shown on the graph, the less is the magnified view of the current traffic. To auto-scale and capture network traffic, select Options, Auto Scale.
The Networking tab serves as a quick reference for measuring network bandwidth. It can be used to quickly determine whether a network interface has excessive traffic or to find out the communications status of a network connection.
You can add more column headings by selecting View, Select Columns. Various network measures can be added or removed; they include Bytes Throughput, Bytes Sent/Interval, Unicasts Sent and Received, and so on.
Tip
If you suspect a possible network server problem, launch the Task Manager and quickly glance at the CPU utilization, memory available, process utilization, and network utilization information. When the utilization of any or all of these items exceeds 60% to 70%, there may be a bottleneck or overutilization of the resource. However, if all the utilization information shows demand being less than 5%, the problem is probably not related to server operations.
The Users tab displays a list of users who can access the server, session status, and names. The following five columns are available on the Users tab:
User—. Shows the users logged on to the server. To obtain a detailed view showing from which computer the user is connected, highlight the user and select Options, Show Full Account Name.
ID—. Displays the numeric ID that identifies the session on the server.
Client Name—. Specifies the name of the client computer using the session, if applicable.
Status—. Displays the current status of a session. Sessions can be either Active or Disconnected.
Session—. Displays the session names on the server.
The Event Viewer is the next tool to use when debugging, problem-solving, or logging information to resolve a problem with a network server. The Event Viewer, shown in Figure 34.3, is a built-in Windows Server 2003 tool that is used for error analysis and diagnostics.
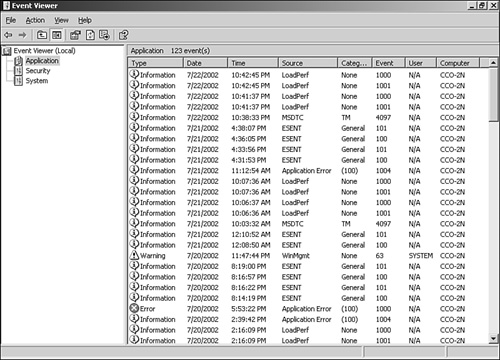
Microsoft defines an event as any significant occurrence in the operating system or an application that requires tracking of the information. An event is not always negative because a successful logon to the network, a successful transfer of messages, or replication of data can also generate an event in Windows. It is important to sift through the events to determine which are informational events and which are critical events that require attention.
When server failures occur, the Event Viewer is one of the first places to check for information. The Event Viewer can be used to monitor, track, view, and audit security of your server and network. It is used to track information of both hardware and software contained in your server. The information provided in the Event Viewer can be a good starting point to identify and track down a root cause to system errors.
Note
A Windows Server 2003 system has event logs for system, security, and applications. On a domain controller, the Event Viewer also includes directory services, domain name system (DNS), and File Replication Services (FRS) logs. Depending on other applications loaded or running on a server, additional event logs may be added to the managed logs of the Event Viewer utility.
You can access the Event Viewer through the Administrative Tools menu or by right-clicking the My Computer icon on the desktop and selecting Manage. You can also launch the Event Viewer by running the Microsoft Management Console (File, Run, mmc.exe) or through a command line by running eventvwr.msc.
As noted previously, events can range in importance from simple informational data to serious or catastrophic events such as transport protocol or major system failures. The primary types of events include success audit, failure audit, informational, warning, and error. An icon in Event Viewer identifies the severity of each type of event.
The console tree on the left pane of the Event Viewer window lists the logs available to view, and the details pane on the right side of the window displays the events. Click a log to view the events associated with it on the details pane. When you’re viewing a log, the Event Viewer displays the current information for the log. While you view the log, the information is not updated unless you refresh the Event Viewer. If you switch to another log and then return to the previous log, the previous log is automatically updated.
Each log has common properties associated with its events:
Type—. This property defines the severity of the event. An icon appears next to each type of event. It helps to quickly identify whether the event is informational, a warning, or an error.
Date—. This property indicates the date that the event occurred. You can sort events by date by clicking the Date column. This information is particularly helpful in tracing back an incident that occurred in the past, such as a hardware upgrade before your server started experiencing problems.
Time—. This property indicates the time that the event occurred. It can be used the same as the date.
Source—. This property identifies the source of the event, which can be an application, remote access, a service, and so on. The source is very useful in determining what caused the event.
Category—. This property determines the category of an event. An example is the Security category, which includes Logon/Logoff, System, Object Access, and others.
Event—. Each event has an associated Event ID, which is a numeral generated by the source and is unique to each event. You can use the Event ID on the Microsoft Support Web site (http://www.microsoft.com/technet/) to find topics and solutions related to an event on your server.
User—. This property identifies the user that caused the event to occur. User does not necessarily mean the person logged on to the server. Examples of user events in the Security log are System, Local Service, Network Service, and so on.
Computer—. This property identifies the computer that caused the event to occur.
To view more comprehensive details of events, click the log event in the console tree and double-click the event to view in the details pane (or select it and press Enter). The Event Viewer opens a property page showing the properties of the event, as shown in the sample in Figure 34.4. The top portion includes general information about the event, such as date, time, user, source, and so on. The Description field gives a detailed description of the event and contains a URL to Microsoft. If you click the link, information relating to the event is sent to Microsoft over the Internet in the form of a query, which will help you get more detailed information. To view details about the previous or next event, click the up or down arrow. To copy the details of an event to the Clipboard, click the Document button. The bottom part of the property page shows additional data included with the event. The Data field includes characters in bytes (hexadecimal) or words format. It displays by default as bytes, but you can switch the characters to words by clicking the Words radio button.

You can search for a specific event by highlighting the log and selecting View, Find. In the resulting dialog box, you can search based on user, computer, event source, information, success audit, or any property or value stored in the event log. It is particularly useful to search for specific events, states in time, or other information when you have a large log and need to narrow in on information about a specific event or point in time.
Event Viewer enables you to connect to other computers on your network. To connect to another computer from the console tree, right-click Event Viewer (Local) and click Connect to Another Computer. Select Another Computer and then enter the name of the computer or browse to it and click OK. You must be logged in as an administrator or be a member of the Administrators group to view event logs on a remote computer. If the new computer requires a low-speed connection, right-click the log to be viewed and then click Properties. On the General tab, click Using a Low-Speed Connection.
By default, the Event Viewer displays all events for a selected log. Filtering is very useful when it becomes necessary to narrow down the view. It is helpful to be able to filter the view so that the Event Viewer shows events that meet specific criteria. To use a filter, select the log to be filtered and then select View, Filter. This will result in the property page shown in Figure 34.5.

Tip
Event Comb (EventCombMT), located in the Windows Server 2003 Resource Kit, can assist you with the task of combing through multiple event logs on domain controllers. More specifically, you can check and diagnose replication by using the utility to search for particular EventIDs related to replication. Another similar tool that can be used in conjunction with EventCombMT is the Checkrepl.vbs script, which can monitor replication for a specific domain controller.
Events can be filtered based on different fields. It is possible to filter based on event source, category, and date range. If you suspect you have an application or service causing a server malfunction, it is helpful to filter based on event source. From the Event Source pull-down menu on the System Properties page, select the category or select All (default) to filter all event sources. To filter events based on date, specify the date range and then enter the From and To fields based on the date range you want to view information.
To return to the default view, click Restore Defaults and click OK. Choose View, All Records to remove the filter and view all events in the log.
Note
Filtering changes only the view and has nothing to do with the actual contents of the log. All events are continuously logged whether or not filtering is turned on. If a log file from a filtered view is archived, all records are saved, even if you select a text format or comma-delimited text format file.
Occasionally, you need to archive an event log. Archiving a log copies the contents of the log to a file. Archiving is useful in creating benchmark records for the baseline of a server, or for storing a copy of the log that can be viewed or accessed elsewhere. When an event log is archived, it is saved in one of three forms:
Comma-delimited text file (.csv)—. This format allows the information to be used in a program such as Excel.
Text-file format (.txt)—. This format allows the information to be used in a program such as a word processing program.
Log file (.evt)—. This format allows the archived log to be viewed again in the Event Viewer.
The event description is saved in all archived logs. The sequence of data generated within each record is in this order: date, time, source, type, category, event, user, computer, and description. To archive, right-click the log to be archived and click Save Log File As. In the File Name field of the resulting property page, type in a name for the archived log file, choose a file type from the file format options of .csv, .txt, or .evt, and then click Save.
Logs archived in log-file format (.evt) can be reopened using the Event Viewer utility. Logs saved in log-file format retain the binary data for each event recorded. Event logs, by default, are stored on the server from which the Event Viewer utility is being run, but data can be archived to a remote server by simply providing a UNC path (such as \servername share) when entering a filename.
Logs archived in comma-delimited (.csv) or text (.txt) format can be reopened in other programs such as Microsoft Word or Microsoft Excel. Logs archived in text or commadelimited format do not retain the binary data.
Each event log has a property associated with it. This property can be used to customize each of the event logs. The property defines the general characteristics of the log in the Event Viewer, such as the appearance of the log in the Event Viewer, the log size, and what should happen when the maximum log size is reached.
To customize the event log, access the properties of the particular log by highlighting the log and selecting Action, Properties. Alternatively, you can right-click the log and select Properties to display the General tab of its property page, as shown in Figure 34.6.

The Log Size section specifies the maximum size of the log and the subsequent actions to be taken when the maximum log size limit is reached. The three options are
Overwrite Events as Needed
Overwrite Events Older Than X Days
Do Not Overwrite Events
If you select the Do Not Overwrite Events option, Windows Server 2003 will discontinue to log events when it fills up. Although Windows Server 2003 will notify you when the log is full, you will need to monitor and manually clear the log periodically so that new events can be tracked and stored in the log file. Log file sizes must be specified in multiples of 64KB. If a value is not in multiples of 64KB, the Event Viewer will automatically set the log file size to a multiple of 64KB.
When you need to clear the event—for example, when the log is full—click Clear Log in the lower right of the property page. If you need to reset the logging information to defaults, click Restore Defaults to reset the log-tracking information.
If a remote server is being monitored and is connected using a low-speed connection, check the Using a Low-Speed Connection box. Using a low-speed connection prevents the Event Viewer from downloading all event data before it is requested. This feature is useful when you’re working with logs on a remote server with a slow connection such as dial-up or over a slow WAN connection.
Logging an accurate and wide range of security events in the Event Viewer requires an understanding of auditing in Windows Server 2003. It is important to know that events are not audited by default. Through auditing, which is enabled in the local security policy for a local server, domain controller security policy for a domain controller machine, or an Active Directory (AD) Group Policy Object (GPO) for a domain, you can track Windows Server 2003 security events. It is possible to specify that an audit entry be written to the security event log whenever certain actions are carried out or an object (such as a file or printer) in AD is accessed. The audit entry shows the action carried out, the user responsible for the action, and the date and time of the action. Successful and failed attempts at actions can be audited so that the audit trail shows the user or users who performed certain actions on the network or user or users who attempted to perform certain actions that are not permitted.
For a domain, the types of system events audited through Group Policies can be specified by navigating to Computer ConfigurationWindows SettingsSecurity SettingsLocal PoliciesAudit Policy in the Group Policy Object Editor and double-clicking an event category that needs to be changed in the details pane. If you’re defining the audit policy settings for an event category for the first time, check the Define These Policy Settings box. Then do one or both of the following and click OK:
To audit successful attempts, check the Success box.
To audit unsuccessful attempts, check the Failure box.
The default auditing policy setting for domain controllers is No Auditing. This means that even if auditing is enabled for a domain, it does not necessarily imply that auditing has been enabled for the domain controller because domain controllers do not inherit auditing policy locally. To enable auditing on domain controllers, use the domain controller security policy.
The following examples describe how to set up auditing for some objects on a domain, site, or organizational unit (OU) using the Group Policy Object Editor (Computer ConfigurationWindows SettingsSecurity Settings):
Registry keys—. Highlight the Registry in the console pane, right-click Registry, and then click Add Key. Browse to locate the key you want to edit and click OK. To modify a Registry key that has already been added to a GPO, right-click the Registry key, click Properties, and click Edit Security.
System services—. Highlight the particular service you want. Right-click the service and select Properties. If it is not already selected, check the Define This Policy Setting box and then select the appropriate setting. Then click Edit Security.
Files or folders—. Right-click File System and then click Add File. Browse to the specific file and click OK. To modify auditing on a file or folder already in this GPO, in the details pane, right-click the file or folder and then click Edit Security.
If security logging is crucial in the organization, you can choose to shut down the server immediately if logging is unable to save a security event to the log file. This security policy can be located in Computer ConfigurationWindows SettingsSecurity Settings Local PoliciesSecurity options. Enabling this security setting causes the system to stop if a security audit cannot be logged.
A typical reason for an event failing to be logged is that the security audit log is full and the retention method specified in the log general properties is Do Not Overwrite Events. When this situation arises, the following stop error appears:
STOP: C0000244 {Audit Failed}.
An attempt to generate a security audit failed.
To bring the system back online after an automatic security event–induced shutdown, turn the server back on, log in as an administrator, and clear or archive the log.
Note
In severe situations, an organization may choose to have servers automatically shut down when a security breach or event occurs. However, it is important to note that a server shutdown in the middle of the day can affect all users on the network who were connected to the shut-down server, so care must be taken in selecting the applicable security policy and automated process appropriate for the organization. Also, if the sole purpose of the attack is to deny service, it will be a success if the server shuts down automatically.
System monitoring is a crucial aspect of the overall availability and health of the network. For maximum uptime, a process needs to be put in place to monitor and analyze system performance. This invariably provides a means of quickly comparing system performances at varying instances in time, and detecting and potentially preventing a catastrophic incident before it causes system downtime.
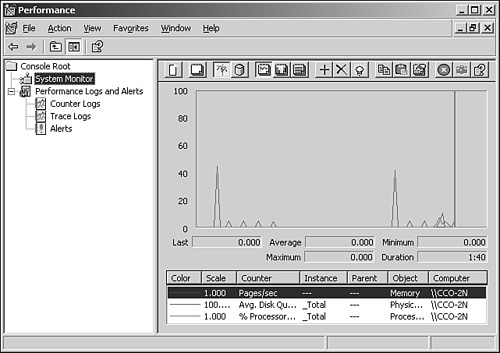
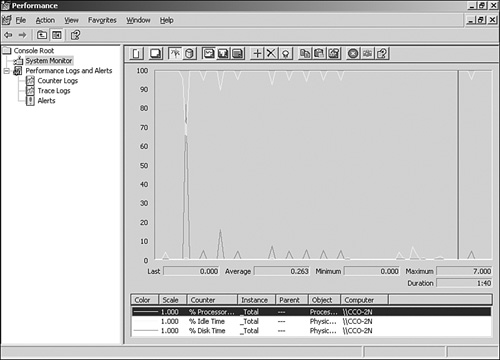
The System Monitor takes a snapshot of system performance characteristics at periodic intervals and displays the information in graphical format similar to that shown in Figure 34.7. The information can then be used to monitor the behavior of the system, predict future resource requirements, measure the load on system components, and also trigger an alert to inform you of potential failures of system components.
Windows Server 2003 monitors or analyzes memory, storage, networks, and other system resources and operations. It is not good enough to just monitor memory usage itself without knowing the components or functionality of software that is using the memory. For example, if 128MB of memory is used over a specified period of time, rather than knowing that 128MB of memory was used, it is more valuable knowing what used the memory and why that much was used.
Windows Server 2003 comes with two tools for performance monitoring: System Monitor and Performance Logs and Alerts. These two tools together provide performance analysis and information that can be used for bottleneck and troubleshooting analysis.
Defining some terms used in performance monitoring will help clarify the function of the System Monitor and how it ties in to software and system functionality. The three components noted in the System Monitor are as follows:
Object—. Components contained in a system are grouped into objects. Objects are grouped according to system functionality or association within the system. Objects can represent logical entities such as memory or a physical mechanism such as a hard disk drive. The number of objects available in a system depends on the configuration. For example, if Microsoft Exchange server is installed on a server, some objects pertaining to Microsoft Exchange would be available.
Counter—. Counters are subsets of objects. Counters typically provide more detailed information for an object, such as queue length or throughput for an object. The System Monitor can collect data through the counters, with data being collected and displayed in graphical or text log formats.
Instances—. If a server has more than one similar object, each one is considered an instance. For example, a server with multiple processors has individual counters for each instance of the processor. Counters with multiple instances also have an instance for the combined data collected for the instances.
You can open the Performance console from the Administrative Tools by selecting Start, Programs, Administrative Tools, Performance. You can also open it from a command line by typing Perfmon.msc. When a new Performance console is started, it loads a blank system monitor graph into the console. The Performance console contains two utilities: System Monitor and Performance Logs and Alerts.
The System Monitor provides an interface to allow the analysis of system data, research performance, and bottlenecks. The System Monitor displays performance counter output in graph, histogram (bar chart), and report format.
The histogram and graph view can be used to view multiple counters at the same time, as shown in Figure 34.8. However, each data point displays only a single value that is independent of its object. The report view is better for displaying multiple values. Data sources can be obtained by clicking the View Current Activity button on the button bar. On the other hand, clicking View Log Data displays data from completed or running logs.
The System Monitor is ideal for diagnostics and short-term views of performance output. Before counters can be displayed, they have to be added. The counters can be added simply by using the button bar. The Counter button on the button bar includes Add, Delete, and Highlight. You can use the Add Counter button to add new counters to be displayed. The Delete Counter button removes unwanted counters from the display. The Highlight button is helpful for highlighting a particular counter of interest; a counter is highlighted with a white or black color around the counter. The Highlight button cannot be used with Report view.
Tip
You can display the function of a button in the button bar by placing the mouse cursor on the button.
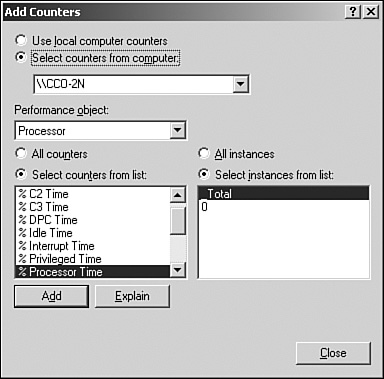
When the Add Counter button is selected, a dialog box similar to the one shown in Figure 34.9 appears. The top section of this property page allows you to either choose the server being worked on or connect to a different server on the network. The System Monitor allows you to connect to a remote computer and be able to monitor system performance of the server. This process is referred to as remote monitoring.
Tip
If a server stops responding, run the System Monitor from another computer to monitor the troubled server.
Performance objects and their associated counters can be added to the system monitoring tool to expand the level of detail being collected for the performance of a system. Select a counter and click the Add button to add it to the display. In the instance list box, the first value, Total, allows you to add all the instance values and report them in the display. When you need to understand what a counter does or learn more about it, select the counter and click the Explain button.
You can have more than one monitoring setup in more than one Performance console. The more counters and monitors you set up, the more your system’s resources are used to support the system monitoring tool operations. If you need to monitor a large number of system monitors and counters, it is better to redirect the output data to a log file and then read that log file in the display.
Back on the System Monitor display, you can update displays by clicking the Clear Display button. Clicking the Freeze Display button or pressing Ctrl+F freezes displays, which suspends data collection. Data collection can be resumed by pressing Ctrl+F or clicking the Freeze Display button again. Click the Update Data button to display an updated data analysis.
It is also possible to export and import a display by using the Cut and Paste buttons. For example, a display can be saved to the Clipboard and then imported into another instance of the System Monitor. This is commonly done to take system information and view or analyze that information on a different system rather than performing analysis on a production server.
The Properties page has five tabs: General, Source, Data, Graph, and Appearance. Generally, the Properties page gives access to settings that control the graph grid, color, style of display data, and so on. Data can be saved from the monitor in different ways. The easiest way to retain the display features when saved is to save the control as an HTML file. You can match lines in the display with their respective counters by selecting the color that matches the line in the display.
The System Monitor enables you to save log files in comma-separated (csv) or tab-separated (tsv) format, which you can then analyze by using third-party tools such as Seagate Crystal Reports. Alternatively, a comma-separated or tab-separated file can be imported into a spreadsheet or database application such as Microsoft Excel or Access. Windows Server 2003 also allows you to collect data in SQL database format, which is useful for performance analysis at an enterprise level rather than a per-server basis. Reports displayed in Excel can help you better understand the data as well as provide reports to management. After the log file is saved in .csv format, the file can be opened using Microsoft Excel.
The Performance Logs and Alerts utility has two types of performance-related logs: Counter logs and Trace logs. These logs are useful for advanced performance analysis and data logging over a period of time. The utility also comes with an alerting mechanism used to trigger alerts.
Some improvements have been added in Windows Server 2003 performance analyses that were not available in previous versions of Windows. One is the ability to run log collections under different accounts. For example, if you need to log data from a remote server that requires administrator privileges, the system will allow you to specify an account with the necessary permissions using the Run As feature. Another improvement to Windows Server 2003 is the ability to support log files greater than 1GB in size. Performance data can also be appended to an existing log file because of the new log file format.
Note
Data collection occurs regardless of whether a user is logged on to the server being monitored because logging runs as a service.
The three components to Performance Logs and Alerts are as follows:
Trace logs—. Trace logs collect event traces. They provide measurement of performance associated with events related to system and nonsystem providers. Data is sent to the logs immediately as an event occurs and is measured continuously in a stream from the beginning of an event to its end. This is different from the way the System Monitor measures data. The System Monitor measures data using sampling.
Counter logs—. Counter logs record sampled data about system services, threads, and hardware resources based on objects in the System Monitor. This utility uses counters the same way the System Monitor does.
Alerts—. Alerts provide a function used to define a counter value that will trigger an alert. When an alert is triggered, the alert function can be set up to perform some action, such as sending a network message, executing a program, or starting a log. Alerts are useful for notification purposes in times of emergency (unusual activity that does not occur often) such as bandwidth saturation to or from a network interface card (NIC) hosting a business-critical application. Alerts provide notification when a particular resource performance value exceeds or drops below a threshold, baseline, or set value.
Configuring and enabling Trace logs to monitor the activities of an application or environment variable is simply a matter of creating a Trace log filename and enabling logging.
To create a trace log, do the following:
Launch the Performance monitoring tool (Start, Programs, Administrative Tools, Performance).
Double-click Performance Logs and Alerts and click once on the Trace logs.
Right-click a blank area of the details pane on the right of the window and click New Log Settings.
In the Name field, type the name of the Trace log you want to create and then click OK.
For a list of installed providers and their status (enabled or not), click Provider Status in the General tab. By default, the Nonsystem Providers option is selected to keep trace logging overhead to a minimum. Click Events Logged by System Provider and check the boxes as appropriate to define events for logging.
On the Log File tab, you can configure the log to be circular, so that when the log file reaches a predetermined size, it will be overwritten.
New to Windows 2003 R2 is Common Log File System (CLFS). This architecture allows both OEM and custom applications to use common logging structures. A first for Windows, CLFS can create log files with multiple streams of data from multiple sources. It is the first native multiplexing log system. This brings native root cause analysis closer to the operating system instead of relying on expensive third-party tools. CLFS also allows generic policy-based management for uniformity across the enterprise.
CLFS will be integrated with emerging products, including Microsoft Exchange 12 and Windows Clustering. In a clustered environment it allows all member servers to maintain a single, shared log. Possibly its most important feature, CLFS is designed for high performance and will allow for MOM 2005 to manage servers “agentless” without the performance overhead penalty currently incurred.
A baseline is a performance level that can be used as a starting point to compare against future network performance operations. When a server is first monitored, there is very little to compare the statistics against. After a baseline is created, information can be gathered at any time in the future and compared against the baseline. The difference between the current statistics and the baseline statistics is the variance caused by system load, application processing, or system performance contention.
To be able to set a baseline value, you need to gather a normal set of statistics on each system that will eventually be monitored or managed in the future. Baselines should be created for normal and stressed times. The workload on a machine at night when there are fewer users connected to it provides a poor baseline to compare real-time data in the middle of the day. Information sampled in the middle of the day should be compared with a baseline of information collected at around the same time of day during normal load prior to the sample comparison.
Creating baselines should be an ongoing process. If an application or a new service is added to a server, a new baseline should be created so that any future comparisons can be made with a baseline with the most current status of system performance.
Performance monitoring uses system resources that can affect the performance of a system as well as affect the data being collected. To ensure that performance monitoring and analyzing do not affect the machines being monitored themselves, you need to decrease the impact of performance monitoring. Some steps can be taken to ensure that performance monitoring overhead is kept to a minimum on the server being monitored to create as accurate of an analysis on a system as possible:
Use a remote server to monitor the target server. Servers can actually be dedicated to monitoring several remote servers. Although this might also lead to an increase in network bandwidth, at least the monitoring and tracking of information do not drastically degrade CPU or disk I/O as if the monitoring tool were actually running on the server being monitored.
Consider reducing the frequency of the data collection interval because more frequent collection can increase overhead on the server.
Avoid using too many counters. Some counters are costly in terms of taxing a server for system resources and can increase system overhead. Monitoring several activities at one time also becomes difficult.
Use logs instead of displaying graphs. The logs can then be imported into a database or report. Logs can be saved on hard disks not being monitored or analyzed.
The numbers of system and application components, services, and threads to measure in Windows Server 2003 are so extensive that it is impossible to monitor thousands of processor, print queue, network, or storage usage statistics. Defining the roles a server plays in a network environment helps to narrow down what needs to be measured. Servers could be defined and categorized based on the function of the server, such as application server, file and print server, or services server such as DNS, domain controller, and so on.
Because servers perform different roles, and hence have different functions, it makes sense to monitor the essential performance objects. This helps prevent the server from being overwhelmed from the monitoring of unnecessary objects for measurement or analysis. Overall, four major areas demand the most concern: memory, processor, disk subsystem, and network subsystem. They all tie into the roles the server plays.
The following list describes objects to monitor based on the roles played by the server:
Domain controller—. Because the DC provides authentication, stores the Active Directory database, holds schema objects, and so on, it receives many requests. To be able to process all these requests, it uses up a lot of CPU resources, disks, memory, and networks. Consider monitoring memory, CPU, system, network segment, network interface, and protocol objects such as TCP, UDP, NBT, NetBIOS, and NetBEUI. Also worth monitoring are the Active Directory NTDS service and site server LDAP service objects. DNS and WINS also have applicable objects to be measured.
File and Print server—. The print servers that process intensive graphics jobs can utilize extensive resources of system CPU cycles very quickly. The file server takes up a lot of storage space. Monitor the
PrintQueueobject to track print spooling data. Also monitor CPU, memory, network segment, and logical and physical disks for both file and print data collection.Message Collaboration server—. A messaging server such as a Microsoft Exchange server uses a lot of CPU, disk, and memory resources. Monitor memory collection, cache, processor, system, and logical and physical disks. Some Exchange objects are added to the list of objects after Exchange is installed, such as message queue length or name resolution response time.
Web server—. A Web server is usually far less disk intensive and more dependent on processing performance or memory space to cache Web pages and page requests. Consider monitoring the cache, network interface, processor, and memory usage.
Database server—. Database servers such as Microsoft SQL Server can use a lot of CPU and disk resources. Database servers such as Microsoft SQL Server use an extensive amount of memory to cache tables and data, so RAM usage and query response times should be monitored. Monitoring objects such as system, processor, logical disk, and physical disk is helpful for overall system performance operations.
Windows Server 2003 comes with a tool called Network Monitor that is used to perform network communications traffic analysis. Network Monitor, also known as Netmon, provides network utilization statistics and packet traffic as well as captures frames for analysis.
Note
In addition to the Network Monitor, as well as some of the tools already mentioned, such as EventCombMT and Checkrepl.vbs, There are other utilities in the Windows Server 2003 Resource Kit that can assist in analyzing and diagnosing network-related functions. Two tools, called the Link Check Wizard and Chknic, should be added to your arsenal especially for troubleshooting purposes.
Data is transferred all the time from one point to another in the form of network traffic that is divided into frames. A frame contains information such as the address of the machine to which it is destined, the source address, and protocols that exist within the frame. Besides having bottlenecks on the server, bottlenecks can also occur on the network when it is overwhelmed. For example, a network adapter can fail and flood the network with invalid network transmissions that can slow down the rate of data transfer between other devices on the network. When the network becomes slow, the network can be said to have reduced available network bandwidth.
Netmon can be viewed as both a network troubleshooting tool and a packet analysis tool. The version of Netmon that comes with Windows Server 2003 allows only the capture of frames sent to and from your local server. The full-featured version of Network Monitor that provides enterprisewide network monitoring, allowing network traffic to be monitored or analyzed to and from any computer in the network, can be found in the Microsoft Systems Management Server (SMS).
All computers on a network segment can receive and send frames within their segments. Network adapters on these computers process only frames meant for them; they discard all frames not addressed to them. These network adapters also retain broadcast and multicast frames.
After Netmon is installed, you can capture to a file all the frames sent to or retained by the adapter on which Netmon was installed. These captured frames can then be used for later analysis. It is possible to set up a capture filter so that only certain frames are captured. Frames can be filtered based on criteria such as source address, destination address, type of information captured, or the like. Capture triggers can also be set up to initiate certain actions such as starting a program, starting a capture, or ending a capture based on a specific event occurring on the network.
Before Netmon can be used, it must be installed from the Control Panel. To install Netmon, follow these steps:
Open the Control Panel.
Click Add or Remove Programs.
Click Add/Remove Windows Components to open the Windows Components Wizard.
Select Management and Monitoring Tools and click Details.
Check Network Monitor Tools and then click OK.
Click Next and if prompted for additional files, insert the installation CD.
Click Finish at the end of the installation.
Go to the Administrative Tools and select Network Monitor to open the utility. After Netmon is loaded, you can capture all frames sent to or retained by the network adapter of the machine on which it is installed. These captured frames can then be saved or viewed for further analysis.
The Netmon application, shown in Figure 34.10, provides several types of information. The capture window display is divided into three parts: system statistics, network and captured statistics, and station statistics.
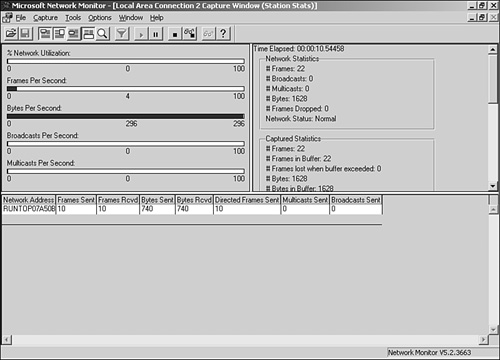
In the upper-left pane is the Netmon graph. It shows current activities on the network in a horizontal bar-like fashion. The Total Statistics pane located in the upper right displays the total network activity detected since a capture began. The Session pane located in the lower left shows the established session between two nodes. The Station Statistics pane located in the bottom pane shows statistics about frames sent and received on a per-node basis. The Station Statistics pane has several fields such as Frames and Bytes Sent and Received, Directed Frames Sent, Multicasts Sent, Broadcasts Sent, and the network (local server) responsible for the traffic. The Station Statistics pane can also help you identify the largest broadcaster in a network; to do so, right-click the Broadcasts Sent column and then click the Sort button.
Before you start capturing frames, make sure to select a network adapter from the Capture menu (typically the primary network adapter of the system being monitored). Also select buffer settings from the Capture menu. To begin capturing, click the Start Capture button (it looks like a play button on a cassette tape recorder). Alternatively, press the F10 key. Capture will proceed to fill the memory with frames until it is full, so capture only the frames needed and over a short duration of time. This decreases the effect that Network Monitor will have on the performance of the server being monitored. To stop, pause, or display captured data from the Capture menu, simply select Stop, Pause, or Display Captured Data. You also can stop and display the capture by clicking Stop and View. To save a captured frame for future analysis, select File, Save As and specify a path and filename to store the captured frame.
To set a capture trigger, select Capture, Trigger to open a property page similar to the one shown in Figure 34.11. On the Capture Trigger property page, select Pattern Match to initiate a trigger action when a specific hexadecimal or ASCII string appears in a frame. In the Pattern text box, type a string and specify ASCII or Hex. It is possible to have an action occur whenever there is a trigger. To do so, select Audible Signal Only to have the machine beep, select Stop Capture to stop the capture, or check Execute Command Line and specify the command or program that runs when a trigger occurs.
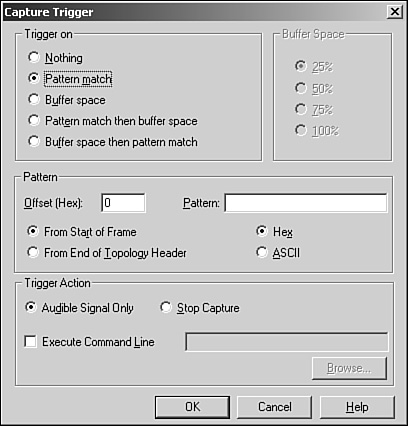
To initiate a trigger based on the size of the buffer, select Buffer Space and then choose the percentage. It is also possible to have an action occur whenever there is a trigger. To initiate a trigger when a specific pattern in a frame is detected, select Buffer Space Then Pattern Match and specify the percentage and pattern needed.
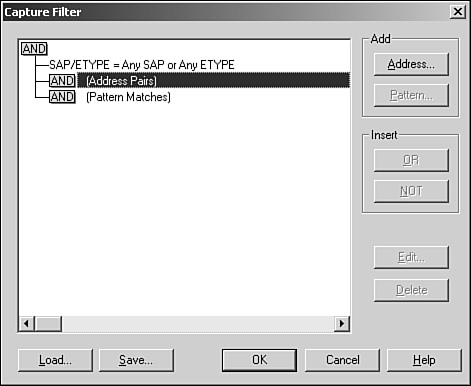
Filtering can help reduce the amount of data being reviewed and analyzed. A capture filter can be specified based on addresses, protocols, and frame data patterns. To set up a filter, select File, Capture, Filter.
To capture data based on specified frame data patterns, double-click the AND (Pattern Matches) line in the Capture Filter decision tree and then specify the hexadecimal or ASCII data pattern that captured frames should match.
To specify captured filters based on address pairs similar to the ones shown in Figure 34.12, double-click the AND (Address Pairs) line in the decision tree or double-click the address pair to edit. In the Address Expression dialog box, specify address pair properties, and then click OK.
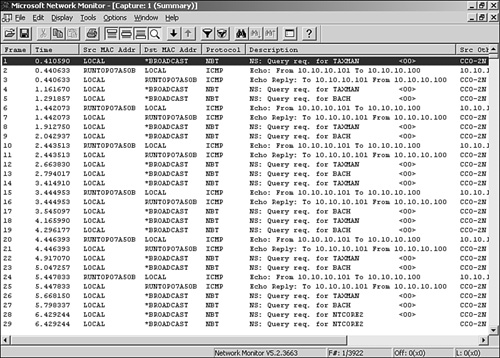
Captured data can be displayed by selecting File, Capture, Display Captured Data. You’ll see a summary page similar to the one shown in Figure 34.13. The captured data displays the frame, time duration, source MAC address, destination MAC address, protocol, and so on.
Note
In a capture filter, the EXCLUDE statement takes precedence over the INCLUDE statement regardless of the order in which statements appear in the Capture Filter property page. If a filter contains both the INCLUDE and EXCLUDE statements, the frame is discarded if it meets the criteria specified in the EXCLUDE statement. Network Monitor does not check whether the frame meets the INCLUDE statement criteria.
Several useful tools are available in Windows Server 2003 for troubleshooting and diagnosing various problems ranging from TCP/IP connection issues to verification and maintenance issues. These tools also make it much easier for IT professionals, allowing IT personnel to focus on business improvement tasks and functions, not on simply running specific tools in the networking environment.
TCP/IP forms the backbone of communication and transportation in Windows Server 2003. Before you can communicate between machines, TCP/IP must be configured. In Windows Server 2003, Microsoft decided to make TCP/IP install by default during the OS installation and also made it impossible to add or remove TCP/IP through the GUI.
Microsoft also added four new parameters (-R, -S, -4, -6) to some of the TCP/IP utilities in Windows Server 2003 that were not available in previous versions of Windows; these parameters will be discussed next.
If a TCP/IP connection fails, you need to determine the cause or point of failure. Windows Server 2003 includes some dependable and useful tools that can be used to troubleshoot connections and verify connectivity. The tools described in the following eight sections are very useful for debugging TCP/IP connectivity problems.
PING means Packet Internet Groper. It is used to send an Internet Control Message Protocol (ICMP) echo request and echo reply to verify the availability of a local or remote machine. You can think of PING as a utility that sends a message to another machine asking “Are you still there?” By default, in Windows Server 2003, PING sends out four ICMP packages and waits for responses back in one second. However, the number of packages sent or time to wait for responses can be changed through the options available for PING.
Besides verifying the availability of a remote machine, PING can help determine a name resolution problem.
To use PING, go to a command prompt and type PING Targetname, as shown in Figure 34.14. Different parameters can be used with PING. To display them, type PING /? or PING (without parameters).

The parameters for the PING command are as follows:
-4—. Specifies that IPv4 is used to ping. This parameter is not required to identify the target host with an IPv4 address. It is required only to identify the target host by name.-6—. Specifies that IPv6 is used to ping. Just like –4, this parameter is not required to identify the target host with an IPv6 address. It is required only to identify the target host by name.-a—. Resolves the IP address to the hostname. The hostname of the target machine is displayed if this command is successful.-f—. Requests that echo back messages are sent with the Don’t Fragment flag in packets. This parameter is available only in IPv4.-ittl—. Increases the timeout on slow connections. The parameter also sets the value of the Time to Live (TTL). The maximum value is 255.-jHostList—. Routes packets using the host list, which is a series of IP addresses separated by spaces. The host can be separated by intermediate gateways (loose source route).-kHostList—. Similar to –j but hosts cannot be separated by intermediate gateways (strict source route).-lsize—. Specifies the length of packets in bytes. The default is 32. The maximum size is 65,527.-ncount—. Specifies the number of packets sent. The default is 4.-rcount—. Specifies the route of outgoing and incoming packets. It is possible to specify a count that is equal to or greater than the number of hops between the source and destination. The count can be between 1 and 9 only.-R—. Specifies that the roundtrip path is traced (available on IPv6 only).-Scount—. Sets the time stamp for the number of hops specified by count. The count must be between 1 and 4.-SSrcAddr—. Specifies the source address to use (available on IPv6 only).-t—. Specifies that PING should continue sending packets to the destination until interrupted. To stop and display statistics, press Ctrl+Break. To stop and quit PING, press Ctrl+C.-vTOS—. Specifies the value of the type of service in the packet sent. The default is zero. TOS is specified as a decimal value between 0 and 255.-wtimeout—. Specifies the time in milliseconds for packet timeout. If a reply is not received within the timeout, the Request Timed Out error message is displayed. The default timeout is four seconds.TargetName—. Specifies the hostname or IP address of the destination to ping.
Tracert is generally used to determine the route or path taken to a destination by sending ICMP packets with varying Time to Live values. Each router the packet meets on the way decreases the value of the TTL by at least one; invariably, the TTL is a hop count. The path is determined by checking the ICMP Time Exceeded messages returned by intermediate routers. Some routers do not return Time Exceeded messages for expired TTL values and are not captured by Tracert. In such cases, asterisks are displayed for that hop.
To display the different parameters that can be used with Tracert, open a command prompt and type tracert (without parameters) to display help or type tracert /?. The parameters associated with Tracert are as follows:
-4—. Specifies that tracert.exe can use only IPv4 for the trace.-6—. Specifies that tracert.exe can use only IPv6 for the trace.-d—. Prevents resolution of IP addresses of routers to their hostname. This is particularly useful for speeding up results of Tracert.-hmaximumHops—. Specifies the maximum number of hops to take before reaching the destination. The default is 30 hops.-jHostList—. Specifies that packets use the loose source route option. Loose source routing allows successive intermediate destinations to be separated by one or multiple routers. The maximum number of addresses in the host list is nine. This parameter is useful only when tracing IPv4 addresses.-R—. Sends packets to a destination in IPv6, using the destination as an intermediate destination and testing reverse route.-S—. Specifies the source address to use. This parameter is useful only when tracing IPv6 addresses.
Note
Tracert is a good utility to determine the number of hops and the latency of communications between two points. Even if an organization has an extremely high-speed connection to the Internet, if the Internet is congested or if the route a packet must follow requires forwarding the information between several routers along the way, the performance and ultimately the latency (or delay in response between servers) will cause noticeable communications delays.
Pathping is a route tracing tool that combines both features of PING and Tracert commands with some more information that neither of those two commands provides. Pathping is most ideal for a network with routers or multiple routes between the source and destination hosts. The Pathping command sends packets to each router on its way to a destination, and then gets results from each packet returned from the router. Because Pathping computes the loss of packets from each hop, you can easily determine which router is causing a problem in the network.
To display the parameters in Pathping, open a command prompt and type Pathping /?. The parameters for the Pathping command are as follows:
-gHost-list—. Allows hosts to be separated by intermediate gateways.-hmaximumHops—. Specifies the maximum number of hops before reaching the target. The default is 30 hops.-n—. Specifies that it is not necessary to resolve the address to the hostname.-pperiod—. Specifies the number of seconds to wait between pings. The default is a quarter of a second.-q—. Specifies the number of queries to each host along the route. The default is three seconds.-R—. Determines whether the hosts along the route support Resource Reservation Setup Protocol. The route supports the Resource Reservation Setup Protocol to allow host computers to reserve bandwidth for data streams. Note that this parameter must be in uppercase.-T—. Identifies network devices that do not have Layer 2 priority configured. This parameter must be in uppercase.
Ipconfig displays all TCP/IP configuration values. It is of particular use on machines running DHCP. It is used to refresh DHCP settings and to determine which TCP/IP configuration values have been assigned by DHCP. If Ipconfig is used without parameters, it displays IP addresses, subnet masks, and gateways for adapters on a machine. The adapters can be physical network adapters or logical adapters such as dial-up connections.
The parameters for Ipconfig are as follows:
/displaydns—. Displays the contents of the DNS client resolver cache./flushdns—. Resets and flushes the contents of the DNS client resolver cache. This includes entries made dynamically./registerdns—. Sets manual dynamic registration for DNS names and IP addresses configured on a computer. This is particularly useful in troubleshooting DNS name registration or dynamic update problems between a DNS server and client./release[Adapter]—. Sends a DHCP release message to the DHCP server to discard DHCP-configured settings for adapters. This parameter is available only for DHCP-enabled clients. If no adapter is specified, IP address configuration is released for all adapters./renew[Adapter]—. Renews DHCP configuration for all adapters (if an adapter is not specified) and for a specific adapter if theAdapterparameter is included. This parameter is available only for DHCP-enabled clients./setclassidAdapter [classID]—. Configures the DHCP Class ID for a specific adapter. You can configure the DHCP class ID for all adapters by using the wildcard (*) character in place ofAdapter./showclassidAdapter—. Displays the DHCP class ID for a specific adapter.
Note
Ipconfig determines the assigned configuration for a system such as the default gateway, DNS servers, local IP address, subnet mask, and the like. When you’re debugging network problems, you can use Ipconfig to validate that the proper TCP/IP settings have been set up for a system so that a server properly communicates on the network.
Arp stands for Address Resolution Protocol. Arp enables the display and modification of the Arp table on a local machine, which matches physical MAC addresses of machines to their corresponding IP addresses. Arp increases the speed of connection by eliminating the need to match MAC addresses with IP addresses for subsequent connections.
The parameters for Arp are as follows:
-a[InetAddr] [-N IfaceAddr]—. Displays the Arp table for all adapters on a machine. Use Arp-awith theInetAddr(IP address)parameter to display the ARP cache entry for a specific IP address.-dInetAddr [IfaceAddr]—. Deletes an entry with a specific IP address (InetAddr). Use theIfaceAddrparameter (IP address assigned to the interface) to delete an entry in a table for a specific interface. Use the wildcard character in place ofInetAddrto delete all entries.-sInetAddr EtherAddr [IfaceAddr]—. Adds a static entry to the ARP cache that resolves the IP address (InetAddr) to a physical address (EtherAddr). To add a static ARP cache entry to the table for a specific interface, use the IP address assigned to the interface (IfaceAddr).
As its name implies, Netstat (or Network Statistics) is used to display protocol statistics for any active connections, monitor connections to a remote host, and monitor IP addresses or domain names of hosts with established connections.
The parameters for Netstat are as follows:
-a—. Displays all connections and listening ports by hostname.-an—. Similar to the–aparameter, but displays connections and listening ports by IP addresses.-e—. Displays Ethernet packets and bytes to and from the host.-n—. Displays address and port numbers without resolving the address to the hostname.-o—. Displays TCP connections and includes the corresponding process ID (PID). Used in combination with–a,-n, and–p. Not available in previous Windows versions.-Pprotocol—. Displays statistics based on the protocol specified. Protocols that can be specified are TCP, UDP, TCPv6, or UDPv6. It can be used with–sto display TCP, UDP, ICMP, IP, TCPv6, UDPv6, ICMPv6, or IPv6.-s—. Displays statistics on a protocol-by-protocol basis. Can be used with the–pparameter to specify a set of protocols.-r—. Displays the route table. Information displayed includes network destination, netmask, gateway, interface, and metric (number of hops).[Parameter] Interval—. Displays the information at every interval specified.Intervalis a numeral in seconds. Press Ctrl+C to stop the intervals.
The Network Connectivity Tester (NetDiag) tool is a command-line diagnostic tool to test network connectivity, configuration, and security. It’s included with the Support Tools on the Windows Server 2003 media. The tool gathers information on and tests network configuration, network drivers, protocols, connectivity, and well-known target accessibility. This is a good tool to use right off the bat if you think there are problems with the network connectivity of a system.
One nice feature of the NetDiag.exe tool is that it does not require parameters, which makes it easy to use. Simple instructions can be given to the administrators that need to execute it, and the bulk of the time can be spent analyzing the results.
Although it doesn’t require any parameters, there are several available:
When specifying tests to run or to skip, nonskippable tests will still be run.
The Domain Controller Diagnostic (DCDiag) tool analyzes the state of domain controllers and services in an Active Directory forest. It is included with the Support Tools on the Windows Server 2003 media. This is a great general-purpose test tool for checking the health of an Active Directory infrastructure.
Tests include domain controller connectivity, replication errors, permissions, proper roles and connectivity, and other general Active Directory health checks. It can even run non–domain controller–specific tests, such as whether a server can be promoted to a domain controller (the DcPromo test), or register its records properly in DNS (RegisterInDNS test).
DCDiag is run on domain controllers exclusively, with the exception of the DcPromo and RegisterInDNS tests. When run without any parameters, the tests will be run against the current domain controller. This runs all the key tests and is usually sufficient for most purposes.
The parameters for DCDiag are as follows:
/s:DomainController—. Uses the domain controller as the home server./n:NamingContext—. Uses the specified naming context (NetBIOS, FQDN, or distinguished name) to test./u:DomainUserName—. Uses the supplied credentials to run the tool./p:{*¦Password¦""}/a—. Tests all domain controllers in the site./e—. Tests all domain controllers in the enterprise./q—. Quiet output (errors only)./v—. Verbose output./f:LogFile—. Logs to the specified log file./test:TestName—. Runs the specified tests only.
When specifying tests to run or to skip, nonskippable tests will still be run.
Route is particularly useful for troubleshooting incorrect static routes or for adding a route to a route table to temporarily bypass a problem gateway. Static routes can be used in place of implicit routes specified by a default gateway. Use Route to add static routes to forward packets going to a gateway specified by default to avoid loops, improve traffic time, and so on.
The parameters for Route are as follows:
-add—. Adds a route to a table. Use–pto make the route persistent for subsequent sessions.-gateway—. Specifies the address of gateway for Route.IFinterface—. Specifies the interface for the routing table to modify.-maskNetmask—. Uses the subnet mask specified byNetmask. Ifmaskis not used, it defaults to 255.255.255.255.-METRICMetric—. Specifies the metric, or cost, for the route using the valueMetric.-f—. Clears the routing table of all gateway entries.-p—. Used with -add to create a persistent route.
Nslookup is used to query DNS. You can think of Nslookup as a simple diagnostic client for DNS servers. It can operate in two modes: interactive and noninteractive. Use noninteractive mode to look up a single piece of data. To look up more than one piece of data, use interactive mode. To stop interactive mode at any time, press Ctrl+B. To exit from the command, type exit. If Nslookup is used without any parameters, it uses the default DNS name server for lookup.
The parameters for Nslookup are as follows:
-ComputerToFind—. Looks up information for the specifiedComputerToFind. By default, it uses the current default DNS name server.-Server—. Specifies the server as the DNS name server.-SubCommand—. Specifies one or more Nslookup subcommands as a command-line option. Type a question mark (?) to display a list of subcommands available.
The System Startup and Recovery utility stores system startup, system failure, and debugging information. It also controls the behavior (what to do) when a system failure occurs.
To open System Startup and Recovery, right-click My Computer, select Properties, select the Advanced tab, and then click Settings under Startup and Recovery to display a property page similar to the one shown in Figure 34.15.

The Default Operating System field contains information that is displayed at startup. This information is typically the name of the operating system such as Microsoft Windows Server 2003 Enterprise server. You can edit this information by clicking the Edit button or by editing the boot.ini file. If the machine is dual-booted, there will be an entry for each operating system. The Time to Display List of Operating Systems option specifies the time the system takes to display the name of the operating system at startup. The default time is 30 seconds. This can be increased or reduced to a different time.
You can set the action to be taken when system failure occurs in the System Failure section. There are three options. The first option is Write an Event to the System Log. This action is not available on Windows Server 2003 because this action occurs by default every time a stop error occurs. The second option, Send an Administrative Alert, sends an alert. The last option, Automatically Restart, automatically reboots the system in the event of a system failure.
The Write Debugging Information section tells the system where to write debugging information when a system failure occurs. The options available include where the debugging information can be written to Small memory dump (64KB), Kernel memory dump, Complete memory dump, or (none). The Write Debugging Information To option requires a paging file on the boot volume, which should be the size of the physical RAM plus 1MB. Thus, a system with 512MB of RAM will create a paging file 513MB in size.
Memory resources can be saved if the Write Debugging Information To option is set to (none) and the Send an Administrative Alert option is unchecked. The memory that would be saved depends on the server; the drivers that enable these features require about 60 to 70KB.
Many troubleshooting scenarios revolve around memory-related issues, such as an errant application or process consuming too much memory. The Windows Server 2003 Resource Kit provides many useful utilities that can assist in the troubleshooting process. However, there are two that are specifically designed for memory:
Memory Monitor (memmonitor.exe)—. This command-line tool monitors a process’ memory and can debug the memory in use after a specific threshold has been reached.
Resource Leak Triage Tool (memtriage.exe)—. If a process takes up memory and never releases the memory back to the system, a memory leak occurs. Use this tool to monitor, log, and analyze memory usage and more easily determine whether a process is causing a memory leak.
Software errors can be reported in Windows Server 2003. The error-reporting mechanism makes this happen. The errors reported in the error-reporting mechanism can be sent to Microsoft to help improve its future products.
You can open this mechanism by right-clicking My Computer, selecting Properties, selecting the Advanced tab, and clicking the Error Reporting button to display a screen similar to the one in Figure 34.16. You can disable software error reporting by selecting the Disable Error Reporting radio button.

The other option is to allow software error reporting. You enable it by selecting Enable Error Reporting. Options are available to report all or one of the following: Windows Operating System, Unplanned Machine Shutdowns, Programs (you can select programs you want by clicking the Choose Programs button), and Force Queue Mode for Program Errors.
Dr. Watson for Windows is a program debugger. The Microsoft technical support team can use the information obtained and logged by Dr. Watson for troubleshooting purposes. A text file is generated whenever an error occurs. A crash dump file can also be generated when an error occurs.
Dr. Watson starts automatically when a program error occurs. However, you can also start it from a command prompt by typing drwtsn32. After Dr. Watson is started, a screen similar to the one in Figure 34.17 is shown.
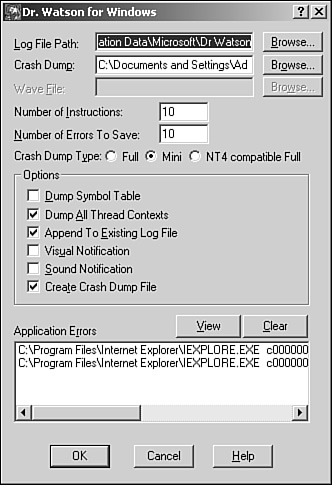
The log file generated by Dr. Watson can be viewed in a text editor. This file contains information such as process ID of the application, date and time of occurrence, error that occurred, program that caused the error, function name, task identifier, and so on.
Logging and debugging tools help administrators monitor, manage, and problem-solve errors on the network. Many of the tools used to identify network problems in a Windows Server 2003 environment have been improved from previous versions of the applications in earlier releases of the Windows operating system. Key to problem solving is enabling logging and monitoring the logs to identify errors, research the errors, and perform system recovery based on problem resolution.
In addition to the tools and utilities that come with the Windows Server 2003 environment are resources such as the Microsoft TechNet database (http://www.microsoft.com/technet/). Between utility and tool improvements as well as online technical research databases, problem solving can be simplified in a Windows Server 2003 networking environment.
Use the Task Manager to provide an instant view of system resources, such as processor activity, process activity, memory usage, and resource consumption.
Use the Event Viewer to check whether Windows Server 2003 is experiencing problems.
Filter for specific events in the Event Viewer.
Archive security logs to a central location on your network and then review them periodically against local security logs.
Set an auditing policy to shut down the server immediately when the security log is full. This will prevent generated logs from being overwritten or old logs from being erased.
Establish a process for monitoring and analyzing system performance to promote maximum uptime and to meet service-level agreements.
Run the System Monitor from a remote computer to monitor servers.
Use logging when monitoring a larger number of servers.
Establish performance baselines.
Create new baselines as applications or new services are added to a server.
Consider reducing the frequency of data collection to reduce the amount of data that must be collected and analyzed.
Use logs to capture performance data.
Filter data captured from Netmon to assist with administration, maintenance, and troubleshooting efforts.
Consult the Windows Server 2003 Resource Kit for tools and documentation to assist with monitoring, analyzing, and troubleshooting.
Don’t use the
INCLUDEandEXCLUDEfilters in Netmon at the same time.Use Tracert to determine the number of hops and the latency of communications between two points.