
With Dynamics NAV, we can easily create our own report in Microsoft Excel using Business Intelligence (BI) tools. Let's create a report to analyze the total sales and profits, grouped per customer or per item:
- Open Excel. On the PowerPivot tab, click on the PowerPivot Window option.
- A new page opens. Navigate to From database | SQL database. Type the server and database name of your Dynamics NAV. Click on Next.
- Choose the Select in the table and views list to choose data to import option.
- From the table and views list, select the following tables:
Table Name
Comments
CRONUS International
Ltd_$ValueEntryClick on Preview & Filters. Filter the Item Ledg. Entry Type field to only show lines with the value 1.
CRONUS International
Ltd_$ItemCRONUS International
Ltd_$Customer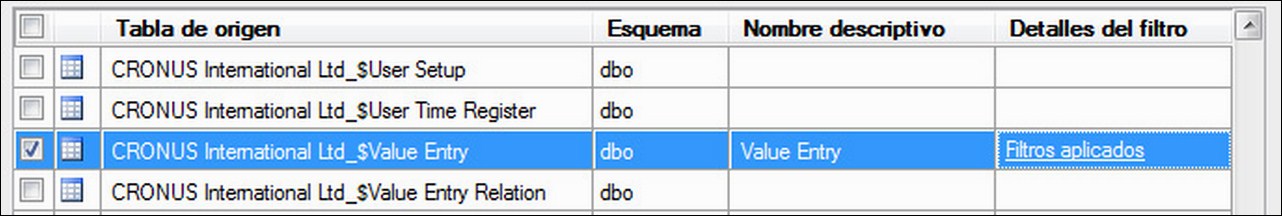
- Click on Finish. Then click on Close. Close the PowerPivot Window to go back to the Excel sheet.
- Now that we have selected the data source, let's create a Pivot table. To do so, click on the Pivot table option of Excel. Select New Sheet and click on OK.
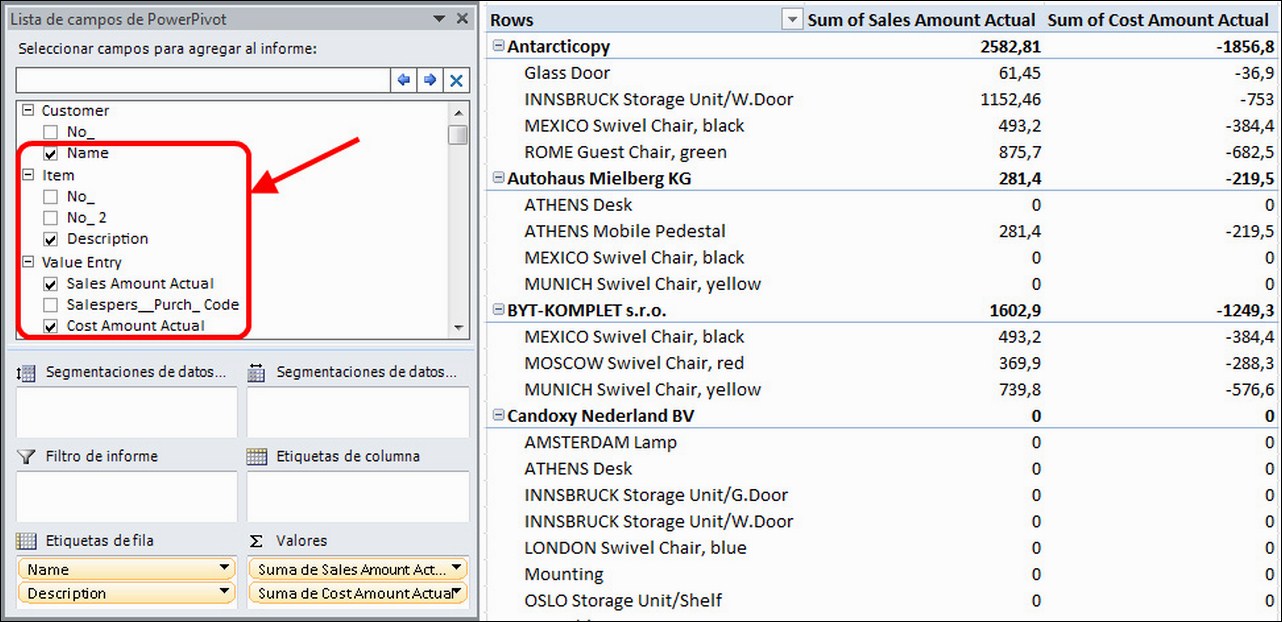
- On the PowerPivot fields list, select the fields as shown in the following screenshot. If the message A relation may be needed appears, click on Create.
The power pivot table will show the sales grouped by customer and item, as shown in the following screenshot:
Now, we can use the pivot table options and add more fields on rows, filters, segmentation, and so on.
Once we have created our Excel pivot table, we can save it, and open it again later. We will only have to refresh the PowerPivot source to get the latest data; we will not have to create the report all over again.