
Chapter 4
Media use under structural change
Karl Erik Rosengren
INTRODUCTION
Aspects and determinants of mass media use
In all industrial and post-industrial societies mass media form very important linkages:
1 Between the great societal subsystems (horizontal linkages between, say, economy and polity, religion and science) and
2 Between the macro, meso and micro levels of society (vertical linkages).
The latter linkages may be conceptualized in terms of primary and secondary socialization. When it comes to mass media and the use of mass media, the very general phenomena of primary and secondary socialization have their more specific counterparts in a range of phenomena conceptualized in terms such as diffusion of news, agenda setting, spirals of silence, cultivation, effects research, etc. (see Chapter 1).
Whatever the perspective applied, however, all these traditions of research presuppose (or assume) knowledge about a more basic phenomenon: the individual use made of the mass media and their contents. This chapter deals with some basic aspects of mass media use by Swedish children, adolescents and young adults from about 1975 to about 1990.
Within the MPP, data have been collected about the individual use made of a wide range of mass media: dailies, weeklies, radio, television (broadcast, satellite and cable), VCR, film and music recorded and distributed in various ways. There is no doubt, however, that two partly overlapping types of media use are overwhelmingly dominant among young people: television viewing (by way of broadcasting, cable (CTV), satellite (DBS) or video(VCR)) and listening to music (by way of radio, television or some recording device or other). In this chapter, therefore, attention will be focused on television viewing and listening to music among children, adolescents and young adults. Between them, these two types of media use represent a great, heterogeneous and highly variable slice of the lives of young people. (Data about the use of other media by young people have been published in a number of previous MPP reports. For an overview of early MPP data about media use, see Rosengren and Windahl 1989; for more recent data, see Sonesson and Höjerback 1989; Höjerback 1990; see also Chapters 5 and 6.)
Regardless of the medium chosen, any student of individual media use must distinguish between at least four aspects of that use (see Rosengren and Windahl 1989: 18 ff.):
1 Amount of use (in terms of units of time spent or units of media content used).
2 Type or genre of media content used and preferred (news, editorials, soap operas, etc.).
3 Type of relation established with the content used (identification, para-social interaction, etc.).
4 Type of context of media use (alone or with somebody else, media use being primary or secondary activity, etc.).
In this chapter – indeed, in most parts of this book – the most basic of these four aspects will be in focus: amount of media use.
There is a lot of variation in television viewing and listening to music among young people. As was noted in Chapter 1, all variation in human action – including all four aspects of individual media use – is determined by long-and short-term variation in the following factors:
1Societal structure (including media structure).
2Individuals' position in social structure: age and gender, class and status.
3Personal characteristics: values, attitudes, opinions, etc.
Between them, these three types of determinant produce an immense variation in individual media use, especially if time is included in the analysis.
This chapter deals with similarities and differences, homogeneity and heterogeneity, stability and change in young people's mass media use, primarily with respect to amount of television viewing and listening to music as determined by a given societal structure and Individuals' position in that structure. Towards the end of the chapter, we will give special attention to the difficult question about the relationship between changes in societal structure and individual media use as partly determined by the individual's position in social structure.
The study of media use: research design, methodology and techniques
The reason the MPP was initiated was a conviction that social phenomena are best understood as they develop and change. Starting out from this conviction it was only natural to turn to a study of media use as it develops among children and adolescents. In its turn, this choice called for a longitudinal design able to disentangle the three different causes of temporal variation: age,

Figure 4.1 Three modes of analysing data collected within a combined cross-sectional/longitudinal design (first three waves within the MPP)
generation (cohort), and situation. Only the combined panel/cross-sectional design presented in Figure 4.1 (cf. Figure 3.2 above) can achieve that, and even this design can achieve it only imperfectly (Riley 1992; Ryder 1992).
The design admits three types of comparison: vertical, horizontal, and diagonal. In each of these three types of comparison, one of the three sources of temporal variation is kept under control. By means of combined vertical, horizontal and diagonal comparisons, provisional information about the separate influence of the three sources of temporal variation may be arrived at.
In vertical comparisons (say, within the 1976/77 MPP data collection wave), the situation is kept constant; age and generational effects remain. This type of comparison is undertaken in most cross-sectional studies, as a rule with a view to explore the effects of age – sometimes without paying much attention to potential effects of generation, not to speak of the interaction between age and generation. Vertically computed means (that is, within the different MPP data collection waves) may provide some information about qualities common to a given situation. Under favourable conditions, therefore, comparisons between vertically calculated means may provide some information about the unique effects of situation as such (see however, Ryder 1992: 228).
In horizontal comparisons (say, within the MPP panel born 1965), generation is kept constant; situational and age effects remain. This is the type of comparison undertaken in most panel studies, often with a view to include the study of age effects, and sometimes without paying too much attention to potential situational effects, not to speak of the interaction between age and situational effects. Horizontally computed means (that is, within the different MPP panels) may provide some information about qualities common to individuals from a given generation. Under favourable conditions, therefore, comparisons between horizontally calculated means may provide some information about the unique effects of generation (cohort) as such (see however, Ryder 1992: 228).
In diagonal comparisons (say, within the diagonal composed of ninth-graders), finally, age is kept constant; situational and generational effects remain. Diagonally computed means (that is, within groups of equal age) may provide some information about qualities common to individuals of a given age. Under favourable conditions, therefore, comparisons between diagonally calculated means may provide some information about the unique effects of age as such (see however, Ryder 1992: 228).
Comparisons of the types here discussed are regularly undertaken in cohort studies, often using the rectangular design facilitating distinctions between the three temporal sources of variation (see Riley 1992). Based as they tend to be, however, on secondary analysis of available cross-sectional statistics, not on panel data, cohort studies are handicapped when it comes to argumentation about effects of individual characteristics on the same or different characteristics at a later point of time. The combined panel/cross-sectional design used in the MPP, on the other hand, admits such argumentation; at the same time it is the design which most efficiently (although by no means perfectly) admits that the three different effects of age, generation and situation be distinguished from each other.
Later in this chapter, some MPP data about amount of television viewing and listening to music among Swedish young people will be presented, in principle organized in an overall research design such as the one just described. In other chapters, this design will be more intensely exploited, in attempts to disentangle the differential effects of age, situation and generation not only on separate characteristics of media use, but also on clusters and temporal patterns of media use.
Amount of media use may be conceptualized in two quite different ways:
1In terms of habits of consumption, usually measured by means of interview or questionnaire, and
2In terms of actual consumption during a given time period, usually measured by means of interviews or questionnaires (diaries etc.), by means of people-metres (BBC 1987–93; Hasebrink and Krotz 1992; Webster and Lichty 1991), or by more direct observations, for instance, televised observation (Gunter and Svennevig 1987) or the so-called ESM technique, in which the individual reports his or her activities at random intervals (Csikszentmihalyi and Kubey 1981; Kubey and Csikszentmihalyi 1990; Lööv and Rosengren 1988; Lööv and Miegel 1989; Rosengren 1991a).
The two ways of conceptualization concern two quite different phenomena which unfortunately are sometimes confused. Habits are dispositional phenomena, in principle similar to other dispositional phenomena, for instance, attitudes, while actual consumption is just that: a type of actual behaviour. It is well known that attitudes and actual behaviour are less than perfectly correlated, and the same holds true for media habits and actual media behaviour during a given period of time (see Rosengren and Windahl 1989: 29 ff.). The reason this is so is that habits depend on relatively stable factors such as societal structure (including media structure), social position (age, gender, social class, etc.), and basic values, etc. which characterize the individual, while actual behaviour is much more situationally determined (in the case of media use, say, by daily variations in media output; see, for instance, Weibull 1985). To use one of the two types of measurement as a criterion variable for the other, in an attempt at validity measurement, therefore, seems to be less well-advised (see van der Voort and Vooijs 1990).
Distinctions such as these are valid, of course, not only for television but also for other types of media use, say, newspaper reading, or listening to music. They should be kept in mind when comparing descriptive data from different times and countries.
The MPP data about amount of television viewing and listening to music to be presented and analysed in the following section were collected mainly by means of classroom and mail questionnaires about a number of activities, attitudes and background data (see Rosengren and Windahl 1989: 29–38). As a rule, the type of media use measured was habitual media use, but in some data waves actual media use was also measured. The data collection was organized within the combined panel/cross-sectional design described in Chapter 3 and further discussed in this section.
TELEVISION VIEWING AND LISTENING TO MUSIC UNDER STRUCTURAL CHANGE
Young people's acceptance of new media appliances
Young people like to watch television, and to listen to music. Small wonder, then, that the new communication channels and equipment entering the Swedish media scene during the 1980s and 1990s – satellite and cable TV, the VCR and the CD – tended to reach young people quickly. According to semi-official statistics about ‘actual viewing’ (see above), on an average day in 1992, 36 per cent of the total Swedish population watched cable and/or satellite television; among those aged 9–14 and 15–24, the corresponding figures were 53 per cent and 49 per cent, respectively (Cronholm 1993: 317). In 1985, 23 per cent of the total population had a VCR in their home; in 1991, 58 per cent. Among those aged 9–14, the corresponding figures were 35 per cent and 85 per cent, respectively (Anshelm 1993: 340). On an average day in 1979, 1 per cent of the total population watched video, but the figure was 3 per cent among those aged 9–14. In 1992, the corresponding figures were 6 per cent and 12 per cent, respectively (Anshelm 1993: 342). And in 1991, 31 per cent of the total population had a CD-player; among those aged 15–19, the corresponding figure was 58 per cent (Burnett 1993: 388).
How did these new media appliances affect young people's media use? More specifically, during this period of thorough-going structural change, what happened to television viewing and music listening among young people in Sweden? Our MPP data offer detailed and precise answers to those questions, the combined panel/cross-sectional design sometimes letting otherwise unnoticed tendencies stand out relatively clearly.
Amount of television viewing and listening to music, 1975–1990
Figures 4.2 and 4.3 show the amount of television viewing and listening to music among the Malmö and Växjö panels of children, adolescents and young adults during the period 1975–1990.1 (The panels are denoted by V and M for Växjö and Malmö, respectively, followed by the panel's year of birth.) Both TV viewing and listening to music are measured as habits, by means of classroom and mail questionnaires. Television viewing includes broadcast,

Figure 4.2 Stability and change in amount of TV consumption, 1975–1990 (means)
cable and satellite television, but not VCR (see below). Note that the units of measurement in the two figures are very different: for television, minutes per day; for music, days per week. Based on a relatively large chunk of time (a whole day) and one single question as it is, the latter measure is much cruder than the former, which is based on minutes per day and six or eight questions (for further technical details, see also below).
What do the two figures tell us? The first impression is the high amount of variation. Take the age span 9–15, for instance (roughly corresponding to grades 3–9 of the figures). We see that during these years the habit of TV viewing is reduced from more than two hours a day to less than an hour and a half a day (panels V63, V65, V69 and M69), a reduction which for the three long panels (V63, M69, V69) continues at least till age 19. The change in listening to music is even larger, although it goes in the different direction. The amount of listening to popular music is roughly doubled from grade 5 to grade 9 (panels M69 and V69), and the increase goes on at least to the age of 21.
This large variation showing up within age spans which in current media statistics are often indiscriminately lumped together, does provide some food for thought. (Swedish semi-offical statistics, for instance, as a rule use age intervals such as, say, 9–14, 15–24 or some such variant.)In the following

Figure 4.3 Stability and change in amount of music consumption, 1976–1990 means
sections we shall discuss some sources of this variation, starting with a methodological artefact.
Dependency of descriptive results on the operationalization used
As data collection within the MPP proceeded, a change in Swedish leisure habits was definitely established, a change which had really begun in the 1960s and 1970s. Due to the change from a six-day week to a five-day week in the labour market, Friday night gradually became the equivalent of the Saturday night of previous times. With some lag, the school system followed suit in that schools started to be closed on Saturdays, too, just like offices and factories. This change proceeded at rather different pace in different school districts. For children and adolescents, the real breakthrough in this respect must have come some time around 1973, when, after a fairly long transition period, an official decree closed all Swedish schools on Saturdays.
At the time, most members of the MPP group had children at school. As late as in 1975, however, when the MPP started, we still must have felt that Friday was more similar to Thursday than it was to Saturday, for in the six- question battery on which we built our media consumption index, we preferred to group the days of the week that way (asking for time of viewing on weekdays (i e. Mondays-Fridays), Saturdays and Sundays, respectively): ‘In a normal week, how many weekdays do you ususally watch TV (1, 2, 3, 4, 5) - If you watch on a weekday, for how long do you usually watch (Less than an hour, about an hour, an hour and a half, etc.)-’ As always in panel studies, we then had to stick as long as possible to the original operationalizations, in order to maintain direct comparability. For the M70 panel, however, which at its start was conceived of as a rather independent panel, we felt free to heed the change in leisure habits which had meanwhile definitively taken place. (So we did in the one-off ‘Skåne’ study, a cross-sectional study of 15-year-old youngsters in the southernmost landscape of Sweden.) Consequently, Friday, Saturday and Sunday were treated as individual days, while the remaining four ‘real’ weekdays were lumped together. The six-item battery was thus changed into an eight-item battery: ‘How many Fridays (Saturdays etc.) a month do you usually watch TV? (1, 2, 3, 4) - If you watch on a Friday, for how long do you usually watch? (Less than an hour, about an hour, about an hour and a half, etc.).’ As a result of this, the level of TV consumption stood out as considerably higher for the V70 panel (and for the one-off ‘Skåne’ study) than for the previous ones (see Figure 4.2). In the last two waves of the earlier panels we felt that we had better change to the more adequate eight-item battery.
The long and the short of all this is a caveat with respect to figures about actual level of media consumption based on survey questions (see Comstock and Paik 1987: 13). To a considerable extent, such figures are dependent on the formulation of the question and/or the build-up of the index. In studies comparing media habits between countries, the risk of meeting with such artefactual differences should be even higher. For instance, US children, are reported to have a viewing time double that of Norwegian children, with Swedes coming somewhere in between (se Rosengren and Windahl 1989: 21). But only very careful comparisons could reveal how much of those differences are methodological artefacts, and how much are due to differences in media structure and general societal structure (for instance, the difference between the commercial US radio and television system on the one hand, and on the other the Scandinavian monopoly public-service type of system prevailing in the 1970s and most of the 1980s). In later sections of this chapter we will give more attention to that problem.
The fact that the absolute level of media consumption is tricky to measure does not mean that relative levels cannot be measured, of course. In Figures 4.2 and 4.3 the important fact to observe is not the absolute levels, but the strong dynamics observable in relative terms: the enormous increase in the importance of music during adolescence, and the corresponding reduction in the importance of television viewing. With respect to these two media, then, adolescence is really – as with respect to so many other phenomena – a period of dramatic upheavals. It deserves pointing out, though, that in the midst of upheaval, there is considerable stability. Stability in consumption, though, is perhaps an even more tricky phenomenon to conceptualize and operationalize than is consumption itself (see Chapter 6). But before turning to stability, we shall have to discuss temporal change and variation and the three main sources thereof.
Age, generation and situation
Methodologically and theoretically, the variation displayed in Figures 4.2 and 4.3 may be understood as caused by age (maturation), generation and situation. In this case, age effects should be theoretically interpreted primarily in terms of development theory, which is able to provide a quite convincing interpretation of the fact that in early adolescence children move away from family-oriented to peer-oriented activities (for example, away from watching public service television together with their parents in the living room, instead turning to listening to music together with their friends, preferably somewhere out of reach of parental control). This type of temporal effect seems to be quite strong in our case.
Generational effects should not be expected to be very strong within the relatively short time period under study, some fifteen years. Closer analysis does reveal, however, that already during the short time-span covered by the first three waves (3–4 years), some traces of generational effects are discernible (see Rosengren and Windahl 1989: 26). According to the same analysis those situation effects were not as strong as age effects.
A situational effect is clearly visible in Figure 4.3: listening to music is much lower in 1980/81 than in earlier and later waves (as compared with the two previous waves, some 20–30 per cent lower). This affects the development within all four panels measured in that wave, so that they differ from the overall pattern of continually increasing listening during adolescence, a pattern most clearly discernible in comparative analysis of cross-sectional patterns. As a consequence of this deviation, panel V65 gets an A-shaped profile (see Johnsson-Smaragdi 1983: 115 ff.; Rosengren and Windahl 1989: 106). Without our combined panel/cross-sectional design, this situation effect might have been erroneously interpreted as a maturational phenomenon. Similarly, the increase from age 11 to age 14, which is much more dramatic for panels V69 and M69 than is otherwise the case, might have been taken as showing a general developmental phenomenon, rather than being the joint product of situational and developmental effects which it actually is.
The strong situational effect on listening to music in 1980/81 was observed also at the national level (Berg 1982). Speculating on its causes, one may think of changes in either media structure or music fashion. (For the interplay between structural change and fashion cycles, see Peterson and Berger 1975.) Actually, analysing trade statistics, Burnett (1990, 1992) was able to show that in the early 1980s there was a down period in popular music in Sweden, thus confirming the downfall in the popularity of punk music which in Sweden was generally felt to take place around 1980.
Be that as it may. The overall methodological lesson to be drawn from Figures 4.2 and 4.3 is that when analysing descriptive data about media use, it is an advantage to have access to both narrow age categories and a combined cross-sectional/longitudinal design, preferably based on panel data. Broad categories and cross-sectional or panel data alone may result in quite misleading results. In addition, it is well to remember that empirical data about the absolute level of consumption are heavily dependent on both the conceptualization and the operationalization of media use (habit vs. actual consumption, type of measurement, etc.).
Keeping these lessons in mind, we shall now return to the problem of situational effects, this time writ large.
SITUATIONAL EFFECTS WRIT LARGE: MEDIA STRUCTURE CHANGING
A special case of situational effects: structural change
In the previous section we were able to observe a very probable situational effect for the year of 1980, the plausible explanation of which was a change in popular musical fashion. In this section we will be discussing a situational effect of much larger size – indeed, a change of a size which makes the use of the term ‘situational effect’ somewhat dubious. We shall turn to effects of a change not in the system, but of the system.
Let's return for a moment to Figure 4.2, featuring television viewing. Actually, there are some signs of the beginning of another situational effect to be perceived in that figure: the increased viewing among the 15-year-old ninth-graders of the new MPP cohort, V74, first measured in school-year 1989/90. In the latest data collection wave the ninth-graders of this cohort watched 117 minutes a day, while their comrades of the same age in panels V61, V63 and V65 watched 88, 89 and 82 minutes, respectively. In technical terms, this difference might be classified as a situational effect. But what we see is something else, something more important.
We noted in Chapter 2 that in the late 1970s the monopoly of the Swedish public service television system was de facto abolished when cable television was introduced (while the de jure abolishment occurred a decade later). The actual growth of access to commercial television by way of CTV and/or DBS among the population came much later than the de facto abolishment, of course. In early 1986, some 5 per cent of the population had such access, in early 1989 some 17 per cent, and in mid-1991, some 40 per cent (Cronholm 1993: 309). We have already seen, however, that among youth the penetration of various new communication gadgets was faster and more widespread than among adults, and much the same tendency can be seen for CTV: in 1989 30 per cent of our MPP youngsters in grade 9 had access to satellite television by way of cable. Those who had access watched 145 minutes a day (broadcast plus cable TV); those who did not, 105 minutes (Höjerback 1990: 5, 11) - a difference of some 40 per cent, a figure which is in rough accordance with national figures collected for somewhat broader age categories. This is what lies behind at least part of the comparatively high viewing among ninth-graders of cohort V74 to be observed in Figure 4.2 (another factor being the difference in measurement technique discussed above).
It would seem, then, that the incipient structural change of the Swedish television system had already exercised some influence on the viewing habits of the perhaps most susceptible part of the population, the adolescents. Another structural change had even stronger effects. Let's turn to the VCR.
In 1989, 74 per cent of the ninth-graders of cohort V74 had a VCR in their home. Those who had a VCR, watched 5.9 hours video a week; those who had not, 1.9 hours a week, either by means of renting a Video box', or in the homes of friends having access to the family VCR (Höjerback 1990: 5, 15). In terms of the statistic used in our TV viewing measurements, these figures correspond to 51 and 16 minutes a day, respectively.
The measurements of viewing previously discussed in this chapter do not include VCR viewing, which was always separately measured. In order to arrive at the total time spent before the screen, therefore, the VCR figures have to be added to the TV figures used in Figure 4.2. Figure 4.4 shows – for cohorts V69, V74 and V78 – the total time spent before the screen, watching not only broadcast and cable television, but also video.
We see how, because of the introduction of the VCR, the general decline in TV viewing during adolescence and early adulthood, repeated again and again in Figure 4.2, is reduced and turned into a rise after age 14 (grade 8), a tendency which remains and is being strengthened during later years of early adulthood. Note that the VCR figures refer to the whole cohort, thus including those without home access to VCR. The corresponding rise for VCR owners only, of course, would have been even steeper.
Figure 4.4 includes also the corresponding figures for cohorts V74 and V78. Two observations can be made. The figures for both TV alone and ‘TV plus video’ are much higher for the later cohorts. The decline from age 11 to age 15 is less steep among those cohorts. How are these striking differences to be explained?
Part of this difference no doubt is a methodological artefact (TV viewing measured by an eight-question battery, instead of a six-question battery; see above). The first substantive observation, however, is that the data for the two new cohorts, V74 and V78, reflect the situation in 1989, while the corresponding data from the old cohort, V69, reflect the situations in 1980 and 1984, respectively. (Had the x-axis of the figure referred to chronological time rather than to age intervals, the dots and lines for the two later cohorts would have been located to the very right of the figure.) In 1989,cable

Figure 4.4 TV and VCR viewing in panels V69, V74 and V78
viewing was widespread, while in 1980 and 1984, it was still unusual. The differences in ‘pure TV viewing’ observed between the early and late cohorts, therefore, partly express an increase in viewing caused by cable and satellite.
Similarly, the difference between early and late cohorts observed in video viewing at age 16 (grade 9) is also to be explained primarily in terms of structural change. In 1989, of course, the VCR was much more widespread than in 1984 (see above). Consequently, much more time was spent video viewing by the ninth-graders of the V74 cohort than by those of the V69 cohort (see Chapter 6).
Finally, we note that the slope of the lines connecting pure TV viewing at ages 11 and 14 is much steeper for the previous cohort than for the two later ones. What remains to be seen is what will happen to the slopes of the later cohorts from age 11 and onwards. Only continued research can provide an answer to that question, but it seems to be a fair guess that what has happened during the last decade is a true sea change, not only in the levels, but also –and more interestingly – in the whole dynamics of TV viewing among adolescents and young adults. Let's turn to a closer study of that dynamics, in terms of a somewhat broader framework.
Individual maturation under structural change
In Rosengren (1991a) an attempt was made directly to compare the relations between changes in music listening and television viewing during adolescence, by means of averaging and standardizing procedures applied to the MPP data collected up to 1987. (Unweighted, age-wise means were first calculated for Malmö and Växjö data separately, then for the two towns together. Finally the means were standardized to 100, while the dispersion was kept unstandardized.) The end result was Figure 4.5, showing two curves with some similarity to traditional S-curves of growth and diffusion (Brown 1989; Perry 1992). The curves were interpreted, in terms of development theory, as reflecting biological, cognitive and social development.
According to a basic observation by Brown et al. (1974), the individual's need structure during late childhhood and early adolescence changes, in that a set of intermittently felt needs (‘spasmodic’ needs in the expressive

Figure 4.5 Development of TV viewing and listening to music “during adolescence, all Malmö and Växjö panels, 1976–1987
terminology used by Brown and his co-authors) are added to a set of more or less constant needs. These new, spasmodic needs naturally call for increased control of the adolescents' environment. In terms of the typology of socialization patterns discussed in Chapter 1 (Figure 1.4), the socializees are no longer satisfied being objects. They want to be subjects.
In terms of media use, all this means that mere access to a given medium is no longer enough. Adolescents feel they need to control media use themselves. Consequently, they increasingly try to escape the relatively tight control of the family, turning instead to the peer group, which provides better opportunities for satisfaction of this new set of needs. At the same time, they turn from the family medium of television to the peer medium of music, which comes to them by way of media more controllable by them (primarily radio, record-player, tape recorder, CD-player, and VCR). What actually takes place is a thorough-going functional reorganization of adolescent media use called forward by basic biological, cognitive and social development. This functional reorganization is neatly illustrated by the two curves of Figure 4.5, based on MPP data about television viewing and listening to music collected during the period 1975–1987. In terms of the three basic types of temporal effect – age, situation, and generation – the figure illustrates a strong age effect on individual use of the basic mass media.
Now, Figure 4.4 suggests that Figure 4.5 may no longer offer a valid picture of development and media use during childhood, adolescence and early adulthood. Biological and cognitive development is still the same among young humans, of course, but the media structure of modern society is changing. Consequently, young people develop their social and cultural identities by means of different media than previously. Figures 4.6 and 4.7 nicely illustrate this basic change.
In principle, both figures are built in the same way as Figure 4.5. Figure 4. 6 synthesizes data collected during the first three waves (1976–81). Figure 4.7, besides covering a longer period of time, is built on data from cohort V69 (the 11 year olds that have also provided two data points among the scores of points on which Figure 4.6 is built). Just like Figure 4.5, Figure 4.6 does not include video viewing and cable/satellite viewing (since both phenomena were almost unknown in Swedish homes of that time period), while Figure 4.7 includes not only broadcast television viewing, but also time spent before the screen enjoying cable and video viewing – that is, from the time period when these media were made available to our youngsters (in Figure 4.7, from the age of 14). Now, what do these figures tell us?
Let's first compare Figures 4.5 and 4.6. The latter, of course, covers the same time period and the same period of life as the left-hand part of the former, with the important exception that there is no data for age 14 (those data in Figure 4.5 stemming from later cohorts). The somewhat longer time intervals of Figure 4.6 is why the typical S-character of the curves of Figure 4.5 has disappeared. Otherwise, the main tendency is intact: a drastic

Figure 4.6 Development of TV viewing and listening to music during the first three waves of data collection, 1976–1981
reduction of TV viewing, and equally drastic increase of listening to music.
In the left-hand side of Figure 4.7, we find much the same tendencies. In the right-hand side of the figure, however, things are different. After the age of 14, the regular decline in TV viewing is suddenly replaced by an increase, in the end bringing the combined TV and VCR viewing up to the level of music listening (in the relative terms of the figure, of course). That is, at the age of 21, TV viewing is back at the very high level found at age 11, while at the same time listening to music at age 21 has roughly doubled since age 11.
What we see is not a situational effect of the type exemplified by the temporal drop in music listening in the 1980/81 season. It is not just a short spell of rain or sunshine. It is more like a change of climate, a change of structure. That change has at least four important components.
Firstly, of course, it is due to the breakthrough of CTV and VCR in Sweden. Secondly, is the fact that an ever-increasing portion of teenagers started getting a TV set of their own. Thirdly, CTV and VCR offer a type of content which had not been prevalent in the Swedish monopoly public service television: programmes aimed directly at people around 20 years old, preferably video music distributed by VCR or cable. Fourthly, in the face of the vigorous competition from CTV and VCR, the Swedish public service

Figure 4.7 Development of TV and VCR viewing and listening to music from age 12 to age 21 in panel V69
television slowly adapted its output, so that it was also more suited to the taste of a previously neglected segment of the public: those aged 15–25. In more abstract terms, there was a structural change from a system characterized mainly by supply/output control to one characterized to some extent by demand/receiver control. (In the terms of Figure 1.8, the change was a transition from a semi-independent reward system to a heterocultural one.)
Together, the four types of structural change taking place during the 1980s moved the TV medium within the control of young people, now offering content well suited to their tastes. As a result the age-related media habits of young people were subject to a radical change, illustrated in the contrast beween the media habits of the cohorts in Figures 4.4, 4.6 and 4.7.
The question immediately following is whether – and if so, how – this change in age-related effects will prove constant, so that it will materialize in a more or less permanent difference between the media habits of generations growing up before and after the still ongoing structural change in the Swedish media scene. Will there be a generational effect on media habits, visible not only for a time between young people of different generations, but also in the long run between middle-aged and elderly people from different generations? Will the ‘generational filter’ discussed in Chapter 1 and shown in Figure 1.6 become operative?
We cannot tell, of course, but it would hardly seem to be an unreasonable assumption that the changing pattern of age effects observed will be gradually cemented in a generational effect, remaining until future structural change will bring about new long-term changes in media habits. After all, the previous pattern to a large extent was caused by young people's wish to enjoy full control of the medium so important to them: music. Regardless of whether or not, as they grow older, they want to continue with their high consumption of music, there is no reason to leave at an adult age the medium they will have been preferring since they were toddlers.
The enormous amount and breadth of future TV output distributed by way of public service and commercial broadcast, cable and satellite TV and by way of the VCR – easily available news and commentary, fiction and music alike – will have no counterpart in any other medium. Very probably, therefore, the TV viewing pattern being established will to an increasing extent become similar to the radio listening pattern already prevailing: a choice among channels rather than programmes, occasional switching between channels for information and commentary instead of music and entertainment – and very probably a heavy dose of popular music in whatever medium viewed and listened to.
It is also likely, finally, that the ongoing change in the media structure has already contributed, and will continue to contribute, to a tendency which during the last few decades has grown increasingly stronger: the tendency to define and express one's lifestyle in terms of musical taste.
In Sweden (as in many other countries), relatively early, striking examples of this tendency are represented by the ‘jazz’ and ‘swing’ crazes occurring around 1920 and 1940, respectively, and bringing many good citizens into what has later been called a moral panic (Roe 1985). In the early 1920s, of course, radio broadcasting was only in its infancy, and there were only few and primitive gramophones. Even in the early 1940s – with television still waiting in the wings, and neither the VCR nor the CD yet invented – the medium for popular music was the gramophone rather than the staid Swedish public service radio of the time (which offered one hour of gramophone music, starting with a military march, an accordion piece somewhere in the middle and rounding off with a classical piece or two).
In their most outspoken forms, therefore, the jazz and swing crazes as sources of an individual lifestyle probably concerned only very small minorities, just as is today the case with a number of narrowly defined specialties in modern popular music. What has changed during the last fifty years or so is that recorded and mass distributed music is widely used to define and express one's lifestyle (see, for instance, Innis 1992: 283 ff). This is so not only among advanced connoisseurs of a particular special taste. Even those travelling in the middle of the road use some variant or other of mainstream music several hours a day to define, express and maintain their more or less consciously chosen lifestyle (see Chapters 10–12).
The thorough-going structural change of the Swedish mass media scene which started in the 1980s and has not yet finished will no doubt help to reinforce this secular tendency. For large parts of the population – probably a majority – music will form an integrating element of their lifestyle. The choice whether to receive that music by way of radio, cable or broadcast television, VCR or CD or tape recorder will depend on the time of the day, the other activities simultaneously exercised, and – as always – a host of contingencies.
Class, gender and media use under structural change
So far we have been discussing the interplay between, on the one hand, structural change and time-related effects (such as those of age and generation), and on the other, television viewing and listening to music. We shall now turn to the interplay between influences from structural change and influences stemming from the two positional variables of gender and social class.
In most societies, working-class people watch more television than middle-class people, and men more than women. This is also what we have found in our MPP studies. Working-class boys are the most avid watchers; middle-class girls, the least avid, with middle-class boys and working-class girls coming in between (Rosengren and Windahl 1989: 25; Roe 1992). With listening to music, it's somewhat more complicated. In previous MPP studies we have found that working-class girls tend to listen the most; middle-class girls, the least. The differences are much less outspoken, though, and they tend to vary over time (Rosengren and Windahl 1989: 107).
Whether, and to what extent, such patterns are affected by changes in the media structure is a quite different question, of course, and it is also a much more difficult question to answer. As is so often the case, once the question is posed and analysed, it dissolves into a number of different questions, each with an answer of its own. How are the relationships to be conceptualized, for instance? - As differences between levels? - If so, in absolute or relative terms? - Or, perhaps, in terms of some coefficient or other? - And if so, with or without controls for one or more relevant variables?
Results from a thorough-going analysis of data from later MPP waves suggest that with respect to TV viewing, the general pattern of relationships between class, gender and media use is much the same before and during the ongoing structural change, while the pattern may be changing when it comes to the relationship between social class, gender and music (Höjerback, 1990; see also below).
Actually, it is probably too early to issue any definitive statement about the effect of the changing media structure on the relationship between basic positional variables such as gender and social class, and central socio-cultural activities such as TV viewing and listening to music. It could be expected, however, that during periods of structural change such relationships should be more stable than, say, the overall amount of consumption of this or that medium in the population at large.
After careful consideration of a quite considerable amount of various analyses, it was decided that the best way to approach the problem would be to present a few simple tables based on partial correlations between social class, gender, TV viewing and listening to music. Tables 4.1–4.4, provide
Table 4.1 Relationship between gender and TV viewing, 1976–19901
| 1976/77 | 1984/85 | 1989/90 | |
| Grade 5 | -.21*** | – | -.14*** |
| (-.16***) | |||
| Grade 9 | -.27*** | -.34*** | -.22*** |
| (-.36***) | (-.20***) |
1. Partial product-moment correlations, controlling for social class. Coefficients within parentheses refer to viewing including VCR.
Table 4.2 Relationship between social class and TV viewing, 1976–19901
| 1976/77 | 1984/85 | 1989/90 | |
| Grade 5 | -.25*** | _ | -.15*** |
| (-.16***) | |||
| Grade 9 | -.28*** | -.29*** | -.25*** |
| (-.26***) | (-.27***) |
1 Partial product-moment correlations, controlling for gender. Coefficients within parentheses refer to viewing including VCR.
Table 4.3 Relationship between gender and listening to music, 1976–19901
| 1976/77 | 1984/85 | 1989/90 | |
| Grade 5 | -.09 | _ | .11* |
| Grade 9 | .05 | .14 | .25*** |
1 Partial product-moment correlations, controlling for social class. Coefficients within parentheses refer to viewing including VCR.
Table 4.4 Relationship between social class and listening to music, 1976–19901
| 1976/77 | 1984/85 | 1989/90 | |
| Grade 5 | -.05 | _ | .01 |
| Grade 9 | .13 | .09 | -.01 |
1. Partial product-moment correlations, controlling for gender.
information about the relationships between gender and social class, and TV viewing and listening to music among fifth- and ninth-graders, respectively. In each table, one of the two positional variables is conceptualized as the independent one, while the other is being controlled for. There are three points of measurement, but in the middle measurement, no data were available for the fifth-graders (see Figure 3.2). In the right-hand part of the TV tables, the coefficients have been calculated both with and without the inclusion of VCR viewing.
Let's start with gender and TV viewing. The coefficients of Table 4.1 tell us that by and large there has been no drastic change in the relationship between gender and TV viewing before and after the period of structural change. As before, girls watch less TV than do boys. The relationship may have become somewhat weakened, however, especially among children aged 11–12. This is the case whether VCR viewing is included or not. Turning to the relationship between social class and TV viewing (Table 4.2), we find, as expected, that working-class children watch more than middle-class children. Here, too, the importance of the positional variable seems to have been reduced for the fifth-graders, but not for the ninth-graders (again regardless of whether VCR is included or not).
With music, however, it is another matter. Here the volatility is much more striking. The coefficients for gender and listening among fifth-graders change sign between 1976 and 1989: first boys listen somewhat more than girls, then it is the other way round. Among the ninth-graders, girls listen more to music than boys all the time; the strength of the relationship increases linearly over time, however, and in 1989 it has become significant at the.001 level.
Table 4.5 Listening to music in cohort V74, grade 9, 1989 (hrs/week)
| Gender | ||
| Social Class | Boys | Girls |
| Working class | 14.9 | 18.7 |
| (57) | (80) | |
| Middle class | 13.7 | 20.4 |
| (144) | (122) | |
| Upper class | 11.2 | 24.0 |
| (52) | (44) | |
Source: Höjerback (1990:18)
When it comes to music and social class, the pattern is even more complicated. According to Table 4.4, there is next to no relationship found anywhere, but that result is actually an artefact, stemming from complex interactions between the variables of gender and social class in their influence on listening to music. On the one hand, girls listen more than boys regardless of within which social class we compare them; on the other, working-class boys listen more to music than do middle-class boys, while working-class girls listen less than middle-class girls. This interaction is spelled out in Table 4.5 corresponding to coefficients.25*** and -.01 in Tables 4.3 and 4.4, respectively. (The four three-dimensional tables corresponding to the remaining four pairs of coefficients in Tables 4.3 and 4.4, in their turn, show somewhat different, but in principle the same patterns of interaction.) We may conclude, then, that while the influence of gender on listening to music has become stronger and more consistent, so that girls now listen more to music than do boys, the influence of class on listening to music remains more ambiguous.
Trying to summarize these complicated patterns we find that, as a result of the ongoing changes in the media structure, the influence of both gender and social class on TV viewing may have been somewhat reduced for fifth-graders but not for ninth-graders, while the influence of gender on music has become stronger, so that, regardless of class, girls now listen more than boys. The influence of social class on music is ambiguous, and no clear change has been found. Especially among old adolescents, then, TV viewing is still very much determined by the two positional variables of social class and gender, while for music, gender seems to emerge as the most consistently important determinant.
Table 4.6 Total amount of media use in cohort V74, grade 9, 1989 (hrs/week)
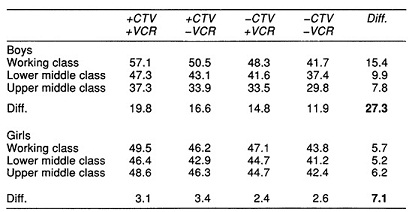
In an attempt to characterize the dynamics of the overall situation, Höjerback (1990: 27) analysed the relationship between, on the one hand, gender and social class, and, on the other, young people's total media use in families with and without access to CTV and VCR (total media use including broadcast TV, CTV, VCR, radio, music, and dailies). Her results are summarized in Table 4.6. Since there was no possibility of distinguishing between primary and secondary media use, and since obviously there is a considerable overlap between the categories (music coming to us by way of all electronic media), the absolute level of consumption per se is not a very interesting figure. Very interesting, however, are the considerable differences in patterns of media use existing between, on the one hand, boys and girls of different social origin, and on the other, adolescents with and without access to CTV and VCR.
The introduction of the new media of CTV and VCR seems to have struck differently among boys and girls. Working-class boys, much more than upper-middle-class boys in particular, took the new media (and especially CTV) to their hearts, which sent their overall media consumption soaring. Among the girls, the impact was less, and for them, the VCR seems to have been at least as important as the CTV. By and large it could be said that the overall variation in media use is much larger for boys than for girls. Actually, there is only little variation to be found among the girls, and what variation there is, is stronger between girls with and without access to CTV and VCR than between girls of different social origin (controlling for class and access, respectively). With boys, both sources of variation are quite strong, and their total influence is striking indeed. Working-class boys with access to CTV and VCR spend twice as much time with media than do upper-middle-class boys without such access (some 57 hours vs. some 30 hours). The corresponding difference for girls is only about seven hours.
The end result of these complex processes of interaction between social class, gender and a changing media structure, then, is that in quantitative terms, at least, the girls stand out as much more homogeneous in their mass media use than the boys. (The overall difference between their highest and lowest category is only 7.1 hours a week, vs. 27.3 hours for the boys.) The quite impressive difference in total mass media use between working-class boys with access to the new media and upper-middle-class boys without such access, no doubt must add considerably to already existing differences in the whole way of living of these social groups.
Changes in media structure, then, seem to have added to already existing differences between young people from different walks of life. Whether these and other results will remain stable as individual media use gradually adapts to old and new changes in media structure is hard to tell, especially as the period of change has not yet finished. Perhaps during years to come there will not be a period of stability in media structure corresponding to that which prevailed in many West European countries during the 1960s, 1970s and early 1980s. Under such premises, the importance of continued longitudinal studies of young people's media use stands out as ever more important.
SUMMING UP
The study of individual media use under structural change is no simple matter. A number of theoretical, conceptual, methodological and technical problems must be solved; several key decisions must be taken before presenting any results.
Theoretically, the distinctions made in Chapter 1 must be heeded. Change in media structure is change in one sector of the overall societal structure. The social structure as represented by the four basic dimensions of age and gender, class and status and their influence on individual action may or may not be affected by that change.
Conceptually, the difference between different aspects of media use (amount of use, type of content used, type of relation established to content used, type of context of media use) must be heeded, as well as the distinction between media use conceptualized as habit and as actual behaviour.
Methodologically, the research design used should offer some possibility of differentiating between the three basic aspects of temporality: age, generation and situation.
Technically, considerable attention should be given to the simple fact that different operationalizations will affect the absolute level of media use reported. Some thought should also be given to the fact that differences in operationalizations may very well also affect the relationships reported between media use and a number of dependent and independent variables.
In this chapter, media use has been studied in terms of its most basic aspect: amount of use. Use, in its turn, has been regarded in terms of habits. Since habits are more stable than actual behaviour, the more accidental and ephemeral aspects of media use have been left outside our equations. This choice of conceptualization should make our results more reliable and stable over time.
Methodologically, we have been able to draw on the most powerful design available to survey research: the combined cross-sectional/longitudinal design described in Chapter 3. The influence of differential operationalizations have at least to some extent been neutralized by means of standardization procedures; some remaining differences were revealed by the combined cross-sectional/longitudinal design. By means of the design we were also able to detect a situational effect on listening to music among Swedish adolescents which otherwise might well have been interpreted as an effect of age or generation.
The most basic problems discussed in the chapter, however, have concerned the relationship between changes in media structure as part of the overall societal structure and individual media use as determined by positions in the social structure (age, gender and social class).
We first noted that effects of changes in the media structure seem to reach young people more rapidly than old people – at least in the sense that young people gain access to new media appliances more quickly than do old people. We then proceeded to a renewed analysis of a fact often mentioned in previous research, namely, that the maturation processes playing such an important role in the lives of young people also exert strong influence on their media habits. During adolescence – characterized as it is by ‘spasmodic’ needs for mood control – the need for expressive media contents such as music, as well as for individual control of media use, suddenly grows much stronger.
Concretely, this means that adolescents feel they need not only access to music media; they also need tight control of their contents. Since in the 1960s and 1970s Swedish television did not offer much music, and since adolescents were seldom in control of the living-room TV set, they left television, instead turning to listening to music which reached them by way of other media, primarily radio and the tape recorder. All this changed, however, in the early and mid-1980s when CTV and VCR entered the scene, when there was an old and/or small TV set available in their own room, and when even Swedish public service TV started to offer popular music for young people. Expressive media content was as important as before to adolescents; now they could have it also by way of television. The pattern of influence on individual media use exerted by the positional variable of age, then, was drastically changed, so that the heavy reduction in TV viewing primarily observed during the teens is no longer to be found.
An intriguing question is whether this age-related change in patterns of media use will gradually turn into a generation effect. Only continued research will be able to provide an answer to that question. Much the same goes for potential changes in the influence exerted by those two important positional variables, gender and social class. As far as we can tell today, both gender and social class seem to keep their influence on the use of television (gender possibly having become somewhat less important). Contrariwise, gender may have become more important as a determinant of listening to music, in that adolescent girls and young women now seem to listen more to music than do adolescent boys and young men. Although there has hardly been any change per se in the social structure as defined by the positional variables of age and gender, social class and status, a change in the media sector of the societal structure may thus have influenced the strength and character of the influence exerted by a positional variable in the social system of action.
In the following chapters, the perspective will be broadened; the analyses will be sharpened and deepened in various ways. Not only causes but also effects of mass media use will be scrutinized. A close look will be taken at stability and change in media use. Not only societal structure and social position but also individual characteristics will be regarded as determinants of media use. And individual media use will be regarded as one component of those complex patterns of actions called lifestyles – in their turn determined by individual characteristics such as individually held basic values and more or less specific phenomena at the attitudinal level (such as interests, tastes, principles, convictions).
NOTE
The figures were drawn by Dr Ulla Johnsson-Smaragdi, who in Chapter 6 will use some of them for basically different purposes.
REFERENCES
Anshelm, M. (1993) ‘Video’, in U.Carlsson and M.Anshelm (eds) Medie-Sverige 1993, Gothenburg: NORDICOM.
BBC (1987-93) Annual Review of Audience Research Findings, London: John Libbey.
Berg, U. (1982) ‘Mediebarometern 1982’, Pub informerar December.
Brown, J.R., Cramond, J.K. and Wilde, R.J. (1974) ‘Displacement effects of television and the child's functional orientation to media’, in J.G.Blunder and E.Katz (eds) The Uses of Mass Communications, Beverly Hills, Calif.: Sage.
Brown, M.A. (1989) ‘Diffusion’, in E.Barnouw (ed.) International Encyclopedia of Communications 2: 31–36, New York: Oxford University Press.
Burnett, R. (1990) Concentration and Diversity in the International Phonogram Industry, Gothenburg: Department of Media and Communication.
–– (1992) ‘The implications of ownership changes on concentration and diversity in the phonogram industry’, Communication Research 19: 749–769.
–– (1993) ‘Fonogram’, in U.Carlsson and M.Anshelm (eds) Medie Sverige 1993, Gothenburg: NORDICOM.
Comstock, G. and Paik, H.J. (1987) Television and Children: A Review of Recent Research, Syracuse, NY: ERIC.
Cronholm, M. (1993) ‘Satellit-och kabel-TV, in U.Carlsson and M.Anshelm (eds) Medie Sverige 1993, Gothenburg: NORDICOM.
Csikszentmihalyi, M. and Kubey, R. (1981) ‘Television and the rest of life’, Public Opinion Quarterly 45: 317–328.
Gunter, B. and Svennevig, M. (1987) Behind and in Front of the Screen, London: John Libbey.
Hasebrink, U. and Krotz, F. (1992) ‘Muster individueller Fernsehnutzung’, Rundfunk und Fernsehen 40: 398–411.
Höjerback, I. (1990) ‘Nya medier – nya klyftor’, Lund Research Papers in the Sociology of Communication 27, Lund: Department of Sociology, University of Lund.
Innis, P.H. (1992) The Emergence of Rocknroll in American Popular Music, Hanover, NH and London: Wesleyan University Press.
Johnsson-Smaragdi, U. (1983) TV Use and Social Interaction in Adolescence. A Longitudinal Study, Stockholm: Almqvist & Wiksell International.
Kubey, R. and Csikszentmihalyi, M. (1990) Television and the Quality of Life, Hillsdale, NJ: Lawrence Erlbaum.
Lööv, T. and Miegel, F. (1989) ‘Vardagsliv, livsstilar och massmedieanvändning. En studie av 12 malmöungdomar’, Lund Research Papers in the Sociology of Communication 16, Department of Sociology, University of Lund.
Lööv, T. and Rosengren, K.E. (1988) ‘The experience sampling method (ESM)’, Lund Research Papers in the Sociology of Communication 9, Department of Sociology, University of Lund.
Perry, R.W. (1992) ‘Diffusion theories’, in E.F.Borgatta and M.L.Borgatta (eds) Encyclopedia of Sociology 1, New York: Macmillan.
Peterson, R.A. and Berger, D.G. (1975) ‘Cycles in symbol production: The case of popular music’, American Sociological Review 40: 158–173.
Riley, M.W. (1992) ‘Cohort perspectives’, in E.F.Borgatta and M.L.Borgatta (eds) Encyclopedia of Sociology, New York: Macmillan.
Roe, K. (1985) ‘The Swedish moral panic over video 1980–1984’, Nordicom Review 1:20–25.
–– (1992) ‘Different destinies – different melodies: School achievement, anticipated status, and adolescents' tastes in music’, European Journal of Communication 7: 335–357.
Rosengren, K.E. (1991a) ‘Media use in childhood and adolescence: Invariant change?’, Communication Yearbook 14: 48–90, Newbury Park, Calif.: Sage.
–– (1991b) ‘How do you feel?’ (Review of Kubey, R. and Csikszentmihalyi, M. (1990) Television and the Quality of Life), Journal of Communication 41 (1): 143–145.
Rosengren, K.E. and Windahl, S. (1989) Media Matter: TV Use in Childhood and Adolescence, Norwood, NJ: Ablex.
Ryder, N.B. (1992) ‘Cohort analysis’, in E.F.Borgatta and M.L.Borgatta (eds) Encyclopedia of Sociology, New York: Macmillan.
Sonesson, I. and Höjerback, I. (1989) ‘Skolungdomars medievanor fore och efter videon’. Lund Research Papers in the Sociology of Communication 12, Department of Sociology, University of Lund.
van der Voort, T.H.A. and Vooijs, M.W. (1990) ‘Validity of children's direct estimates of time spent television viewing’, Journal of Broadcasting & Electronic Media 34(1): 93–99.
Webster, J.G. and Lichty, L.W. (1991) Ratings Analysis. Theory and Practice, Hillsdale, NJ: Lawrence Erlbaum.
Weibull, L. (1985) ‘Structural factors in gratifications research’, in K.E.Rosengren, L.A.Wenner and P.Palmgreen (eds) Media Gratifications Research. Current Perspectives, Beverly Hills, Calif.: Sage.