
Chapter 6
Models of change and stability in
adolescents' media use
Ulla Johnsson-Smaragdi
STABILITY AND CHANGE
No doubt Sweden has changed during the last decade — fast, thoroughly and seemingly irrevocably. To varying degrees these changes affect many different sectors of society. One sector radically altered is the Swedish media scene. During the last decade a series of both powerful and attractive mass media have became available to the public at large. The VCR was introduced in the beginning of the 1980s; in the middle of the decade, satellite and cable television became increasingly diffused; the access to personal computers in the home has increased, as has also the number of games played on these computers or on TV and video — all of them quickly adopted, not least by families with children and adolescents. At the same time access to CD-players, personal stereos (Walkmans) and tape recorders has increased, especially among adolescents (see Chapter 2).
As a result of these processes, the entire range of mass media and mass media fare has been radically enlarged. There are now more options as to what and when to watch or listen, where to see/listen to it, together with whom and through which medium. Such changes in the media structure inevitably affect individual use of mass media. More than before individuals are now able to decide about their amount of use and to compose their own ‘media menu’ with their own preferences and likings. Individual media use has to be comprehended against the background of the media structure existing at a given point in time.
Regardless of what changes may be going on in this or that media structure, the period from childhood through adolescence into adulthood is generally turbulent. So much change occurs so fast in these years. Young people develop at a different pace along biological, cognitive, social and emotional dimensions. As a consequence, their use of, and their relations to, the media are also subject to continuous change.
Given the combination of a turbulent period of life at the micro level and a period of structural change at the macro level, will there be any persistent patterns of media use? In order to be stable over time and space, patterns of media use probably have to be firmly anchored in basic biological, psychological and social conditions. Variations in such patterns may depend on variation in structural conditions, for example, on the ever changing balance between family, peers, school and the mass media.
An important problem to be discussed in relation to stability and change is when something may be considered stable or changing. Stability and change are not to be regarded as fixed properties, but rather as a continuum with two opposite poles. If anything, stability and change are a matter of degrees — we are always more or less stable, more or less changing.
There are also different types of stability. Stability may be referred to in absolute or relative terms, at the individual or aggregate level, with reference to rank or structure. Usually we distinguish between four types of stability, namely, ‘relative’, ‘level’ and ‘ipsative’ stability, and ‘structural in variance’ (Mortimer et al. 1982: 266–270; cf. Johnsson-Smaragdi 1983: 84, 1992; Rosengren 1991: 54).
Relative stability is stability in individuals' ranks or differences with respect to a given phenomenon. It indicates that, in relation to other members of the group, individuals retain much the same position over time (e.g., with respect to amount of television viewing over time). Level stability is stability in the quantity of a phenomenon over time (e.g., quantity of television watched). Ipsative stability is stability in the ordering of attributes of an individual over time, examining the relative importance of, for example, various interests at different points in time. Structural invariance, finally, refers to the degree of continuity in the structure of the phenomenon under study. Structural invariance exists, for example, when there is a persistent pattern of relations, independently of time period and cohort.
Structural invariance may be expressed in qualitative terms (the overall structural pattern is the same) or in quantitative terms (the coefficients are of the same magnitude) (Rosengren 1991: 85). Both aspects are important when considering the stability of a structure, even if the former stands out as the most crucial criterion.
When analysing the stability or change of a certain phenomenon, access to data that permit both analyses over time and the opportunity to undertake replications is mandatory. Both cohort and panel data are required. A combination of cross-sectional and panel studies carried out in different locations admits phenomena to be compared over time and space — within, as well as between, panels and cohorts. Since panels admit coupling of data at the individual level, they admit strong causal modelling of causes and effects, including long-term effects. By comparing panels based on different cohorts, it is possible to study the structural stability and temporal invariance of longitudinal models. By comparing panels from different locations, it is possible to study invariance over space.
In all empirical research, the way concepts and variables are measured is, of course, of utmost importance. In longitudinal research this becomes even more crucial. A given concept must cover the same phenomena over time -even if the manifest indicators of a latent concept or variable sometimes have to be changed, for empirical, theoretical or methodological reasons.
MEDIA USE IN CHILDHOOD AND ADOLESCENCE
Young people are not born with an innate tendency to use media in certain ways. They are successively socialized to use the media as they do. The home environment — shaped by social class, parents' education, interaction and communication patterns in the family, attitudes towards, and use of, different media and by a host of other phenomena — influences media habits and media relations. Other, increasingly important socialization agents include peers, the school and the neighbourhood. Media habits are formed early in life, continue to develop and change throughout childhood and adolescence, but do not become established until later in life.
Within a given society, the amount of time spent by individual children and adolescents on television and other media differs widely, depending on a variety of background variables, as well as on social and individual characteristics and interests. Swedish children generally start watching television early in life. Already at the age of two, children show an interest in television. At the age of three they pay closer attention to the programmes, and many of these very young children have even become regular viewers. The hours spent in front of television gradually increase with age until late childhood. From this age on, the time devoted to television is again reduced, reaching a minimum during the middle and later teenage years. Instead, listening to music becomes ever more important (Rosengren and Windahl 1989: 23; Sonesson 1989: 50; Rosengren 1991: 55).
In the late 1980s, however, this general pattern seems to have become less pronounced, in that during late childhood and adolescence television viewing no longer decreases as flagrantly as before. Thanks to cable television, foreign satellite programmes are now accessible most of the day, featuring a content which is often very attractive to children and adolescents (Filipson and Rydin 1989; Höjerback 1990; see also Chapter 4 above). Children and adolescents turn to satellite television more than do other groups. This is so in Sweden, and probably in other countries as well (see, for example, Becker and Schoenbach 1989).
Simplified, it may still be said, however, that during the adolescent years there generally occurs a dramatic shift in media use. Adolescents tend to reorient their media use by reducing their use of mainly home-oriented media, like TV and books, while at the same time they tend to increase their use of more peer-oriented ones, like VCR and music.
While the specific ages at which the peak in viewing and the following decline is located may vary, a similar television viewing pattern may be found in many countries. This invariance in the viewing pattern of children and adolescents from various countries is found despite the fact that the overall level of television consumption varies a great deal, reflecting the amount of television output, the composition of the total media scene and — perhaps most importantly — subcultural values as well as the overall culture permeating society.
STABILITY IN MEDIA
In order fully to appreciate the ongoing change in individual media use among children and adolescents caused by changes in the overall media structure, it is necessary to have access to baseline data against which new tendencies may stand out as clearly as possible. It is also necessary to realize that individual change is not even and uniform, but rather characterized by a great deal of turbulence. There are ‘sprinter’ and ‘laggards’ among the adolescents, changing their media use faster or slower than the rest of the young audience.
If a group of adolescents continues to view about the same average amount of TV over a certain time period, its viewing is characterized by a high level of stability. Nothing is said about the relative stability, though. There may still be a lot of turbulence and change in viewing time by some individuals within the group — among these the laggards and sprinters are to be found. Whether the TV viewing is stable or changing in one or both of these aspects, the structural relations between viewing TV and using other media — or between TV viewing and other aspects of behaviour — may still be invariant, or they may be changing in qualitative as well as in quantitative terms. Level stability or level change, relative stability or relative change, structural invariance or structural change — the possible combinations are manifold.
Thus, behaviour may be stable or it may be changing with time. If changing, the process may be due to age, to generation or to situation (see Chapter 4). As discussed above, media use changes as small children become older and then grow into adolescents — an effect of age. This effect is best studied by means of longitudinal data covering individuals over an extended period of time. Likewise, the time period in which you are born, for example, if you are born in the early 1960s or in late 1970s, may affect the media behaviour. This generation or cohort effect is best studied by comparing the same age-groups belonging to cohorts born at disparate time periods. Finally, the historical context and media structure at a given time period may, of course, also influence how media is used — a situational effect. This effect is often hard to distinguish from the generation effect. It takes a combination of cross-sectional and panel studies to separate these two effects (see Chapter 4).
In the sections below we will successively analyse the different aspects of stability with reference to, above all, TV viewing, but also to some degree to music listening and VCR use among children, adolescents and young adults studied in the Media Panel Program (see Chapter 3).
Level stability
Figures 6.1–6.3 illustrate the stability and change in amount of TV viewing (not including VCR), music listening and VCR viewing for different cohorts and panels. The two former figures span a time period of some fifteen years, from the mid-1970s to the early 1990s, while the third figure covers the last eight years of this time period. The opportunity to follow the stability and change in media use at the aggregate level — including several panels based on different cohorts — during such an extended period of time is met with only seldom.
In Figures 6.1 and 6.2 we may study level stability in at least two respects, namely, by comparing stability for different age-groups within the same panels (cohorts) and by comparing stability for the same age-groups belonging to different panels (cohorts). By comparing within panels we may study how the use of a medium increases or decreases with age, here from childhood through adolescence to adulthood. By comparing specific age-groups we may instead study how the use of a medium changes with the time period. Thus, we may compare 15-year-old adolescents in 1976 with those of the same age in 1984 or 1989. Furthermore, it is possible to compare

Figure 6.1 Stability and change in amount of TV consumption, 1975–1991 (means)

Figure 6.2 Stability and change in amount of music consumption, 1976–1990 (means)
also the slope of the curves formed by the different panels. Does media consumption in the different panels develop similarly, making the curves take on the same general form?
The overall impression conveyed by a first review of Figures 6.1 and 6.2 is that level stability seems to be low, in the quantity of both television watched and music listened to. But is the level stability equally low both within panels and between specific age-groups?
Comparing within panels, we find considerable level instability both in television viewing and music listening: television viewing decreases, while music listening increases. When approaching adulthood this general trend seems to be broken. Around the age of 20, television viewing slowly begins to increase again, while music listening more or less tends to stabilize. This may be referred to as an age effect. (We may note here that music consumption is rather crudely measured, as the habit of listening to music in number of days per week — the only comparable measure available over the period of some fifteen years.)
There are results suggesting that from the middle of the 1980s the reduction in television viewing was less pronounced than in the beginning of the decade (Hqjerback 1990; see Chapter 4). If this is the case it ought to be evident from the slope of the curves formed by the panels. By comparing the two earlier panels (V63 and V65) with the two latter (V69 and M69), indications of this might be found. The slopes (that is, the decrease) have indeed become less pronounced in later years. There is thus a trend towards a somewhat higher overall level stability in viewing by age, which may be due either to a situational or a generational effect. This is the combined result of a lower viewing level among the 11 year olds in 1980 than in 1976, and a higher viewing level among the 15 year olds in 1985 than in 1980.
As for music listening there seems to be indications of the reversed tendency, that is, the increase in listening with age has become more pronounced in later years. However, there are several problems in comparing music listening over time as evident from Figure 6.2. For instance, music listening in 1980/81 stands out as something fairly apart. It is an effect of the situation at this concrete time period (Burnett 1990: 135), an effect impossible to detect without access to a combined cross-sectional and longitudinal design. Still, it is possible to compare the increase in amount of listening between 13 and 15 years of age in the panel of V63, with the same ages in the panel of M70 and also with the increase between 14 and 15 years in the panels of V69 and M69. It indicates that the increase in music listening during adolescence was more pronounced in the middle of the 1980s than it was in the late 1970s.
From comparing within and between panels we now shift instead to comparisons between cohorts, or specific age-groups. We have access to several cohorts made up of 11- and 15-year-old adolescents, which we may compare with respect to their viewing and listening levels over the time period of some fifteen years covered by our data.
The 11 year olds are the most keen television viewers, and, according to their own estimates, this age-group is marked with considerable level stability. They view about as much television in 1989 as they did 1980 and 1976. There is only a slight decrease visible in their viewing level over this approximately fifteen-year time period. However, the expansion of television output has obviously been followed by an increase in consumption among the 15-year-old adolescents. Cable television is now available to the greater part of the population, providing expanded channel and programme options. Among adolescents, music video programmes are especially popular. This increase in viewing began in the middle of the 1980s, but is obvious until the end of the decade. It results in a lower level stability for television viewing in this age group. Also music listening has increased during the time period of study among both 11 and 15 year olds. The increase in listening is less marked than for television viewing, but clearly noticeable.
Figure 6.3 shows amount of VCR viewing. In Sweden the medium began its diffusion in the early 1980s, and it was rapidly diffused to a fairly large segment of the population, especially to families with children and adolescents. By 1984, 36 per cent of these households had access to a VCR. Large
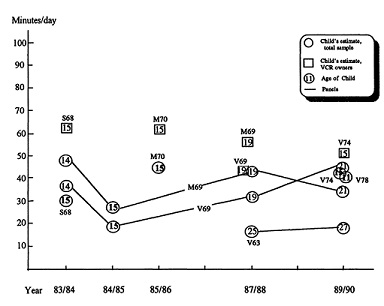
Figure 6.3 Stability and change in amount of VCR consumption, 1983–1990 (means)
geographical variations in access existed, however, especially between large cities and small towns or rural areas. In Malmo, for example, 45 per cent of households with children owned a VCR at this point in time, compared to 30 per cent in more rural areas. In 1989, VCR ownership in Malmö had risen to about 75 per cent of households with adolescents.
Stability in VCR use during this period is very difficult to discern, as the medium was rapidly diffusing among the population. This is true especially for comparisons within panels. We had better stay content to compare VCR use in specific age-groups within different cohorts. Best suited for such a comparison are the 15 year olds, since for this age-group we have measurements from both the middle and the end of the 1980s. Among the total sample, containing both VCR owners and non-owners, VCR use has increased slightly during the period, from about half an hour a day to about three-quarters of an hour. But this increase among the total sample also mirrors the increase in ownership. Let us compare this with VCR use among VCR owners only. We then notice that the use in the ownership group has actually declined. This indicates that the early owners were also the more interested ones and consequently used the medium to a larger extent. In 1989, when about 75 per cent of the households with children had a VCR in their home, there are also less interested viewers among this group, and more irregular viewers.
Relative stability
Relative stability shows the individual's stability in his/her position within a given group. If the whole group is changing uniformly, with little fluctuation in the relative positions of group members, relative stability is said to be high. (Nothing is said about the amount of level change, however.)
Which degree of relative stability could we expect? It is to be remembered that in general, adolescence is a period of great changes, in physical, biological, social, emotional and cognitive terms. All these changes in interests, preferences and activities occur with differential pace within individuals as well as between individuals (Stattin and Magnusson 1990: 7 ff.; Rosengren 1991: 61). Low relative stability in television viewing indicates that individuals are not always found where they were left, that is, on either a high or low viewing level relative to the age-group.
Relative stability in TV use
The amount of television viewing changes with age. Starting from nothing, it increases from infancy to late childhood, when it tends to stabilize for a longer or shorter period of time. In adolescence a decrease in viewing tends to occur — a decrease that only some years ago was fairly drastic, but now is considerably less pronounced — only to be followed by another increase somewhat later in young adulthood. It thus seems more relevant to refer to change rather than to stability in viewing levels during this period of life.
However, there are substantial individual differences in amount of viewing. Some are regular viewers; others are more sporadic in their viewing. Some view quite a lot; others, considerably less. Such differences may be established by analysing subgroups of children and adolescents.
A quite different but related question is whether individuals tend to retain their relative positions as high, low or average viewers during their life course, or do they, in relative terms, sometimes tend to be low and perhaps irregular viewers, while at other times in life they tend to be regular high-consumers? To what extent is there individual ‘mobility’ in relative amount of TV viewing? (Note that lack of relative stability is not necessarily due to either a general reduction or to an increase in viewing time.) In order to analyse stability at the individual level, access to longitudinal data is necessary.
Which degree of relative stability could we expect? In late childhood and early adolescence great changes occur in many different areas, both physical, biological, social, emotional and cognitive. Changes in interests, preferences and activities occur with differential pace within individuals as well as between individuals. Consequently, the relative stability in television viewing could be expected to be fairly low, and especially low in the early teens, when biological development is very fast.
The existence, or non-existence, of individual stability in media use is important in relation to possible effects and consequences of that use. If the stability is low, the effects are likely to be reduced. An important question, then, is this: what is the amount of relative stability? There are many ways to answer that question. Three such ways will be presented here, each method looking at the individual stability from different points of view and with shifting degrees of abstraction:
1 Plot diagrams, showing an individual's position related to two points in time and relative to the positions of all other individuals.
2 Split the cohort and then study the transition frequencies between high and low TV consumption.
3 Longitudinal LISREL models.
Let's start with the most obvious method.
In order to analyse relative stability at the individual level, viewing at age 11 has been related to that at age 15, and viewing at age 15 to viewing at age 21. In figures 6.4 and 6.5 the relationship between TV viewing time at different ages is illustrated. Changes occurring in an individual's relative position are revealed by this analysis. The medians are marked by thicker lines in order to facilitate the interpretation. Likewise, the regression lines have been included in the plots.
By and large the diagrams in the two cohorts give the same general picture — one of great variation and dispersion. This is more true in the first diagrams
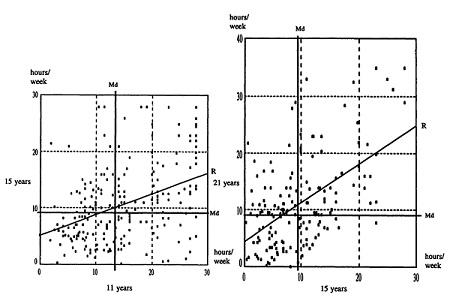
Figure 6.4 Relationship between TV consumption at different ages — hours/week. Cohort M69 (Md = median, R = line of regression)

Figure 6.5 Relationship between TV consumption at different ages — hours/week. Cohort V69 (Md = median, R = line of regression)
and less so in the latter. Individuals are less dispersed in the M69 cohort (Figure 6.4) than in the cohort of V69 (Figure 6.5), and less when they are older than when they are younger. In both cohorts the main part of the adolescents in the second diagram are concentrated towards the bottom left. This is shown by the median, which divides the scale within one-third or one-fourth of the total range at ages 15 and 21, respectively.
There is a slight tendency towards a band running from the bottom left to the top right, though, a pattern showing that as one variable increases, so tends the other one to do so. The correlations between TV viewing at different ages in the two cohorts are shown in Table 6.1.
Table 6.1 Correlations between TV viewing at different ages in two cohorts (zero-order correlations)
| Cohort M69 | Cohort V69 | |||
| Age | 11 years | 15 years | 11 years | 15 years |
| 15 years | .42 | .34 | ||
| 21 years | .28 | .54 | .40 | .40 |
It is obvious that there is a substantial number of individuals who have changed their viewing considerably from ages 11 to 15 and from ages 15 to 21. Some have increased their viewing above average, others have decreased it. Children increasing their viewing as they enter adolescence certainly go against the stream. They are not just laggards', i.e. late or slow changers; they are more ‘obstinates’. They are to be found above the diagonal, that is in the upper left part of the diagrams. Maybe these are the adolescents who have turned to satellite and cable TV, there finding programmes more suited to them. Children and adolescents decreasing their viewing more than the average may be the ‘sprinters’, but the term could then represent at least two different categories within this group.
In the first place, it could stand for those children who have decreased their viewing above average; for those who in some sense exaggerate the decreasing trend and, thus, travel farther in changing their relative position. They would be found well below the diagonal, in the bottom right. This group is the first that comes to mind when talking about ‘sprinters’. There may well be another kind of ‘sprinters’, however, those who begin to change their viewing before the rest of the group, at an earlier age. In this sense of the word, the ‘sprinters’ would be the forerunners, the leaders, of all change or trends — be it increasing or decreasing trends.
There are also stable viewers. If stable in relative terms they go with the stream — decreasing their viewing at an average rate, thus preserving their relative position within the group as expressed by the line of regression. They are ‘mainstreamers’. Others may be stable in absolute terms, not changing the amount of time devoted to TV viewing. These children would centre around the diagonal in Figures 6.4 and 6.5, unmoved by maturational trends or by changes in the media structure. Those children are really stable.
As we have seen in Figures 6.4 and 6.5 most youngsters are not high or low television viewers all the time. On the contrary, there is a good deal of individual change and mobility. This individual mobility in TV viewing time is summarized by the data in Figures 6.6 and 6.7. The individual stability has now been expressed in terms of transition frequencies between high and low TV consumption - ‘high’ and ‘low’ being defined in relative terms, as below or above the median, so that the age-related, overall ups and downs of average consumption has been controlled for. These figures demonstrate where those who at 11 years of age were classified as ‘heavy’ and ‘light’ viewers, were to be found four and nine years later. Figures on the arrows denote transition proportions; figures in the boxes, proportions of the total number originally classified as heavy or light viewers remaining in the same category or moving between categories from 11 to 15 to 21 years of age. The proportions are calculated on those remaining in the sample at each age.
The close resemblance of the transition figures is striking. At the age of 16, about two-thirds of the adolescents in both cohorts still remain in the
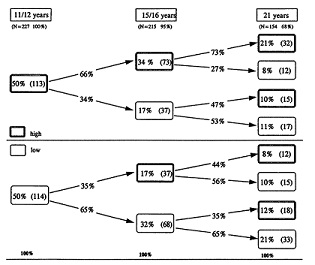
Figure 6.6 Stability and change in TV viewing over time — transition frequencies. Cohort M69 (median split of age groups)
Figure 6.7 Stability and change in TV viewing over time — transition frequencies. Cohort V69 (median split of age groups)
category into which they were classified four years earlier — regardless of whether they were once classified as high or low viewers. Of these, about two-thirds continue to be in their original category even at 21 years of age. About one-third of the adolescents change category, some between 11 and 16 years, others between 16 and 21 years of age. Some change for good, others change back and forth between the two categories.
Now, looking at the percentage of adolescents remaining in their original category, we find that from 50 per cent of high and low viewers, respectively, after four years this share has decreased to about 33 per cent, and after five more years the share is 20–25 per cent. The decrease, as well as the share of adolescents remaining constant, is remarkably similar in the two cohorts, both for high and low viewers. However, there is a somewhat different picture if we look at the adolescents that at 21 years of age remain in the same category as that into which they were originally classified at the age of 11 (V69: 22+6+10+27=65 per cent and M69: 21+10+10+21=62 per cent). These adolescents are to be considered as the ‘stable’ viewers — stable in the sense that they remain in, or return to, the same viewer category over the years.
Some adolescents, changing between the high/low categories as shown in the ‘transition figures’, were found to be very close to the median splitting the cohorts (see Figures 6.4 and 6.5). Some of these have in relative terms been classified as low at one point in time and as high at another, and vice versa. Thus, there may seem to be more change than there really is. This problem may be handled by further summarizing the amount of change and stability in adolescents' TV viewing by expressing relative stability by means of coefficients in longitudinal structural models.
In a longitudinal model it is possible to establish the longitudinal causal influence of a variable on itself. The level of relative stability in media use may thus be studied in the structural part of a LISREL model. The level of relative stability is expressed in quantitative terms, summarized by the magnitude of the coefficients attached to the arrows linking television viewing at different points in time. In Figures 6.8 and 6.9, the relative stability in TV viewing over twelve years, from the age of 9 to 21, is analysed with longitudinal data from two equally aged cohorts in two different towns in southern Sweden.
Amount of television consumption between the ages of 9 and 15 years was measured by means of six questions tapping the weekly amount of broadcast and cable television (but not VCR) viewing (number of days and hours per day on weekdays (Mon.-Fri.), Saturdays and Sundays). At 19 and 21 years of age, television consumption was measured by means of eight questions, as Friday evenings had been separated from the weekday measure and separate questions had been asked. On the basis of these six or eight questions two indices have been built, one for weekdays and one for weekends, which make up the manifest indicators (WD;WE) of the latent variable, that is, weekly TV viewing. (For a detailed discussion of these manifest indicators, see Johnsson-Smaragdi 1992.)
Gender and social background are background variables in the model (the latter being measured by an index (low-high) combining father's and mother's occupational status). The relative stability in TV consumption is thus controlled by these variables, thereby eliminating their effect on the coefficients of stability. However, we may still study the influence of these background variables on amount of TV viewing. The LISREL models show that both gender and social background directly influence the amount of TV viewing. Boys are generally viewing more television than girls, as are also children from homes characterized by a relatively low social background.
In the LISREL models in Figures 6.8 and 6.9 the stability coefficients fluctuate between.29 and.79. The degree of relative stability is, of course, dependent on the time elapsed between the measurements. The shorter the period, the higher the stability as indicated by the LISREL coefficients. By examining the total effects of TV viewing on itself over time — stripped of influences from background variables — it is possible to establish the more long-term stability in viewing. Overall the total effects (Table 6.2) indicate

Figure 6.8 LISREL model of stability and change in TV consumption between ages 9 and 21. Cohort M69 (only statistically significant paths are presented)

Figure 6.9 LISREL model of stability and change in TV consumption between ages 9 and 21. Cohort M69 (only statistically significant paths are presented)
that, relatively speaking, there is more change than stability in TV viewing. Over time the stability coefficients turn out to be fairly weak. Comparing cohorts M69 and V69 we may note that stability in viewing is somewhat higher in the former cohort than in the latter, especially in childhood and early adolescence. The long-term influence from early viewing on later viewing in early adulthood is, however, stronger in cohort V69.
Table 6.2 Total effects from earlier TV viewing on later viewing in two cohorts (LISREL coefficients)

The relative stability in TV viewing may be compared with the relative stability in, for example, school grades. In cohort V69 the stability in TV viewing between ages 14 and 15 years (as measured by zero-order correlations) was.60 and in school grades.94, while in cohort M69 it was.68 as compared to.92 in school grades. Behind the less than perfect stability coefficients of the structural LISREL models lies the fact that not all youngsters remain in the same category of consumption — they are not high or low TV viewers all the time.
Despite this, individual TV viewing tends to be somewhat more stable in the beginning and in the end of the period studied — that is, in childhood and in young adulthood, respectively — than it is during adolescence. Comparing the two periods with equal intervals between measurements, the relative viewing level turns out to be most stable at the end of the age period, that is, between 19 and 21 years of age. This is only to be expected, both considering the fact that many habits are not really established before adulthood, and the fact that the most turbulent teenage period has now passed. The proportion of unexplained variance in TV viewing at the age of 21 is.59 and.57, respectively, indicating that between them, the three variables of earlier TV viewing, gender and social background are able to explain no less than about half the variation in TV viewing at this age.
Hitherto the analyses have mainly been preoccupied with different aspects of stability in one medium at a time. We have seen that the use made of a medium fluctuates both with increasing age and over historical time. Both stability and change were present in different aspects to different degrees under different circumstances. But nothing has yet been said as to how the use made of various media is structured. It is now time to turn to analyses including several media at a time in order to examine the structural stability of media relations.
Structural stability
During the last decade the Swedish media scene has experienced a period of thoroughgoing structural change, a change that has concerned the type of media available to the public as well as the media fare and options offered to that public (see Chapters 2 and 4). Inevitably, structural changes will affect individual media use — in the short as well as in the long run — and it will affect children and adolescents more than adults. In this perspective it is necessary to ask to what degree invariance in structural relations over time and space will exist in an ever-changing society.
Each pair of media may be functionally different or functionally equivalent (Adoni 1985; Johnsson-Smaragdi 1986). In the former case one medium cannot easily be replaced with another; in the latter, the media may be interchanged and substituted for each other. In this case one of the media may even tend to become more or less superfluous, in society as a whole or for specific groups within that society. Among the functions for individuals commonly ascribed to the media are cognitive, emotional, escapist and social functions. Any medium, of course, may fulfil more than one function.
Media use may be viewed as a form of adaptive behaviour. In adolescence, with its turbulence and rapid development, a reorganization process takes place in media use. This process may be explained by adolescents' biological, cognitive, social and emotional development calling forward new needs and requirements. These requirements, ranging from occasional to ever-present, the adolescents try to satisfy in different ways, including media use. In this context it becomes important to have control both over the medium and over the selection of its content, as well as access to suitable content (Brown et al. 1974; Brown 1976; see also Chapter 4).
The changes in the media scene have made possible an increased individual control over media and their use, not least through the new media and distribution forms on the market, offering a new kind of content more suitable to the adolescent public. As a consequence, adolescent use of various media has been subject to change and reorganization.
Structure of media consumption
A reorganization of media use in adolescence may thus be due to two different forces at work: a developmental process in adolescence at the individual level, and a societal process altering the media structure at the macro level and, thus, the relations between different media and the options available to the public. A reorganized media use depending on such structural changes could best be traced by comparing same-aged cohorts located at different points in time, for instance before the change process, in the beginning of it and when it is well under way. The alteration, or invariance, of the structural relationships between various media are graphically presented in Figure 6.10. Structural relations between six to seven media in four separate cohorts from the same place at different points in time dispersed over a fifteen-year period are analysed by means of zero-order and partial correlations. Two of the observation points are situated before the change in the media structure began in the early 1980s and two after the change process was initiated.
In the first two cohorts (V61 and V65), measured in 1976 and 1980, respectively, the structural relations between six media — TV, cinema, radio, music, comics and books — are studied. The VCR was not yet introduced. In the V69 cohort another medium, comics, is missing due to the absence of any questions about their use. The VCR had its market take-off during the years 1981–83. In 1984 more than a third of the adolescents had a VCR in their home, and many more had the opportunity to use a VCR together with their peers. In 1989 the proportion of adolescents with home access to a VCR had risen to about three-quarters. In the meantime, the TV medium itself had also changed. By the advent of cable and satellite TV the media fare and programme options had been radically enlarged, and adolescents often had started turning to these new programme options, at the expense of the old national channels. These, in their turn, also had to accommodate to the new media situation by altering their programme policy.
A first grasp of the relations between the various media may be found from studying the correlations in the four cohorts. Are there any invariant relations between the media or are they changing and reorganized during the course of the decade? The first observation is that of the number of correlations possible (between 15 and 21 in each cohort) about one-third turn out to be significant at least at the.01 level. The second observation is that although the correlations shown between the media are significant, most of them are relatively weak. A third fact worth noticing is that the majority of the correlations between the media are positive, that is, use of one medium is accompanied by use of others as well. The only negative relations found are between reading books and watching TV in two of the cohorts and between books and cinema-going in 1976 (V61).
Relations may be invariant in quantitative terms (the coefficients are of the same magnitude) and/or in qualitative terms (the patterns of structural relations are the same). Both aspects are important when considering stability, even if the latter stands out as most crucial (Rosengren 1991: 85).
Are there any signs of invariance or are the relations between the various media during the fifteen-year period studied rather characterized by change? First, in qualitative terms the relations seem to be marked more by change than by stability. Only one relation is found to be invariant over time, namely, that between music listening and going to the cinema. This relation is stronger.
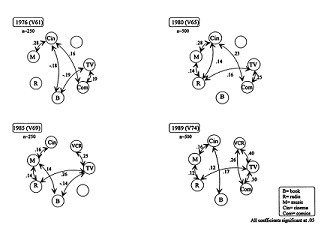
Figure 6.10 Media menus: structural relations between various media among 15 year olds at different points in time between 1976 and 1989 (zero order correlations)
at the first two points in time (.28) than in the later two (.16). This structural relation does not disappear or change in magnitude even after controlling for the influence of gender and social background by means of partial correlation
Three other relations are found invariant in three out of four cohorts, namely, those between music and radio listening (.14, .14, .12), between radio and TV (.16, .26, .17) and between TV and reading comics (.19, .25, .30). Quantitatively, these structural relations thus seem to be fairly stable. It may be noted, though, that the relation between TV and reading comics grows stronger over time. The first two of these relations withstand the control of influences from the background variables both qualitatively and quantitatively. However, the relationship between TV viewing and reading comics is partially due to the influence of the background variables. When this influence is controlled for by means of partial correlations, the relationship disappears in the first cohort and diminishes in magnitude in the two others, from .25 and .30 down to .19 and .22,respectively.
VCR and TV viewing are also strongly related and this grows stronger with time (.25 and.40 in 1985 and 1989, respectively). This change may be due to the rapidly growing access to VCRs among the adolescents or to a real change in their use and significance, the two media being increasingly intertwined, or to both of these factors. The corresponding partial correlations are, in this case, .15 and.36.
Most of the media analysed seem to contribute to the structuring of media use, and they also seem to be used in an inclusive way, that is, the more of one, the more of other media. Sometimes book reading makes an exception to this. In 1976, reading of books is negatively related to both TV viewing and cinema going. Also in 1985, the relation between TV and books is negative, while in 1980 and 1989 there is no relation between these two media. However, the negative relation between books and cinema in 1976 has changed to a positive relation in 1989. These relations are, however, strongly dependent on gender and social class. Looking at the partial correlations, the relationships between books and other media disappear, with one exception — the relation between TV and books in 1985 that does not change at all.
There has been a structural change or reorganization, in that the VCR has found its place among the other media. In 1989 there are fairly strong relations between the use of TV, VCR and comics. These media all rely on the image of pictures. In comparison with the situation in the 1970s and the beginning of the 1980s, the role of TV also seems to have become more important with time. Cable and satellite TV, as well as changes within the old TV medium, have had an impact on the adolescent use. While the VCR may have found its place within the structure of young people's media use, cinema may well be on its way out. Whether adolescents attend cinemas or not has more or less become unrelated to their use of other kinds of mass media. The last pertains also to books — reading has relatively little to do with use of other media. This fact becomes even more obvious when analysing the partial correlations that control for the influence of gender and social background.
A fact worth noting is that rather few structural relations are found to remain invariant over time. This is probably due not only to structural changes in the media world; the pattern of relationships is not changing consistently enough. Rather, it points to the importance of not putting too much emphasis on a single analysis or study, but instead to make frequent comparisons and replications, between studies as well as over time.
If individual development during adolescence results in a reorganized media use this could best be traced by longitudinal analyses following the same adolescent cohorts during an extended period of time. Such an analysis is graphically presented in Figure 6.11, showing the structural relations between various media (cross-sectionally and longitudinally) in a cohort of adolescents, following them from age 11 in 1980 until 21 years of age in 1990. In this longitudinal analysis the two cohorts V69 and M69 have been joined together to ensure a sample sufficiently large for this type of analysis.
Looking first at the structural relations cross-sectionally the dominant impression is change. Not one single structural relation between the various media endures over the full time period covered. The pattern of relations changes completely from childhood to young adulthood. The relations existing in adolescence, however, remain the same in young adulthood, qualitatively and mainly also quantitatively. At 11 years of age there are many simultaneous structural relations and an inclusive media use seems to exist. At the age of 21 there are about as many relations, but the pattern is hardly an inclusive one. At 15 years of age, in the middle of adolescence, there are considerably fewer relations between the different media; of those existing, two are negative.
At 11 years of age all media included — with the exception of books — have positive relations to each of the other media. Book reading, on the other hand, is mostly unrelated — children at this age read equally much or equally little independently of their use of other media. The only exception to this is a negative relation between the reading of books and of comics. Books continue to be either unrelated or negatively related to other media at an older age, but now the negative relations are those between reading books and watching TV or VCR. All these negative relationships in childhood and adolescence are partly due to differences between gender and in social background, causing a differential media use (see Rosengren 1991). When analysing the partial correlations, controlling for these background factors, the negative relationships between books and the other media disappear at these early ages, but remain unaffected, though somewhat lowered, at 21 years of age. The habit of use, developed during childhood and adolescence, seems to have become established.
Another pattern is found in the case of comics and music. The role of these
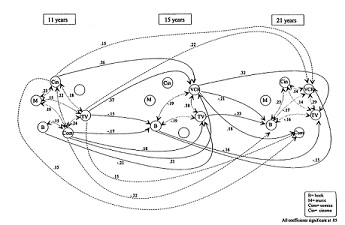
Figure 6.11 Relationships between use of various mass media — simultaneously and over time. Cohort VM69 (Zero order correlations)
two media in the lives of adolescents has also changed. At the age of 11, children who read comics and listen to music also use other media more than do other children. Ten years later there is no relation whatsoever between reading comics or listening to music and use of other media. This fact strengthens the reorganization hypothesis. Reading comics seems to have become independent of the extent to which other media are used. As for music, there is no longer any variation in the variable and, hence, no correlation possible. Everybody listens to music just about equally much (in this case, partly an effect of our crude instrument of measurement).
As mentioned above, in childhood and adolescence book reading was either unrelated or negatively related to the amount of consumption of most other media. But reading books and cinema-going correlate positively in young adulthood — as they also did among the 15 year olds in 1989 (cohort V74; see Figure 6.10). We can only speculate about the kinds of books read and the kinds of cinemas attended — whether intellectual or more escapist functions (or both) are satisfied. The role of the cinema seems also to have changed over the years. This change may depend on individual development, or on the restructuring of the media society, or on a combination of these factors.
There are several longitudinal relations between the media, especially from the age of 11 and onwards. In general, those longitudinal relations are low but positive — except when books are involved. Relations between books and any other media are all negative over time — independently of whether use of books comes before or after use of other media. Thus, reading books at age 11 means less television viewing at age 15 and less television viewing at age 15 means more book reading at age 21. Conversely, those adolescents viewing a lot of television — and using the VCR more — at the age of 15 also read fewer books when they are 21 years. Books, then, may well represent a strong fortress against the tidal wave of popular media culture!
TV viewing and cinema going at the age of 11 promote the use of VCR later in life. Those who read comics in childhood also view more television and VCR in adolescence, and they read fewer books when grown up. Both the simultaneous and the longitudinal relationships indicate a reorganization of the media use. Some of the reorganization seems to be due to the changing media structure, some to individual development from childhood to adulthood.
Learning media habits: structure of parent-child interaction
Children do not learn to use media in a social vacuum. Those closest to the children set the terms for their media use, influencing the child in a number of subtle ways, making media use more or less tempting. The child, in its turn, decides — deliberately or not — how to use the media and to sort out which medium to use — when, how, and for what purpose. As time goes by and the interaction goes on, this process is constantly being shaped and reshaped, actions and reactions being successively modified. The socialization process is thus complex and subtle, and it affects every aspect of life. It is actually not one process, but many. In addition, the different processes are mutually interdependent in a complex pattern of interaction.
Several social learning mechanisms may transmit parental values and patterns of behaviour to children. Throughout childhood and early adolescence, the family is expected to play a decisive role in shaping the attitudes and habits of the children. Learning processes of special relevance to media use are modelling, reinforcement and social interaction. All families draw more or less consciously on these processes in bringing up their children. To a varying degree, each of these processes is supposed to play its decisive role in shaping media habits.
Within the family the ever-ongoing processes of interaction and communication between parents and children are assumed to be of great importance for children's television habits. parents' positive and negative emotions towards diverse phenomena are noticed by the child. In this way parental attitudes may be powerful in shaping children's attitudes. The processes are, of course, complex, subtle, and difficult to define precisely.
The term ‘reinforcement’ refers to parents' use of rewards and punishments, of approval and disapproval, in order to shape their child's attitudes on many issues, and to make it behave in a certain way. In relation to television viewing, for example, parents may stimulate their children's viewing of certain programmes, while disapproving or restraining their viewing of other programmes. Children become conscious of their parents' opinion of television and its content, an opinion that may be transferred to, and eventually more or less taken over by, the child.
The concept of modelling refers to learning by observation. Modelling means that the child consciously or unconsciously imitates, and perhaps identifies with, another person's behaviour and actions. Bandura (see, for example, Bandura and Walters 1963; Bandura 1969) was among the first to state that children learn their personality through experience and through interacting with family and peers within the framework of a given culture or sub-culture. Modelling has a unique role to play in social development during childhood. The most effective way to teach new ways of acting and their consequences to a child is to show the behaviour requested to the child. Modelling means that the child tends to behave as the parents behave. Even when parents do not try to influence their children's behaviour, they may be setting examples which the child will later on imitate. For instance, if parents view a lot of television, the child also tends to view quite a lot. Modelling may be short term — as when the child explicitly imitates a specific act — or more long term — when, for example, the child learns adult behaviour through identification with a person or with a role at a more general level (see Brown 1965: 395).
In previous empirical research parents' and children's television viewing has been found to correlate (McLeod and Brown 1976; Johnsson-Smaragdi 1983: 162; Johnsson-Smaragdi and Höjerback 1989). By multivariate analysis of longitudinal data it has been demonstrated that parents' amount of television viewing influences their children's amount of viewing, both simultaneously and over time. An overt behaviour is thus learned and imitated (Johnsson-Smaragdi 1983). The influence does not seem to be entirely due to modelling, however, since both reinforcement and social interaction also have been shown to have a strong, indirect influence on the process (Johnsson-Smaragdi 1992). The above discussion, as well as the analyses presented below, draws heavily on the latter work.
Figure 6.12 presents a so called meta-model of parents' influence on their children's television viewing (for meta-studies, see Hunter and Schmidt 1990; Sonesson 1990). The meta-model summarizes invariant parts resulting from replicated analyses of a longitudinal structural model performed on three different cohorts (Johnsson-Smaragdi 1992). The magnitude of the total influence of a given variable on another is summarized in a meta-table (Table 6.3), drawing on three original tables.
The family communication climate (Chaffee et al. 1971; Jarlbro 1986, 1988: 45; Ritchie 1991) is essential for the general attitudes and outlooks of its members; it structures the interaction and communication going on in the

Figure 6.12 Cohorts V65, V69 & M69: meta-model of structural invariance for the ‘Family interactions models’
Source: Johnsson-Smaragdi 1992
Table 6.3 Cohorts V65, V69 and M69: Meta-table: means of total effects in three ‘Family Interaction Models’

Source: Johnsson-Smaragdi 1992
Note:*Figures in italics show the means from two out of the three tables.
family. Thus it plays an important role in the socialization process of the children. There are two main types of communication pattern: socio- and concept-orientation. Socio-orientation is characterized by stressing social harmony and trying to avoid controversy and to repress anger, while concept-orientation emphasizes intellectual values, trying to stimulate flexibility, even to challenge other people's views (Hedinsson 1981: 33; Jarlbro 1988: 26; see also Chapter 1).
Socio-orientation and concept-orientation are two radically different ways of relating to the social world. It is the structure of parent-child communication that the child learns to generalize, though, not the specific communication content (Chaffee et al. 1971; Hedinsson 1981: 33; Jarlbro 1986, 1988: 45).
The pattern of communication is highly relevant for the media use of family members. For instance, socio-oriented parents have been found to have a more positive attitude to television viewing than concept-oriented parents. Parents with a positive attitude towards television also watch more television (Sonesson 1979; Jonsson 1986; Sonesson and Linderholm 1992). This attitude is consciously or unconsciously conveyed to their children, and, in its turn, affects the children's viewing level. These are, above all, processes of social interaction, possibly with instances of subtle reinforcement.
The parental attitude towards television is also supposed to influence the children's viewing level by way of the process of reinforcement. parents' attitudes towards television have been measured by a scale originally developed by Brown et al. (1974) and adapted to Swedish conditions (see Sonesson 1979: 105; Jonsson 1985: 68; Rosengren and Windahl 1989: 196). Two dimensions from this scale are included in the present analyses, namely, a generally positive attitude towards television, and a more specific attitude regarding television as by and large stimulating for the children.
Amount of weekly consumption of television, both broadcast and cable but not VCR, is identically measured for children and parents over time — by means of six questions tapping the weekly amount of viewing (see Johnsson-Smaragdi 1992).
Turning now to the meta-model in Figure 6.12, it may be noted that it shows an invariant chain of influence: a chain flowing from parents' social background, to socio-orientation, to parental television attitude, to parents' television consumption and, finally, to children's television.
Of the three learning processes discussed above, modelling seems to be the most influential — on the assumption that the influence from parents' viewing on that of their children is primarily regarded as an instance of modelling. The total influence from parents' viewing is fairly strong, both simultaneously and also, on the whole, over time (Table 6.3). This is the closest to an invariant influence to which we have come so far. Thus, the amount of parental television viewing exerts a relatively strong influence on children's amount of viewing — independently of the particular process, or maybe blend of processes, at work (and independently of background variables such as social class, and intervening variables such as family communication climate and television attitudes).
The substantive interpretation of these invariant relations is that parents' television viewing is directly influencing children's viewing level simultaneously. Indirectly there is also considerable influence over time. Both types of influence are to be interpreted mainly in terms of modelling. As parents view television, so do children.
Furthermore, neither parental attitudes to television, nor their pattern of communication seem to have any direct, invariant influence on children's viewing, but Table 6.3 tells us that there are fairly strong indirect influences, mainly conveyed through parents' own television viewing. These influences should be interpreted as expressing instances of social interaction and subtle reinforcement affecting children's amount of viewing. Those processes thus seem to constitute a differentiated background against which the viewing patterns of parents and children are formed. The differential occurrence and strength of these influences indicate that social interaction is a subtle process, subject to influences from variable conditions in the immediate environment as well as in the overall social structure.
An important conclusion can be drawn from these replications of the longitudinal LISREL models: Structural invariance seems to be a matter of degrees rather than an absolute property. The invariance turned out to be far from complete — at least, that is what our models tell us.
The basic processes forming children's media habits must be assumed to be fairly general and stable. We have found some invariant structural relations over time, summarized in the Meta-model just discussed. The invariance is far from complete, however, at least in part due to the restructuring of the media landscape. It is to be remembered that the models analysed are relatively simple. What about the invariance of more complex models? This question concerns the degree to which invariance in structural relations over time and space actually do exist in an ever-changing society, and, if so, in which areas. Only continued theoretical, methodological and empirical work will provide an answer to that question. Theory and methodology have to be jointly applied in carefully designed studies in relevant areas, preferably longitudinal studies, admitting systematic replications. Otherwise, casual, haphazard research will dominate at the expense of long-term, theoretically anchored work, and there will be no possibility at all of knowing whether our findings are indeed based on invariant structural relations.
CONSEQUENCES OF STABILITY OR CHANGE
The Swedish media scene has been radically altered during the last ten to fifteen years. There are now more options to choose among — more media, more channels, several methods of distribution, a greater output of, and, maybe, more diversified media fare. Such thorough changes in the media structure inevitably affect individual use of mass media, including how the ‘media menu’ is composed and altered over time.
The differences in amount of media use between individuals or specific groups of individuals will probably become more marked in an expanding media system. It is also probable that there will be more individual change and turbulence over time, due both to individual development and historical change. Thus, in the long run, what will happen to the stability in media use? Will there be more stability in one respect than in another, for example in level stability but not in relative or structural stability? Can we expect an increasing number of ‘sprinters’, ‘obstinates’ and ‘laggards’ (adolescents that in some respect deviate from the average trend) and/or higher stability within specific subgroups of viewers, i.e. more ‘mainstreamers’? We do not know, of course, but a fair guess may be that the average ‘normal’ adolescent will become rare and that future media use will be more marked by change than by stability.
Media use is in many respects habitual; founded early in life, developing and changing during childhood and adolescence due to both internal and external forces in children's lives. The habit of viewing may be strong, but not so strong that it cannot be changed. Media use may be viewed as a form of adaptive behaviour. There are many forces influencing a child's viewing level and habits, trying to change and reorganize it in one direction or another. Probably these forces will become even stronger in the future.
In a quickly changing media environment, parents in the future may be less able than now to exert any influence. Children and adolescents are usually among the first to pick up new influences and to act and react in accordance with these (Johnsson-Smaragdi and Roe 1986; Johnsson-Smaragdi 1989: 121). Besides the parental influence on children's television viewing, there may be other, increasingly more important, sources of influence in the multimedia and multi-channel society — for example, the peer group. Besides, adherence to certain lifestyles within specific subgroups may become even more important. In order to find stable structural relationships it may be increasingly necessary in the future to break down the population under study into narrowly defined subgroups. It will also become increasingly important to include all relevant variables in the analyses — to build more complex models and perform more stringent analyses. It is also essential not to put too great weight on single analyses and studies, not even longitudinal ones. Carefully designed studies admitting systematic replications and comparisons over time and space are to be preferred. Otherwise there will be no possibility at all of knowing whether our findings are indeed based on invariant structural relations, or in which respects the relations are changing.
REFERENCES
Adoni, H. (1985) ‘Media interchangeability and co-existence: trends and changes in production, distribution and consumption patterns of the print media in the television era’, Libri 35 (3): 202—217.
Bandura, A. (1969) ‘Social learning theory of identificatory processes’, in D.A.Goslin (ed.) Handbook of Socialization Theory and Research, Chicago: Rand McNally.
Bandura, A. and Walters, R.H. (1963) Social Learning and Personality Development, New York: Holt, Rinehart & Winston.
Becker, L.B. and Schoenbach, K. (1989) (eds) Audience Responses to Media Diversification. Coping With Plenty, Hillsdale, NJ: Lawrence Erlbaum.
Brown, J.R. (1976) ‘Children's uses of television’, in J.R.Brown (ed.) Children and Television, London: Collier Macmillan.
Brown, J.R., Cramond, J.K. and Wilde, R.J. (1974) ‘Displacement effects of television and the child's functional orientation to media’ in J.G.Blumler and E.Katz (eds) The Uses of Mass Communications: Current Perspectives on Gratifications Research, Beverly Hills, Calif.: Sage.
Brown, R. (1965) Social Psychology, New York: The Free Press.
Burnett, R. (1990) Concentration and Diversity in the International Phonogram Industry, Gothenburg: Department of Media and Communication.
Chaffee, S.H., McLeod, J.M. and Atkin, C.K. (1971) ‘Parental influences on adolescent media use’, American Behavioral Scientist 14: 323—340.
Filipson, L. and Rydin, I. (1989) Children's and Adolescents’ Television Viewing, Stockholm: SR/PUB.
Hedinsson, E. (1981) TV, Family and Society. The Social Origins and Effects of Adolescents’ TV Use, Stockholm: Almqvist & Wiksell International.
Höjerback, I. (1990) ‘Nya medier — nya klyftor? Ungdomars medieanvandning i ett tioars-perspektiv’, Lund Research Papers in the Sociology of Communication 27, Lund: Department of Sociology, University of Lund.
Hunter, J.E. and Schmidt, F.L. (1990) Methods of Meta-analysis: Correcting Error and Bias in Research Findings, Newbury Park, Calif.: Sage.
Jarlbro, G. (1986) ‘Family communication patterns revisited: reliability and validity’, Lund Research Papers in the Sociology of Communication 4, Lund: Department of Sociology, University of Lund.
—— (1988) Familj, massmedier och politik, Stockholm: Almqvist & Wiksell International.
Johnsson-Smaragdi, U. (1983) TV Use and Social Interaction in Adolescence. A Longitudinal Study, Stockholm: Almqvist & Wiksell International.
—— (1986) ‘Tryckta kontra audiovisuella medier — konkurrens eller samexistens?’,Wahlgrenska stiftelsens rapportserie 3.
—— (1989) ‘Sweden: opening the doors — cautiously’, in L.Becker and K.Schoenbach (eds) Audience Responses to Media Diversification. Coping With Plenty, Hillsdale, NJ: Lawrence Erlbaum.
—— (1992) ‘Learning to watch television: longitudinal LISREL models replicated’, Lund Research Papers in Media and Communication Studies 5, Lund: Department of Sociology, University of Lund.
Johnsson-Smaragdi, U. and Hojerback, I. (1989) ‘Replikation av en LISREL-modell på nytt urval. Likheter i barns och föräldrars TV-konsumtion’, Lund Research Papers in the Sociology of Communication 13, Lund: Department of Sociology, University of Lund.
Johnsson-Smaragdi, U. and Roe, K. (1986) ‘Teenagers in the new media world. Video recorders, video games and home computers’, Lund Research Papers in the Sociology of Communication 2, Lund: Department of Sociology, University of Lund.
Jonsson, A. (1985) TV — ett hot eller en resurs. En longitudinell studie av relationen mellan skola och TV, Lund: Gleerups.
—— (1986) ‘TV: A threat or a complement to chool?’, Journal of Educational Television 12(1): 29—38.
McLeod, J. and Brown, J.D. (1976) ‘The family environment and adolescent television use’, in R.Brown (ed.) Children and Television, London: Collier Macmillan.
Mortimer, J.T., Finch, M.D. and Kumka, D. (1982) ‘Persistence and change in development: The multidimensional self-concept’, in P.B.Baltes and O.G.Brim (eds) Life-Span Development and Behavior 4, New York: Holt, Rinehart & Winston.
Ritchie, L.D. (1991) ‘Family communication patterns’, Communication Research 18 (4): 548—565.
Rosengren, K.E. (1991) ‘Media use in childhood and adolescence: invariant change? Some results from a Swedish research program’, in J.A.Anderson (ed.) Communication Yearbook 14: 48—90, Newbury Park, Calif.: Sage.
Rosengren, K.E. and Windahl, S. (1989) Media Matter. TV Use in Childhood and Adolescence, Norwood, NJ: Ablex.
Sonesson, I. (1979) Förskolebarn och TV, Stockholm: Esselte Studium.
—— (1989) Vemfostrar våra barn — videon eller vi?, Stockholm: Esselte Studium.
—— (1990) Ängslan - eft personlighetsbegrepp i svensk skolforskning, Stockholm: Skolöverstyrelsen.
Sonesson,1. and Linderholm, 1. (1992) ‘Förskolebarns mediebeteende och den sociala miljön’, Lund Research Papers in Media and Communication Studies 3, Lund: Department of Sociology, University of Lund.
Stattin, H. and Magnusson, D. (1990) Pubertal Maturation in Female Development, Hillsdale, NJ: Lawrence Erlbaum.