
Chapter 5
Looking for patterns in lifestyle
behaviours
Suzanne Pingree and Robert P. Hawkins
INTRODUCTION
The lifestyle concept has had a recurring fascination for social scientists. The hope, whether stated explicitly or not, has been to grasp at something closer to the essence of social life than the study of either individual behaviours or social categories will permit. However, realizing this hope requires some means of dealing with multiple aspects of individuals and social groups more or less simultaneously. How are multiple behaviours in different spheres integrated into coherent and meaningful organizations, and why do these integrations occur? In addition, implicit within the lifestyle concept is the notion of difference or variation – that individuals differ from each other in systematic and meaningful ways.
Attempts to apply these ideas to media-related behaviours have developed rapidly in recent years. Rosengren and Windahl (1989), in research that provided the direct impetus for that reported here, described nearly thirty adolescent activities with parents, friends and organizations according to a circumplex organized around the two dimensions of parent vs. peer and organized/planned vs. unplanned/spontaneous activities (see Figure 5.1). Mass media use was related to the circumplex by correlating use of individual media to each activity separately for subgroups defined by the social positional variables of gender, age, and social class. That is, different adolescent activities are related to use of television than to use of books or pop music; furthermore, these patterns also differed between subgroups. While the authors did not phrase their results in lifestyle terms, they did speak of variations in how media use is ‘embedded in patterns of social interaction’ (p. 203).
Rosengren and Windahl (1989) suggested that these differences indicated both developmental and lifestyle variation in the meaning of mass media to adolescents. However, while their analyses stimulate and suggest a lifestyle interpretation, they are necessarily limited – as are snapshots that suggest but cannot show motion. Working with one media use variable at a time makes it difficult to assess the degree of independence of the conclusions: we can
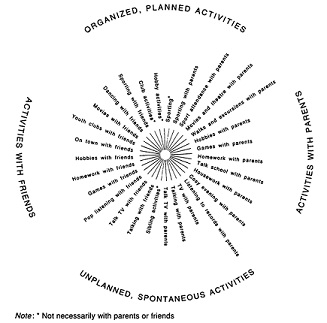
Figure 5.1 quasi-circumplex of adolescent activities
see multiple aspects of parent and peer activities simultaneously, but only for one slice of media lifestyle at a time. Similarly, it is not possible to assess the degree of independence of the activity variables to which media use is related, or even the validity of the circumplex itself.
In addition, basing the subgroups on social positional variables implicitly assumes both that social position is the key determinant and that gender, age and class adequately represent social position in distinguishing media lifestyle. Treating these three as dichotomies would already produce eight subgroups, but additional variables might also be relevant, and the number of subgroups grows by multiplication to numbers that are clearly unmanageable and uninterpretable (over a thousand for ten variables).
A further development is contained in Johansson and Miegel's (1992) analysis of lifestyle and identity in youth culture. In attempting to construct an integrated theory of lifestyle, they focused on personal values, attitudes and actions (including a range of media activities and details on the content of media used and preferred), and they attended to simultaneous determination by social structure, social position and the individual. Operationally, they locate the ‘lifestyles’ within each element as the factor dimensions of each of these elements (i.e. a factor analysis for values, one for music taste, one for activities, etc.), and then correlate taste and activity factors with values and social position variables.
Importantly, because Johansson and Miegel (1992) wanted to allow for lifestyle stemming from several levels of determination, they both defined and measured lifestyle entirely in terms of lifestyle variables themselves (rather than social position), which matches the approach we describe here. However, because their quantitative analyses correlated factor scores from different elements for the whole sample, they provide a better sense of how these lifestyle elements relate to each other overall than of differences in lifestyles.
Our approach in this chapter agrees in part with Johansson and Miegel (1992). We also look first for tools for simplification and understanding within the phenomena themselves. But beyond this, what we are suggesting is the utility of characterizing groups of these lifestyle media behaviours as ‘patterns’ of behaviour. In Rosengren's terms (see Chapter 1), we look first for patterns relating media use and social activities as ‘lifestyles’ (patterns of action determined by the individual), although subsequent analyses may attribute some of the variation to ‘ways of life’ (patterns determined by position in social structure) or to ‘forms of life’ (patterns determined by social structure itself). In other words, we want to see whether we can make some progress toward reducing the complexity in lifestyle media behaviours by looking for distinctly different patterns in the behaviours themselves, instead of for a common solution. This approach assumes that individual behaviours are sufficiently complex that we need to measure them as they co-occur, in clouds of interrelated variables, but that they are not so idiosyncratic that each individual has her/his own cloud.
As an analogy, we are reminded of Brenda Dervin's argument about attempting to customize messages of information campaigns to make them more useful for the general public. Doing so based on demographic or other enduring characteristics of individuals quickly bogs one down in far too many subgroups, as suggested above. But distinguishing instead between communication-related perceptions of individual situations requires only about a half-dozen categories, with another half-dozen categories of resulting questions greatly tightening the understanding of the situation (Dervin etal. 1982).
Thus, we see lifestyle media behaviour as potentially composed of many variables, and the differences between individuals as occurring in multiple dimensions at once. Treating each behaviour as a separate dependent variable would be unworkable, while linear combinations (such as in canonical correlation) search for best-fitting summaries at the expense of differences. In other words, there is considerable opportunity and promise for analytic approaches utilizing patterns in which individuals are grouped in multidimensional spaces according to communication lifestyle behaviours. Such patterns of interpretation or exposure would be composites of behaviours (which have perhaps been more successful than defining patterns as specific behaviours; cf. Greenberg et al. 1988; Pingree et al. 1991).
To pursue these ideas about communication lifestyle behaviours, we reexamined the circumplex of adolescent activities, looking for a method of approach that would satisfy several criteria. First, we wanted to test the assumed two-dimensional structure of parent/peer activities, and also to determine the extent to which individual activities were independent of each other. Second, we wanted to incorporate use of various media more directly and simultaneously into the circumplex, in hope that this would give a more direct sense of how mass media fit with and relate to other adolescent activities. Third, we wanted to be able to locate subgroups that differed in their jointly-considered patterns of media and circumplex activities, defining the subgroups by the patterns themselves rather than by external variables, although subsequent examination of any such subgroups should consider such variables. Finally, because the environment adolescents face is changing rapidly, perhaps especially in the range and nature of mass media available, we wanted to compare two different time periods.
RESULTS
Our analyses were of data collected by the Media Panel Group (Rosengren and Windahl 1989) from fifth- and ninth-year school students (about one year older than US students in those school grades) in the same Swedish city in 1980 and 1989. While this community of course shared in the global changes in media and society, it is worth noting that the nature of and access to television changed even more, from two commercial-free channels in 1980 to multiple imported channels and wide availability of videotapes by 1989 (see Chapter 2).
In each year of the survey, the number of respondents in one of these grades was considerably larger than the other, which could have produced age biases in both factor and cluster analyses. Also, a few variables had larger amounts of missing data than others. Thus, we first discarded cases with missing data on these variables and then randomly sampled from the remainder to end up with samples of approximately equal sizes for each age group (179 fifth grade and 182 ninth grade in 1980, 372 of each age in 1989).
Dimensions of adolescent activities
As a first step in locating commonalities and patterns of behaviours, we factor analysed the 29 circumplex items in each of the 1980 and 1989 Media Panel surveys, using the whole sample each time instead of conducting separate factor analyses for age, gender or social class subgroups. While different subgroups might have had different factor structures, sample sizes would have been marginal even for two separate subgroups (let alone eight!). Further, separate analyses would have necessarily prefocused the analysis on social positional factors, instead of leaving the source of variation open and grouping entirely in terms of the variables themselves.
(The response scales differed slightly between 1980 and 1989, with the earlier providing finer resolution for very frequent performance and the later survey providing more discrimination for rare events. However, since the stems were generally identical and the response scales in each case provide a five-point ordinal scale, an analysis focusing on correlations rather than absolute values should be unaffected by this difference.)
Although the original conceptualization organized these behaviours along two dimensions (with parents vs. with peers and organized/planned vs. unorganized/unplanned activities), our factor analyses both confirmed some of the central ideas and elaborated on them. To begin with, as shown in Tables 5.1 and 5.2, there were many more than two dimensions underlying adolescents’ responses to these questions.
For 1980, we characterize the factor solution as follows:
Factor 1 Parent Non-routine activities. Frequency of occurrence of a variety of leisure-time activities with parents. These were not, of course, unusual activities; the point is that they are not routine and often require some organization and planning.
Factor 2 Parent Routine activities. Frequency of routine, unplanned interactions, such as discussing schoolwork, getting help with lessons or doing chores.
Note that these two factors corresponded reasonably well to two of the quadrants of the initial conception. However, they did not correspond to the two underlying theoretical dimensions, since they did not contain negative loadings from the “other side” of the circumplex.
Factor 3 Friend Teen activities. Frequency of going out with friends, talking with them, or listening to music (either with friends or with parents), all of which suggest a youth-culture orientation. This factor was less consistent with the circumplex idea, since the activities that make it up were dispersed around the original circumplex. And it is worth noting that there is some overlap between this factor and non-routine activities with parents.
Factor 4 Friend Home acnvities. Frequency of engaging in schoolwork, hobbies or games with friends, or simply belonging to clubs. Except for the latter, these activities were all on one side of the original circumplex: with friends, but neutral on planned vs. unplanned.
Table 5.1 Factor analyses of 1980 circumplex activities
| Factor | 1 | 2 | 3 | 4 | 5 | 6 | 7 |
| 1. Parent Non-routine | |||||||
| 1. parent cinema | .79 | ||||||
| 2. parent spectate | .71 | ||||||
| 3. parent cosy | .69 | ||||||
| 4. parent walk | .68 | ||||||
| 5. friend cinema | .67 | ||||||
| 6. parent games | .60 | .34 | |||||
| 7. parent sport | .58 | ||||||
| 8. parent hobby | .51 | .35 | |||||
| 9. friend dance | .43 | .37 | |||||
| 10. parent lesson | .41 | .40 | |||||
| 2. Parent Routine | |||||||
| 11. parent talk | .78 | ||||||
| 12. parent housework | .7.1 | ||||||
| 13. parent talk school | .65 | .35 | |||||
| 3. Friend Teen | |||||||
| 14. friend music | .74 | .35 | |||||
| 15. friend talk | .66 | ||||||
| 16. friend town | :37 | .59 | |||||
| 17. parent music | .38 | .41 | |||||
| 4. Friend Home | |||||||
| 18. friend lessons | .74 | ||||||
| 19. friend hobby | .50 | ||||||
| 20. friend games | .47 | .32 | |||||
| 21. clubs | .40 | ||||||
| 5. TV Talk | |||||||
| 22. parent talk TV | .69 | ||||||
| 23. parent TV | .65 | ||||||
| 24. friend talk TV | .63 | ||||||
| 25. hobby | -.37 | .35 | |||||
| 6. Friends/Sports/Clubs | |||||||
26. friend sport |
.74 | ||||||
| 27. friend clubs | .31 | .45 | |||||
| 7. Sibling Sports | |||||||
| * sibling activity | .63 | ||||||
| 28. sports | .42 | .46 | |||||
| % variance | 22% | 7% | 6% | 5% | 5% | 4% | 4% |
Note: * This variable was not included in the 1989 survey. All loadings above .30 are shown.
Table 5.2 Factor analyses of 1989 circumplex activities
| Factor | 1 | 2 | 3 | 4 | 5 | 6 | 7 |
| 1. Parent Non-routine | |||||||
| 10. parent lessons | .69 | ||||||
| 6. parent games | .61 | ||||||
| 7. parent sport | .61 | .49 | |||||
| 8. parent hobby | .60 | .39 | |||||
| 17. parent music | .54 | ||||||
| 4. parent walk | .51 | .46 | |||||
| 3. parent cosy | .46 | .41 | |||||
| 1. parent cinema | .43 | ||||||
| 2. Friend Home | |||||||
| 14. friend music | .74 | ||||||
| 15. friend talk | .70 | ||||||
| 24. friend talk tv | .60 | ||||||
| *friend tv | .57 | ||||||
| 20. friend games | .52 | .35 | |||||
| 18. friend lessons | .46 | .49 | |||||
| 3. Sports/Clubs | .35 | ||||||
| 28. sports | .83 | ||||||
| 26. friend sport | .75 | ||||||
| 21. clubs | .67 | .40 | |||||
| 2. parent spectate | .45 | .57 | |||||
| 4. Parent Routine | |||||||
| 11. parent talk | .72 | ||||||
| 13. parent talk school | .70 | .32 | |||||
| 12. parent housework | .31 | .59 | |||||
| 5. Friend Out | |||||||
| 5. friend cinema | |||||||
| 9. friend dance | .32 | ||||||
| 16. friend town | .49 | ||||||
| 6. Parents and TV | |||||||
| 23. parent TV | .69 | ||||||
| 22. parent talk TV | .59 | ||||||
| 27. friend/club | .32 | ||||||
| 7. Hobbies | |||||||
| 25. hobby | .82 | ||||||
| 19. friend hobby | .63 | ||||||
| % variance | 20% | 11% | 8% | 6% | 4% | 4% | 4% |
Note: Row numbers indicate an item's position in Table 5.1, to simplify comparison.* This variable was not included in the 1980 survey. All loadings above .30 are shown.
Factor 5 TV Talk. Frequency of watching and talking about television with either friends or parents. This factor represents the juncture of family and friends for one very focused context of activity.
The final two factors may be relatively minor.
Factor 6 Friend Sports and Clubs, both fairly organized activities.
Factor 7 Siblings and Sports. Activities with siblings and participating in sports, originally conceived as on opposite sides of the circumplex.
Table 5.2 presents the comparable factor solution for 1989, using almost identical questions (the tables note two exceptions) with students of the same ages as in 1980. To facilitate comparison, items are identified by their number from the 1980 factor structure, and, where possible, the factors are named similarly.
Factor 1 Parent Non-routine activities.
Factor 2 Friend Home activities.
Factor 3 Sports and Clubs.
Factor 4 Parent Routine activities.
Factor 5 Friends Out.
Factor 6 Parents and TV.
Factor 7 Hobbies.
The two factor structures can be compared more directly in Table 5.3, which maintains the order of items and places a factor from each year with the most similar factor from the other year. Overall, there were substantial similarities between the factor structures, especially in that the two parent factors (Routine and Non-routine activities with parents) were very similar across time. Two activities with friends (cinema and dance) that were included in Parent Non-routine in 1980 moved out in 1989, and more overlap was visible with the otherwise unchanged Parent Routine factor, but these were minor. Basically, the division of parental activities into two groupings (independent of activities with friends or alone) remained.
The relationships between the 1980 and 1989 friend factors were more complex. In 1980 the two factors were nearly equal in eigenvalue; in 1989 one was nearly three times the size of the other. The dominant friend factor in 1989 (FriendHome) drew its variables equally from the two different 1980 friend factors and from the TV Talk factor. As such, it became a much more general factor, more compatible with the circumplex idea than its predecessors, covering a wide range of unplanned activities with peers.
Other items that were part of the two 1980 friend factors migrated away. Listening to music with parents, associated with teenage activities in 1980, joined the Parent Non-routine factor in 1989, while hobby and club items joined topic-specific factors. The remaining item in the 1980 friend factors, going to town with friends, in 1989 formed its own more focused factor of going out with friends, joining with cinema and dance that in 1980 aligned with Parent Non-routine.
Table 5.3 Comparing 1980 and 1989 circumplex factors
| Factor order numbers | |||||||||||||||||||||
| 1 | 1 | 2 | 4 | 3 | 5 | 4 | 2 | 5 | 6 | 6 | 3 | 7 | 7 | ||||||||
| '80 | '89 | '80 | '89 | '80 | '89 | '80 | '89 | '80 | '89 | '80 | '89 | '80 | '89 | ||||||||
| Parent Non-routine | |||||||||||||||||||||
| 1. parent cinema | x | x | |||||||||||||||||||
| 2. parent spectate | x | (x) | x | ||||||||||||||||||
| 3. parent cosy | x | x | (x) | ||||||||||||||||||
| 4. parent walk | x | x | (x) | ||||||||||||||||||
| 5. friend cinema | x | x | |||||||||||||||||||
| 6. parent games | x | x | (x) | ||||||||||||||||||
| 7. parent sport | x | x | (x) | ||||||||||||||||||
| 8. parent hobby | x | x | (x) | ||||||||||||||||||
| 9. friend dance | x | (x) | x | (x) | |||||||||||||||||
| 10. parent lesson | x | x | (x) | ||||||||||||||||||
| Parent Routine | |||||||||||||||||||||
| 11. parent talk | x | x | |||||||||||||||||||
| 12. parent housework | (x) | x | x | ||||||||||||||||||
| 13. parent talk school | x | x | (x) | ||||||||||||||||||
| Friend teen | |||||||||||||||||||||
| 14. friend music | x | x | |||||||||||||||||||
| 15. friend talk | x | x | |||||||||||||||||||
| 16. friend town | (x) | x | x | (x) | |||||||||||||||||
| 17. parent music | (x) | x | x | ||||||||||||||||||
| Friend Home | |||||||||||||||||||||
| 18. friend lessons | (x) | x | x | ||||||||||||||||||
| 19. friend hobby | x | x | |||||||||||||||||||
| 23. friend games | x | x | (x) | ||||||||||||||||||
| 21.clubs | x | x | (x) | (x) | |||||||||||||||||
| ** friend TV | x | ||||||||||||||||||||
| TV Talk | |||||||||||||||||||||
| 22. parent talk TV | x | x | |||||||||||||||||||
| Z3. parent TV | x | x | |||||||||||||||||||
| 24. friend talk TV | x | x | |||||||||||||||||||
| 25. hobby | x | (x) | x | ||||||||||||||||||
| Friend/Sports/Clubs | |||||||||||||||||||||
| 26. friend sport | x | x | |||||||||||||||||||
| 27. friend clubs | (x) | x | x | ||||||||||||||||||
| Sbling Sports | |||||||||||||||||||||
| * sbling activity | x | ||||||||||||||||||||
| 28. sports | (x) | x | x | ||||||||||||||||||
Note: X denotes a final factor solution primary loading greater than .40.
(x) denotes a secondary loading greater than .30
* This variable was not included in the 1989 survey .
** This variable was not included in the 1980 survey.
The 1980 factor 5, watching TV with parents and talking about it with parents or friends, was still recognizable in 1989, but was limited to parents. Talking about TV with friends, along with the newly added ‘watching TV with friends’, moved to factor 2 (Friend Home activities) in 1989.
The two minor (and not terribly clear) factors in 1980 were much more distinct in 1989. A strong Sports/Clubs factor incorporating both friends and parents emerged in 1989, and the final factor dealt exclusively with Hobbies.
Overall, distinctions were clearer in 1989 than in 1980. There was sharper definition and division between parents and peers, but also sharper definition of contexts and locations of activities as well. The only exception to this trend was the pulling-apart of a singular television factor in 1980, but even this more clearly separated the spheres of parents and friends. However, while these changes are interesting and may be suggestive of important trends, it is still clear that there was substantial continuity from 1980 to 1989 in the ways adolescents organized their life with parents and peers.
Clusters of activity and media use
Given this, the next question is how adolescents relate media use with these dimensions. However, while the above analyses sought to reduce the large number of specific measures of adolescent activities to a small set of dimensions, locating use of various media within the dimensions of the circumplex requires a different approach. Correlating use of each medium with each of the dimensions would be somewhat informative, but even though-the factor scores are at least in principle uncorrected, use of various mass media is certainly not, so that correlations would have to be evaluated for redundancy.
But even trying to avoid this problem through multiple regression or canonical correlation would actually miss our main point. Any of these correlational techniques seeks a best overall solution – the average or aggregate or most common set of relationships between mass media use and activities with parents and friends. We suspect that there are instead different ways of combining media use and the circumplex activities (different lifestyles, one might say), and therefore we need to use a different technique.
Our attempt to locate styles uses cluster analysis to identify groups of adolescents who are similar to each other on a set of activity and media use variables, while different from other groups or clusters who share a different constellation of behaviours. Since these are subgroup analyses, we can look for patterns within the parent and friend activity variables even though these variables are uncorrelated across the sample as a whole. And finally, this approach attempts to locate the styles based on patterns in the behaviours themselves, rather than by first defining subgroups by social position variables.
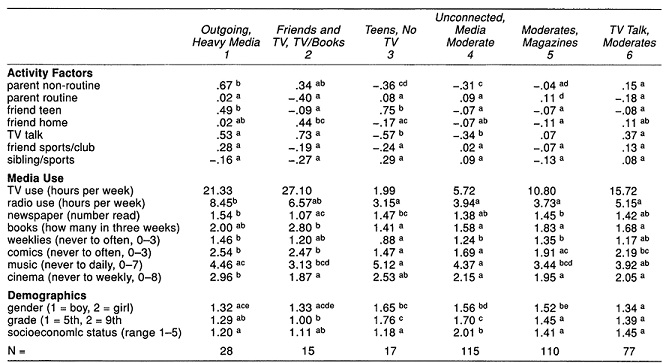
For the 1980 cluster analysis, the seven circumplex factor scores were entered along with amount of use of eight mass media (television, radio, newspapers (combining the news-oriented morning papers and the afternoon tabloids), books, weekly magazines (typically aimed at a subgroup – teens, women, men), comics (books, weeklies, series), music, and cinema). Use distributions were highly skewed for a few variables, so square root transformation was used in the cluster analysis. However, Tables 5.4 and 5.5 present the means using the original metrics as shown. Note that the scales differed for some variables in the two surveys, which limits comparisons of absolute magnitudes but should have little effect on the clustering procedures.
Since cluster analysis typically generates the number of clusters requested (there is no common decision statistic or default comparable to the eigenvalue of factor analysis), solutions were produced for four through seven clusters. Picking one solution to interpret involved first examining the balance of cluster sizes for each solution. The four- and five-cluster solutions each placed 78 per cent of the 1980 sample in only two clusters. The six- and seven-cluster solutions each placed 62 per cent in their first two clusters (and 20–21 per cent in the third). However, the seven-cluster solution had one very large cluster and many smaller ones, making the six-cluster solution both the most balanced and the most interpretable.
The first cluster (see Table 5.4), a fairly small group, combined high levels of Parent Non-routine activity, Friend Teen, TV Talk and Friend Sports/ Clubs, while being merely moderate on the Parent Routine and Friend Home dimensions. They were also very heavy users of all eight media. This active and outgoing group was largely younger boys.
The second cluster, also quite small, was similarly high on Parent Non-routine and TV Talk, but also Friend Home, while being lower than other groups on Parent Routine activities and Sibling/Sports. They were heavier than average users of television, radio, books and comics, while lighter users of newspapers, music and films. They were also mostly boys and they were all fifth graders.
Note that while the first two clusters were similar in social position and share some behaviours (TV Talk, Non-routine activities with parents, and heavy use of four media), they differed on Friend Home and Parent Routine activities, and three other media use variables.
The third cluster, again a small group, was higher on Friend Teen and Sibling/Sports, but lower on Parent Non-routine, Friend Home, TV Talk and Friend Sports/Club. They were heavy users of newspapers, music and films, while being light users of books, weeklies, comics, radio and especially television. They were mostly older and girls.
The fourth, largest group, was low on Parent Non-routine and TV Talk activities, and moderate on the other five circumplex variables. They were moderate to light users of most mass media. They were older, equally divided between boys and girls, and were the only group higher in social class than the others.
The fifth group, also large, was simply moderate on all circumplex
Table 5.4 1980 clusters
Note The labels for each cluster first describe their relative circumplex activities and then their media behaviour. Means with like superscripts do not differ at p<. 05.
Table 5.5 1989 clusters
Note: The labels for each cluster first describe their relative circumplex activities and then their media behaviour. Means with like superscripts do not differ at p<.05.
measures. They were also generally moderate in media use, although they used weekly magazines more than did others, and were less likely to use music, radio or films. They were of mixed age and gender.
The sixth group, still fairly large, was not sharply distinctive, being only moderately higher on TV Talk and moderately lower on Parent Routine, and generally moderate for the media use variables. Like the first group, they tended to be younger and boys.
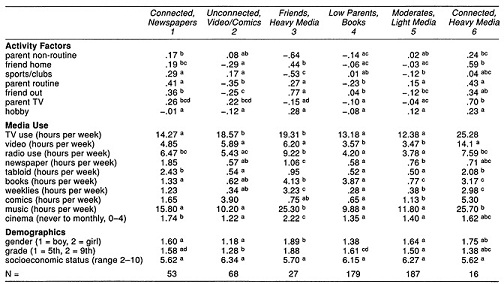
A similar cluster analysis was conducted on the 1989 sample, using the slightly different circumplex dimensions, and with some alteration of the media use variables. First, newspaper use was measured separately for the morning papers and the tabloids, and amount of video viewing was added. In addition, almost all media variables were measured in minutes or hours per week (rather than by ‘how often’ scales), producing skewed distributions in most cases; the cluster analyses used transformed variables, but the original scales were used for the means in Table 5.5. Once again, six clusters proved to be the best solution. Four-, five- and seven-cluster solutions all grouped many more individuals into the largest cluster. (However, the order of the clusters in Table 5.5 is not the original, essentially arbitrary order produced by the computer program; we have altered the order to facilitate comparisons to 1980 to be presented in Table 5.6.)
The first 1989 cluster seemed very connected to almost all aspects of the circumplex, higher than average on all but one, and especially high on Parent Routine and Sports/Clubs. It was moderate in its use of most media, but higher than average on use of newspapers and tabloids. The cluster was fairly mixed in age and gender but with a few more girls and ninth-graders. None of the clusters was significantly different from the others in social class as indexed by parental occupations.
The second cluster was not very connected to the family and friend circumplex: slightly above average on Sports/Clubs, Parent Non-routine and Parent TV activities, but the lowest of the groups on the other four factors. They were heavy video and comic users, but low on all print media, as well as on music and cinema (which one might consider adolescent media). They were mostly young and almost all boys.
The third group was quite high on the friend factors and quite low on Parent Non-routine and Sports/Clubs. They were heavy users of all mass media except comics and tabloids, especially radio, books, weeklies, music and films. They were almost all older and girls.
The fourth group, almost as large as the fifth, was moderate to below average across the circumplex factors, particularly the two parent factors. They were very heavy book readers, but among the lightest users of all other media. They tended to be older and boys.
The fifth cluster, a large group, was generally moderate on all circumplex factors (slightly above average on Parent Routine and Hobby, slightly below on Friend Out and Sports/Club). They were light to very light users of almost all media, tended to be girls, and were evenly divided between fifth- and ninth-graders.
The sixth cluster, a very small group, was also very connected to most aspects of the circumplex (although not Sports/Clubs), in five cases the strongest of all six groups. They were substantial consumers of almost all media (except that they were moderate in newspaper use) and highest of the groups on television, video, comics, and music. A majority were fifth-graders and three-quarters were girls.
Table 5.6 presents an attempt to relate the 1980 and 1989 clusters. In comparing clusters, we looked first for similar loadings on the seven circumplex factor dimensions, and then examined similarities in media use. Overall, we found two close matches (the second and fifth clusters) and two matches that were close on the circumplex variables but weak on media use (the first and fourth clusters). In addition, there were two cases where the match on the circumplex variables was only moderately good (the third and sixth clusters). In one of these, the match on media use was fairly good; in the other it was weak.
More specifically, the Friends and TV, TV/Books cluster from 1980 (a small group, all fifth grade and mostly boys high on Parent Non-routine and
Table 5.6 Comparing 1980 and 1989 lifestyle clusters
| Cluster Number | ||||||||||||
| 80 | 89 | 80 | 89 | 80 | 89 | 80 | 89 | 80 | 89 | 80 | 89 | |
| 1 | 1 | 2 | 2 | 3 | 3 | 4 | 4 | 5 | 5 | 6 | 6 | |
| Activity Factors | ||||||||||||
| parent non-routine | + | + | + | (+) | - | - | - | (-) | + | |||
| parent routine | + | - | - | (+) | - | (+) | (+) | (-) | + | |||
| friend home | (+) | + | + | - | - | + | (+) | + | ||||
| friend teen/out | + | (+) | (-) | - | + | + | (-) | (-) | (-) | (-) | + | |
| TV talk/parent TV | + | (+) | + | (+) | - | - | - | (-) | + | + | ||
| sports/clubs | + | + | + | (+) | - | + | (-) | + | ||||
| siblings/hobby | - | - | - | + | + | (+) | + | |||||
| Media Use | ||||||||||||
| TV | + | (-) | + | (+) | - | + | - | - | - | (+) | + | |
| video | na | (-) | na | (+) | na | (+) | na | - | na | - | na | + |
| radio | + | + | - | + | - | (-) | - | (+) | ||||
| newspapers | + | + | - | - | - | |||||||
| tabloids | na | + | na | - | na | na | - | na | - | na | + | |
| books | + | - | - | + | - | + | - | (-) | (+) | |||
| weeklies | + | - | - | + | - | (+) | - | (-) | + | |||
| comics | + | + | - | - | - | (-) | - | (-) | + | |||
| music | (+) | - | - | + | + | (+) | - | - | - | + | ||
| (+) | + | - | - | (+) | + | - | - | - | ||||
Note: + or – indicates a mean substantially above or below the grand-mean (usually the highest or lowest group). (+) or (-) indicates a mean moderately above or below the grand mean.
TV Talk while low on Parent Routine and Friend Teen) corresponded on five of the seven dimensions with the Unconnected, Video/Comics 1989 cluster (a larger group, but also mostly fifth grade and boys), although the 1989 group reversed the 1980 group on Sports/Clubs and Friend Home (where, we should note, the factor structure realigned somewhat). The two clusters were also quite similar in their media use: high on television and comics, low on newspapers, music and films, and differing only in books. Thus, this at-home, entertainment-oriented lifestyle of some younger boys appeared to continue in fairly stable fashion through the 1980s.
The Moderates, Magazines 1980 cluster (a large group of mixed age and gender, generally moderate on the circumplex but above average on Parent Routine and below average on Friend Teen and Friend Home) matched very well to the Moderates, Light Media 1989 cluster (also a large group, of mixed age and with more girls than boys). Besides the similarity in their circumplex activities, the two groups were also very similar in being light users of almost all media, so that this pattern also seemed to persist.
The 1980 Outgoing, Heavy Media cluster generally matched the circumplex variables of the 1989 Connected, Newspapers cluster: high Parent Non-routine, Friend Teen/Out, TV Talk/Parent TV, and Sports/Clubs, although in 1989 this cluster is also more involved in home-based activities with parents and peers than in 1980. However, despite the circumplex match, the two groups differ more in their media use than they are similar. They were both heavy newspaper users and moderate on books and music, but were opposite on television use. And while the 1980 group used a number of other media quite heavily, the 1989 cluster was only moderate. In addition, the 1980 group was mostly young boys, while the most comparable 1989 group was more than half ninth-graders and girls. All of the above suggests a shift between 1980 and 1989 in the meaning of this particular circumplex mix: despite considerable stability in the pattern of activities, in some sense it has migrated to be associated with a different mix of media use by people from different social positional categories.
Similarly, the 1980 cluster named Unconnected, Moderate Media was very similar in circumplex activities to the 1989 cluster named Low Parents, Books. Both were generally moderate on the circumplex factors, but below average on Parent Non-routine and TV Talk/Parent TV. However, the two clusters matched well on only two media use variables (low use of TV and comics), while they were opposite on two others (books and music). More to the point, the 1989 group were light users of all media except books, while the 1980 cluster was simply moderate. Both groups were older, but the 1980 group had slightly more girls and the 1989 group had a majority of boys. Thus, the pattern of being unconnected to parents and peers also seems to have shifted in its association with mass media.
The match between the TV Talk, Moderates group in 1980 (a moderate-sized group with a majority of young boys) and the Connected, Heavy Media group of 1989 (a small group composed mostly of younger girls) was fair in the circumplex variables. They were both moderately high in Friend Home, TV Talk/Parent TV, and Sports/Club, and both were moderate in Siblings/ Hobby, but the groups were opposite on Parent Routine and Friend Teen/Out. The match between the two was also only fair on media use variables: high on TV use and moderate on radio, newspaper and films, but opposite on books and weeklies. Given the opposite directions on two circumplex factors and the different genders, we are inclined to see these two as different lifestyle combinations that merely happen to overlap on several measures, and not necessarily a continuing pattern.
Finally, the 1980 cluster named Teens, No TV (a small group with a majority of girls and mostly older) has some circumplex similarities to the 1989 cluster named Friends, Heavy Media (a small group mostly of older girls): both are low on Parent Non-routine and TV Talk/Parent TV, high on Friend Teen/Out, and moderate on Parent Routine, although they are opposite on Friend Home and Sports/Clubs. However, they were opposite on media use variables as often as they were similar: high on music and films, low on comics, and moderate on newspapers, but opposite on television, radio, books and weeklies. This suggests that the lifestyle of low involvement with parents for older girls was shifting to incorporate more television, radio, books and weeklies, to go along with its original emphasis on music and movies.
DISCUSSION
In pursuing both differences in adolescent lifestyle and a methodology conducive to their expression, our first goal was to achieve a better overall understanding of the circumplex of adolescent behaviours, and test the two-dimensional theoretical structure underlying it. Initially, our seven-factored analyses appeared to undercut the original conception. Besides being numerous, none of the factor dimensions crossed through the centre of the circumplex with corresponding negative loadings on the opposite side (in fact, the entire factor structure was conspicuous for the nearly-complete absence of negative loadings altogether). However, we think it would be manifestly unfair to conclude from these results that the original concept of the circumplex is not viable. Instead, our analyses provide an important elaboration.
Figures 5.2 and 5.3 summarize the 1980 and 1989 factor structures visually in a way that allows direct comparison to the original circumplex conceptions. Each concentric circle represents one of the seven factors, with the darkened portion of the arcs being items loading .40 or greater on that factor. Since the factors generally still occupy wedges of the original circle, it is more accurate to say that the factor structure relates well to the original two-dimensional theoretical conception, but that the factors are vectors of varying width rather than dimensions. In other words, the parent-friend and planned-unplanned dimensions are important organizing principles, but adolescents’ behavioural activities are oriented toward sectors of the circumplex rather than toward the dimensions themselves. Furthermore, it seems reasonable to regard these orientations toward different sectors as relatively independent of each other, so that individuals may hold varying combinations of these orientations.
In particular, the two figures illustrate the centrality of the parent vs. friend distinction in adolescents’ orientations, a distinction that became much clearer between 1980 and 1989. In 1980 there was overlap of parents and peers at both the top (organized, planned) and bottom (unplanned, spontaneous) of the circumplex, and several factors sprawled across quadrants and
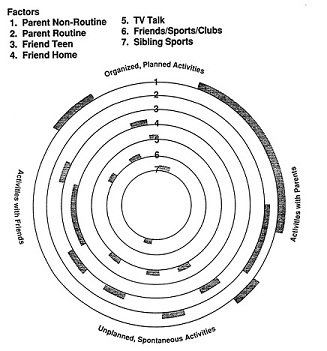
Figure 5.2 1980 factor structure of adolescent activities mapped onto the circumplex model
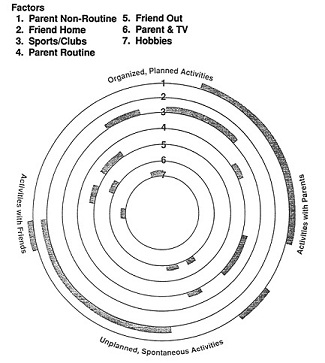
Figure 5.3 1989 factor structure of adolescent activities mapped onto the circumplex model
each other, leaving irregular gaps. By 1989 the overlap remained only in the realm of sports, clubs and spectatorship, and factors which generally combine contiguous items from the original circumplex.
Further focusing on the 1989 structure's better match to the circumplex, one can see that within the two domains of friends and parents, the original conception fares quite differently. For friends, the distinction between the few remaining planned activities (Friend Out) and the larger mass of less-organized, often home-bound activities (Friend Home) clearly is the vector analogue of the original dimensions. For parents, however, the organization of activities is much less clear. While the largest vector (Parent Non-routine) contains most of the activities planned or organized with parents, it also spreads well into the unplanned activities (doing lessons, cosy evening together), thus providing a very diffuse, unfocused orientation to parents. In addition, this dimension overlapped in one-third of its range with routine activities with parents, which in turn overlapped with the Parent TV dimension.
It is important to note that these overlaps do not result from individual activities loading simultaneously on two dimensions, but instead from a dimension skipping over some activities and including others farther around the circumplex. In other words, planned vs. spontaneous does not adequately capture the distinctions adolescents now make in their activities with their parents. We suspect, instead, that the ‘non-routine’ activities were generally pleasant and/or involving, while the ‘routine’ activities were also emotionally neutral and uninvolving.
These changes from 1980 to 1989 are also intriguing in suggesting cultural shifts that further distinguished home and peer environments. While this is purely speculation, it may be that in 1980 Swedish adolescents saw much more overlap between the worlds of home and friends than they did by 1989. This is not to say that they are spending more or less time with one than the other, simply that time spent with each has become distinct from and uncorrelated with time spent with the other. The one exception to this trend is the emergence of the Sports/Clubs vector of organized, planned activities spanning parents and friends.
The next step in our analyses was to attempt to locate patterns or styles in the way in which adolescents assemble these vectors of activities with their use of various mass media. Each of these resultant clusters suggests a different way to organize one's interaction with parents and friends, and each uses a certain mix of mass media. A wide variety of combinations were observed. Some patterns were characterized by heavy involvement with most aspects of peer and parent activities, while others were unconnected with any and yet others were moderate throughout. The activity factors were also independent in these clusters, in that about half the groups were more involved with some subpart than others (parents vs. peers, routine vs. non-routine, or content specific). Similarly, groups evidenced various combinations of media use and combinations of media use with the activity factors.
While variation in social structure was of course not available, several of these clusters seemed related to the social positional variables of gender and grade level, but other clusters were thoroughly mixed, and the clusters generally mixed social class (as measured by parental education), implying key contributions of the individuals themselves. Some of these clusters were quite stable from 1980 to 1989, but others changed considerably in how the circumplex activities mixed with use of mass media or shifted in their relation to social position characteristics. Explanations for this stability and change are necessarily speculation, but will need to take account of the changing media environment, Swedish and European cultural trends, generational changes in social relationships, and so on.
The limitations of this secondary analysis suggest some avenues for further research. As we see it, the main weakness is that we have based these factors and clusters purely on behaviour – frequency of activities with parents, peers and various mass media – without regard to the content and affective loading of those interactions. A key further step will be to add content to the purely behavioural measures used here. For one thing, as Johansson and Miegel (1992) suggest, these lifestyle clusterings should also be groupings of individuals who share values. The same should be true for media use gratifications. Furthermore, we constantly found ourselves tempted to explain media use patterns by referring to presumed patterns of content that may or may not have been present in the messages used. The nature of the content (genres, themes, expressed values) should be at least as important to lifestyle and should be more distinct in the styles than were the channels. Taking account of such variables should greatly sharpen the claim of this approach to tap lifestyles.
Beyond this, the next stage might well be to determine how much difference these lifestyles make. What are their consequences? Do they lend themselves to different media effects or different susceptibility to effects? Do they contain cognitive style differences as well, or different chances for social success? All these questions are equally legitimate and equally beckoning. But for the moment, the main lesson is that the conception of lifestyles as different approaches to the world can be matched with a methodology of differences as well, one that locates the differences in the phenomena themselves instead of in the social context alone.
REFERENCES
Dervin, B., Nilan, M. and Jacobson, T. (1982) ‘Measuring aspects of information seeking: A test of a quantitative/qualitative methodology,’ in M.Burgoon (ed.), Communication Yearbook 6, Newbury Park, Calif.: Sage.
Greenberg, B.S., Heeter, C. and Sipes, S. (1988) ‘Viewing context and style with electronic assessment of viewing behaviour’, in C.Heeter and B.S.Greenberg (eds), Cableviewing. Norwood, NJ: Ablex.
Johansson, T. and Miegel, F. (1992) Do the Right Thing: Lifestyle and Identity in Contemporary Youth Culture, Stockholm: Almqvist & Wiksell International.
Pingree, S., Hawkins, R.P., Rosengren, K.E., Johnsson-Smaragdi, U. and Reynolds, N. (1991) ‘Television structures and adolescent viewing patterns: A Swedish-American comparison’, European Journal of Communication 6: 417–40.
Rosengren, K.E. and Windahl, S. (1989) Media Matter: TV Use in Childhood and Adolescence, Norwood, NJ: Ablex.