The account schedule functionality is part of the Analysis & Reporting section of the Financial Management area. It is meant to create customized financial reports based on general ledger information, budget information, or on the analysis views information. Account schedules can group data from various accounts and perform calculations that are not possible directly on the chart of accounts.
When defining account schedules, the information that will be displayed on both rows and columns can be defined.
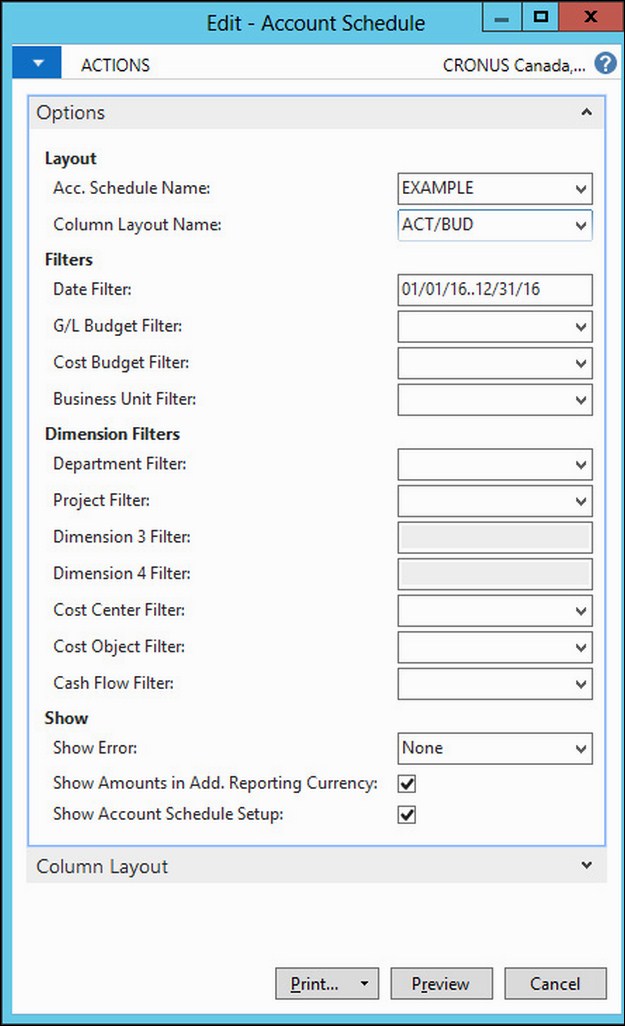
Just to see how it works, we will create a simple account schedule that will compare budgeted amounts versus real amounts. To do so, we perform the following steps:
- Navigate to Departments | Financial Management | Reports and Analysis and choose Account Schedules.
- Click on New to create a new account schedule. For the new account schedule, select EXAMPLE as the Name, Comparing budget versus reality as the Description, and ACT/BUD as the Default Column Layout.
- Click on Account Schedule.
- Define the account schedule as shown in the following screenshot:
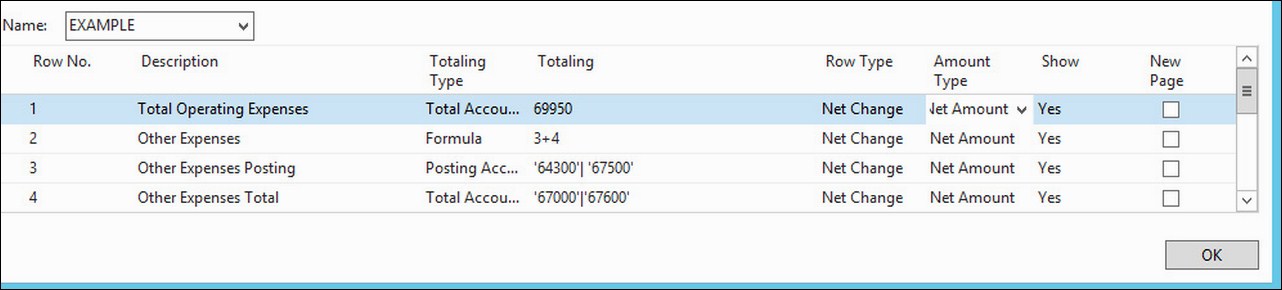
- The rows in the screenshot mean the following:
- The first row gets the net amount of account
69950, a totaling account that summarizes all operating expenses. - On the second row, a formula sums the results of rows
3and4. - The third row gets the net amount of other expenses from the posting accounts
64300and67500. As this row is only used for calculation purposes and to show on the report, the Show field has been set toYes. - The fourth row gets the net amount of other expenses from the totaling accounts. The totaling accounts used are
67000and67600. The Show field has been set toYes.
- The first row gets the net amount of account
The account schedule is fully defined now. The account schedule defines the rows that will be shown on the report. Columns are defined in the Column Layout page. In the example, we have used an existing column layout called ACT/BUD. Let's see what the following column layout will show:
- On the Account Schedule page where we were defining our account schedule, click on the Actions tab and then click on Edit Colum Layout Setup.
- Select ACT/BUD for the Name field. The ACT/BUD column layout definition will be shown. Refer to the following screenshot:

- The column layout defines that the report will have four columns called Net Change, Budget, Variance, and A-B:
- The Net Change column will show the net amount for G/L entries
- The Budget column will show the net amount for budget entries
- The Variance column will show the difference between the first and the second column
- The A-B column calculates the percentage that the first column represents versus the second column
Now that we have defined both the account schedule and the column layout, it is time to see the results of our account schedule.
- Navigate to Departments | Financial Management | Reports and Analysis and choose Account Schedules. Select the one we have just created.
- Click on Overview. The report will be shown on screen, similar to the following screenshot: