
A good and powerful way to view and analyze data is to use filters and flowfilters inside the application. Both of them are used to narrow down the information seen on screen or the information a report produces. Filters can be applied on all pages and on most of the reports. In this section, we will see how to apply filters and flowfilters on pages. In the Using reports section, we will see how to apply them on reports.
The filtering pane can be found on the upper part of the page, as shown in the following screenshot:
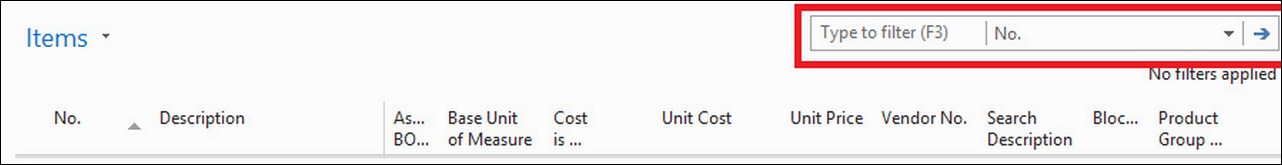
There is a quick filter section in the upper-right corner where filters can be applied over any of the fields that are shown on-screen. Filters can also be applied over two or more fields at a time, or over fields that are not shown on-screen. To do so, the Advanced Filter section should be shown by clicking on the down arrow found at the right of the Quick Filter section. A Show results: subsection should be shown on-screen, similar to the following screenshot:
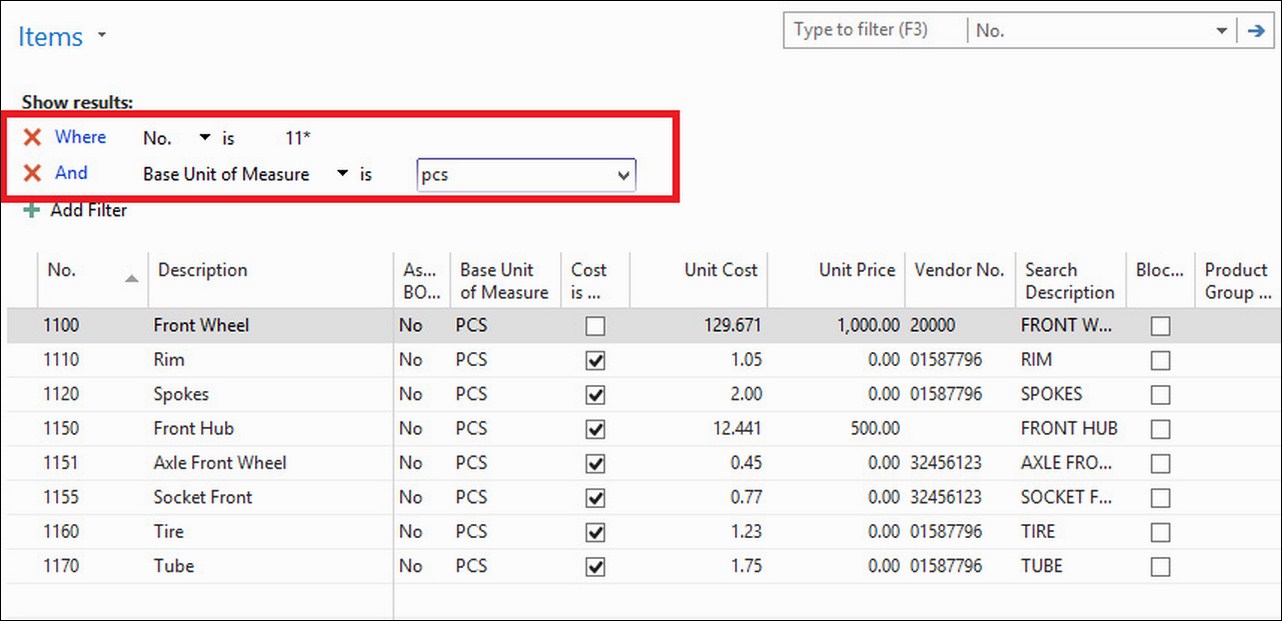
In the Advanced Filter section, you can select any field to filter, and you can also add new filters.
Imagine that on the item list we want to see all items that have a unit cost >=100 and whose vendor number is vendor 20000 or vendor 30000. We can see only those items by applying filters over the Unit Cost and the Vendor No. fields, as shown in the following screenshot:
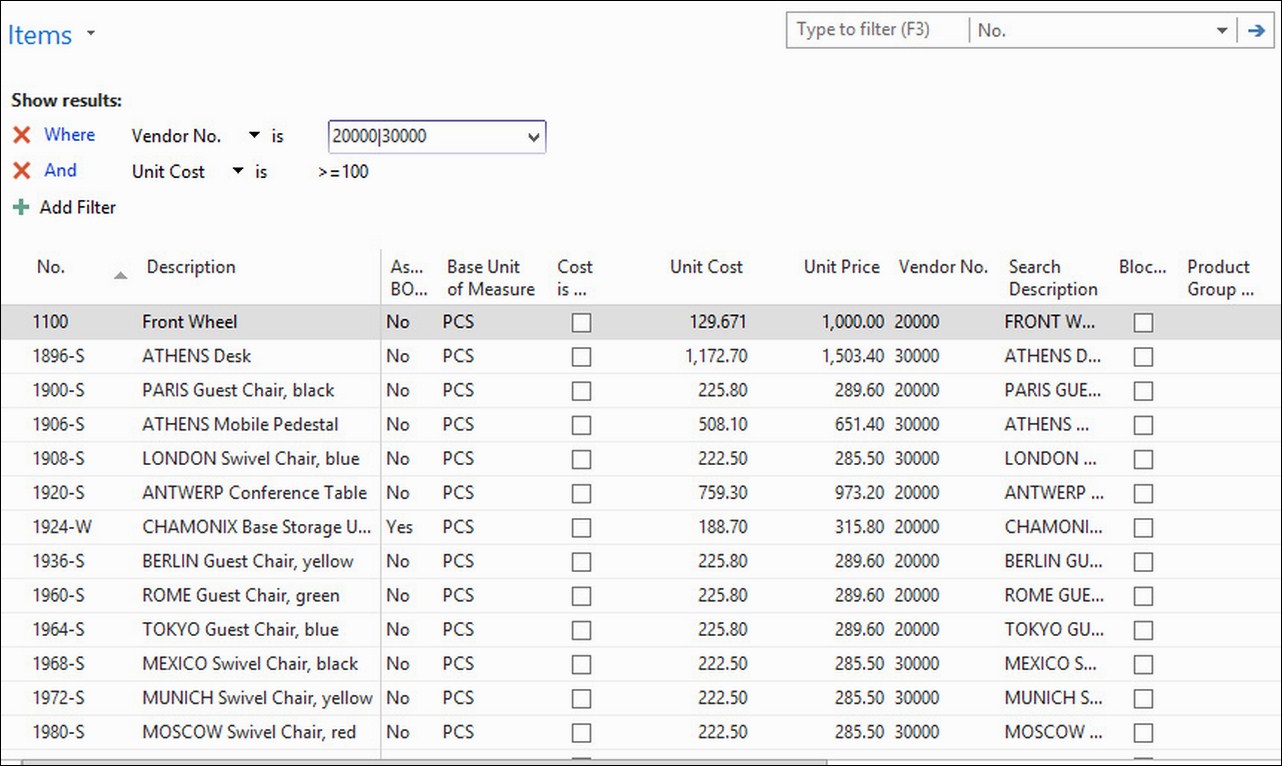
There are multiple filtering expressions that can be used, including operators (>, <, and =), statements (| and &), or intervals, compound expressions, and so on.
Note
For a complete list of available filtering expressions, refer to the online documentation found at https://msdn.microsoft.com/en-us/library/hh879066(v=nav.90).aspx.
Flowfilters are a special type of filter that isn't used to narrow down results but to narrow down calculations. Some of the information you see in the application is actually a calculation based on other information. For instance, the balance for customers and vendors is actually a calculation based on their ledger entries. So are inventories on items or the balance on general ledger accounts.
Let's see how to apply a flowfilter on the chart of accounts and the result it produces. We will perform the following steps:
- Open the chart of accounts by navigating to Department | Financial Management | General Ledger | Chart of Accounts.
- On this page, the Net Change and Balance fields show the sum of general ledger entry amounts for the different accounts.
- Click on Chart of Accounts and select Limit totals to:.
- Add a filter for Date Filter and set it as
01/01/16..12/31/16. - The Net Change field will be updated. When no flowfilter was applied, both Net Change and Balance were showing the same amounts. Refer to the following screenshot:
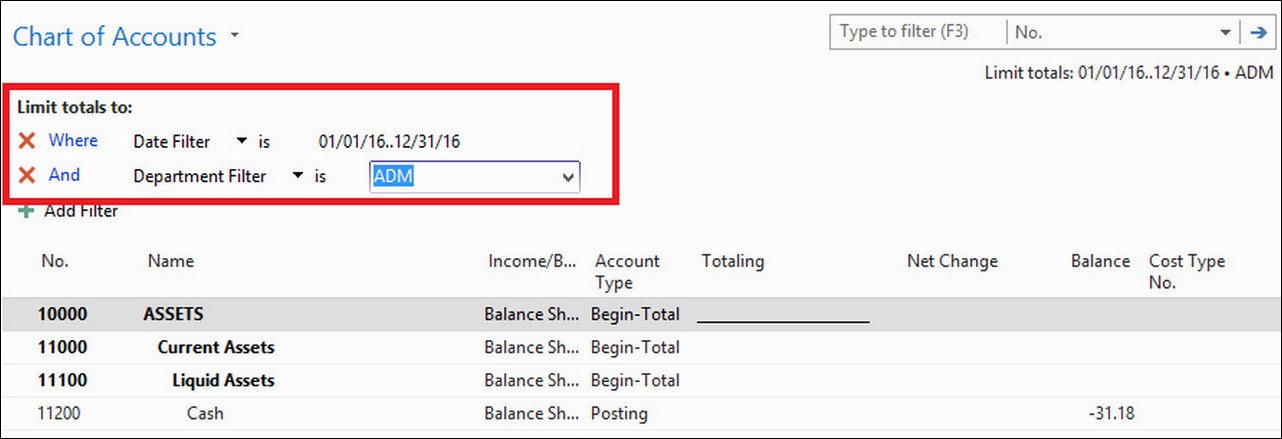
Not all flowfilters apply to all flowfields. In the example, we have seen that, after applying a date flowfilter, the Net Change field gets updated and shows only the sum of G/L entry amounts of the specified period, while the Balance field has remained the same. This is because of the definition of the fields. The definition of the Net Change field states that the calculation for this field will take into account a date filter, while the Balance field does not.
We have seen how to apply filters and flowfilters on pages. But if we leave the page and open it again later on, the filter is gone. We have to apply the same filter or flowfilter over and over again if we want to see the same results. Wouldn't it be great if we could save the filters so that we could apply them as many times as we wish without having to select again the fields we want to filter and writing the filter expression? That is possible by saving views.
To save a view, perform the following steps:
- Follow the steps mentioned in the previous section to apply filters on the item list page.
- Click on Items and select Save View As....
- Specify a Name for the view and select the Activity Group in which you want to save your view, as shown in the following screenshot:

Every time you want to see your saved view, follow the given steps:
- Click on Home (or on the Activity Group in which you have saved your view).
- Click on your saved view.