
Chapter 14. Case Study: The 1960s
“The expiration of the 15-year interval is the point where all the movements even up temporarily. They come into a sort of balance. Even though it won’t last, it helps us to look back and find out what has really happened, and it enables us to begin a new series of forecasts.”1 —George Lindsay
Introduction
When the end of a standard basic move and the end of a long-term interval coincide in time, there is a “decisive and often violent movement” in the market. This can be seen at several points in time, including the highs of September 1929, March 1937, and December 1968, and the lows of July 1932 and June 1949. In this case study, and final chapter of the book, a single decade is examined with the intent of illustrating the concepts covered in previous chapters.
1960–61 Advance
It would have been nice if the decade had started with something more traditional, but instead it chose to begin with two anomalies: a subnormal advance that is quite unusual and a time period (August 1959 to December 1961) that Lindsay considered an example of a 3PDh pattern taking the place of a bear market. The analysis starts with the longer-term counts as it should.
The 15-year interval from the October 1946 low implied that we should have looked for a high sometime between December 1961 and February 1962. In hindsight, we can see that the November 1961 (intraday) high counts 15 years, 1 month from the October 1946 low and 8 years, 2 months from the September 1953 low. The December 1961 (closing) high, of course, counts to 1 month later.
But when looking for a medium-term interval of about two years, a wide discrepancy is found. The current bull market had begun October 25, 1960. Even if the advance were to be of the minimum duration, 610 days, the high wouldn’t come until June 1962 at the earliest.
Counting the basic advance from October 25, 1960, to the intraday high on November 15, 1961, is only 386 days—an irregular advance. The same is true if the count is taken to the closing high on December 13th. There have been only three genuine advances that have been subnormal: those of 1932–34, 1946–48, and 1960–61. To sum up the matter: Most market movements have always followed the Standard Time Spans: short, mean, long, extended. A few movements have not, and then the timing norms are worthless. But in these cases, you have the shape of the moves on a chart to go by. When a 3PDh appears, act according to its shape, not the number of days.
The 1961 high was an almost unique case. Finding the top was not problematic, however, as the time period from August 1959 to December 1961 unfolded as a Three Peaks and a Domed House pattern (see Figure 14.1). When you look at the chart of the period from August 1959 to December 1961, it is hard not to recognize the shape of the 3PDh. A pattern of this kind can simply take the place of a regular advance. In order to target the top of the pattern with the 221- to 224-day count, in this case it must be counted from the top of the First Floor Roof. From May 19, 1961, to December 13, 1961, counts 208 days, 13 days short of the typical count. While not unprecedented, counting from the First Floor Roof is unusual.
Figure 14.1. 1960–61 advance 3PDh. Chart created by MetaStock®.

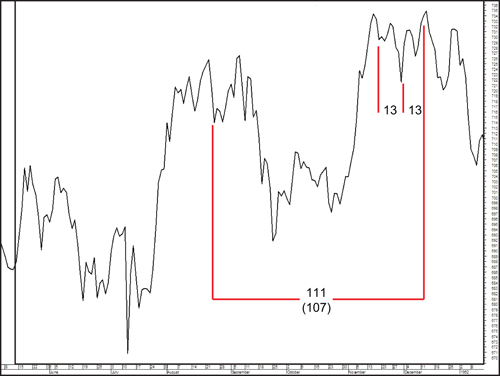
A 107-day Top-To-Top count starts August 24, 1961, and counts 111 days to the December 13th top—well within the ±5-day window surrounding the target date 4 days earlier (see Figure 14.2). A minor Low-Low-High interval of 13 days stretches from the lows of November 17th to November 30th and on to the high of December 13th. A major Low-Low-High interval can be counted using the major low of December 5, 1960, and the minor low of May 26, 1961. They count 171 days to Sunday, November 12, 1961—3 days off from the alternate high of November 15, 1961 (see Figure 14.1).
Figure 14.2. 1960–61 advance Lindsay Timing Model. Chart created by MetaStock®.
1961–62 Decline
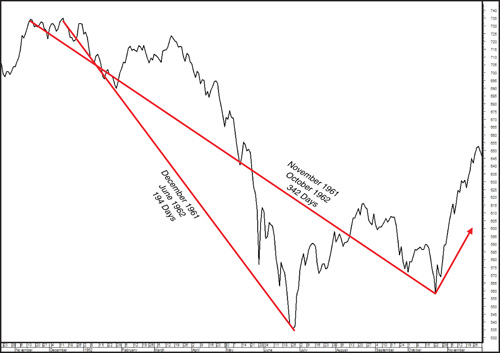
The drop from December 1961 to the market low in June 1962 was only 194 days—too short to constitute a basic decline, so we look for a secondary low that often follows such a break (see Figure 14.3). It came on October 23, 1962. It was higher than the June low and only 10 months after the high (not the 13–14 months that we normally expect), but that doesn’t matter. The secondary low of October 23, 1962, came 314 days after the December high—barely enough time to qualify as a short basic decline. Sometimes it is more accurate to use intraday figures than closing prices. The intraday high came on November 15, 1961. From there, the low in October came an ideal 342 days later. So, the decline of 1961–62 is considered as having ended in October 1962 and the next basic advance must begin on the same day. The 12-year interval counts 12 years, 4 months from the high of June 1948 to October 1962.
Figure 14.3. 1961–62 decline. Chart created by MetaStock®.
1962–66 Advance
When the Dow started up on October 23, 1962, it was known, from the Principle of Alternation, that the advance would be long because the previous advance (October 1960–November/December 1961) had been a short basic advance. What wasn’t known is if it would be extended. If the advance had been merely long, it would have lasted until December 1964 (2 years, 2 months).
Note the 12-year interval starting at the high of January 1953. It called for a low sometime between March (12 years, 2 months) and September (12 years, 8 months) 1965. Taking full advantage of the time span and counting to September 1965 would still mean a decline of only about 8 months from a possible high the previous December. That would have been barely long enough for a subnormal basic decline.
In this scenario, a new basic advance would then begin in September 1965. Looking ahead, the end of the next 15-year interval from September 1953 targeted a major top toward the end of 1968 (rule of thumb: 15 years, 2 months). If a basic advance began in September 1965, it would need to run for 3 years, 3 months. That time span is much too long for a basic advance using the Standard Time Spans.
The market continued to advance through December, and by mid-May 1965, the advance from the low of October 1962 had endured for 934 days. That is just about the maximum duration of an extended basic advance. No advance has ever exceeded the limit of 929 to 968 days. The advance had to end soon, yet, other than an interim correction, a full-fledged bear market was not in the cards. With the 12-year low mentioned previously, expected no later than September 1st, any decline beginning the previous May could therefore last only about 110 days. That isn’t nearly long enough to constitute a basic decline.
Another problem is that any advance that begins in response to a 12-year interval usually lasts seven months or longer, and that’s what happened here. Seven months is too long for a rally in a bear market that, in this scenario, was to have started in May 1965.
The only other alternative is that the latter part of 1965 will be a sideways movement. The 12-year low actually came at the end of June 1965. Seven months from late June 1965 places the final high at about the end of January 1966. The bull market ended in February 1966, and that was the end of the sideways movement (see Figure 14.4). The high in February 1966 was higher than it had been in May 1965 when the sideways movement started. It doesn’t matter. The highest point of a sideways movement may come at the start, in the middle, or at the end. The trend is suspended during a sideways movement. It resumes as soon as it ends.
Figure 14.4. 1962–66 advance. Chart created by MetaStock®.
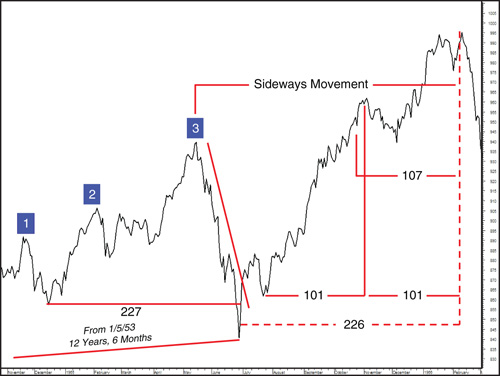
Another way of targeting the February 1966 top is a 3PDh that extended from late 1964 to the top on February 9, 1966 (see Figure 14.4). The three peaks are seen in November 1964, February 1965, and May 1965. Peak 3 even breaks down into a fractal of a complete 3PDh formation. With the major 3PDh having a nonsymmetrical base, the 221- to 224-day count originates at the bottom of the Separating Decline, June 28th, and counts 226 days to the February high.
The February 9th high to the bull market was an exact 107 days from the key date of October 25, 1965, a dip prior to a top. The 107-day interval count is confirmed by a major LLH interval consisting of 101 days from July 22, 1965, to November 1, 1965. Counting forward another 101 days targets February 9, 1966. Another major LLH interval originates at the bottom of the reaction from Peak 1 and counts 227 days to the bottom of the Separating Decline. Counting from there to the bull market high was 226 days.
1966 Decline
After the market top on February 9, 1966, the Dow fell for 97 days to May 17th. This could not be the ultimate bottom of the decline for two important reasons. First, the decline from February to May, at 97 days, was much too short for any of the Standard Time Spans.
Second, the next bull market high was not due until sometime between November 1968 and January 1969. This estimate came from counting 15 years, 2 months and 15 years, 4 months from the September 1953 low. The count from May 1966 to November 1968 was 915 days. That would have put the advance into the “no man’s land” between a long (830 days) and an extended (929 days) basic advance.
January would have been 2 years and 8 months, or 976 days. Extended advances can continue for as much as 2 years and 7 months. Note that 976 days is beyond the 968-day limit and, in addition, the market just had an extended advance in 1962–65. Two such advances have never followed one another in succession (Principle of Alternation).
If the decline was to continue, at some point there should be two rallies in succession in roughly the same price range. This decline saw three rallies, rather than two, from the low of May 17th to the high of July 8th (see Figure 14.5). In major bear markets of the past, the two or three rallies have often continued for 15 to 18 weeks. These rallies lasted only 52 days, less than two months. When there are three rallies, one of them (usually the last, but it was the first in 1937) is either brief or inconsequential.
Figure 14.5. 1966 decline. Chart created by MetaStock®.

The decline from February 9, 1966, to October 7, 1966, was subnormal as it lasted only 239 days. The brevity of the three rallies was a hint, but not conclusive evidence, that the decline would be shorter than usual.
There was another, more specific way to time the basic low in late 1966, however. Looking all the way back to 1965, the Dow fell from May 14th to June 10th. The Dow then rose one day (June 11th), fell one day, and then rose for three days to culminate on June 17th. Two distinct rallies in the same price range, and the average subsequently fell lower. This fulfills the essential requirements of a Descending Middle Section. As a rule, the rallies in a Middle Section last longer, but the essential requirement is a sharp break between the two rallies of a Descending Middle Section. This is the same Descending Middle Section that was examined in Chapter 13, “Counts from the Middle Section,” so it won’t be repeated here except to add that this Middle Section also functions as the Separating Decline in the 3PDh mentioned in the earlier discussion of the 1962–66 advance (see Figure 14.4).
1966–68 Advance
Returning to the long-term interval count from the major low on September 14, 1953, this count targets a high in the vicinity of November 1968, 15 years, 2 months later. Remember: The 15-year interval stretches from 15 years to 15 years, 11 months.
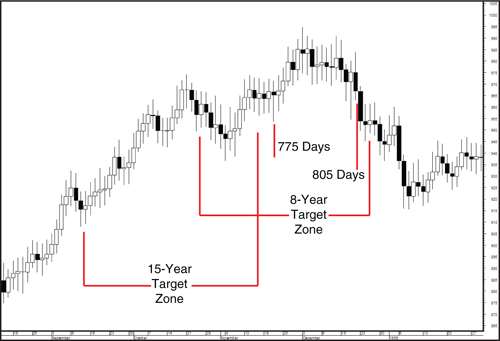
There had been another important low on October 25, 1960. Counting 8 years forward targets 1968. This count places a high between October and December 1968 (8 years to 8 years, 2 months). The two long-term counts coincide, and the very fact that they agreed so closely increased the probabilities of a severe decline (see Figure 14.6).
Figure 14.6. 1966–68 advance: long-term intervals. Chart created by MetaStock®.
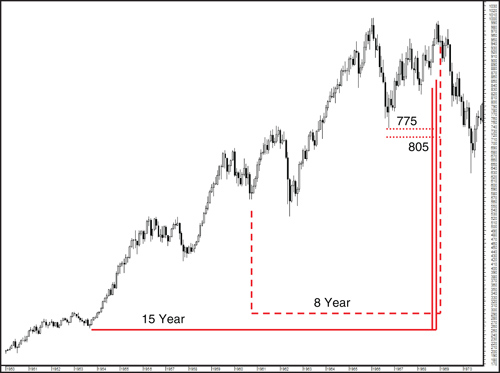
To time the top more closely, refer to the medium-term interval of about 2 years and the bear market low of October 7, 1966. Count the typical duration of a long advance, 775–805 days. This placed the probable time of the top somewhere between November 21 and December 21, 1968 (see Figure 14.7). The bear market low in October 1966 did not begin at a 12-year interval where nearly all major advances have taken off. The year 1966 was not 12 years after any important top. The gain from 1966 to 1968 was therefore only a minor bull market in terms of the Dow Industrials.
Figure 14.7. 1966–68 advance, basic long advance. Chart created by MetaStock®.
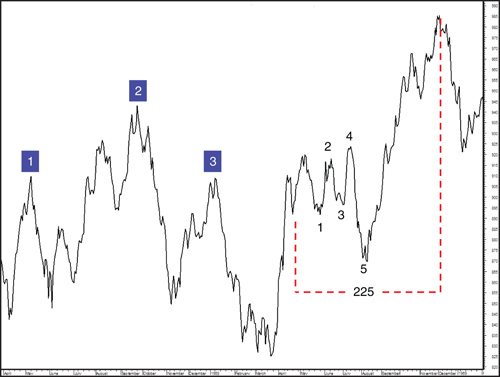
A 3PDh pattern (see Figure 14.8) can also be seen during this period. Peak 1 (May 5, 1967) and Peak 3 (January 8, 1968) are eight months apart. The First Floor Wall takes place March through May 1968 and even has the initial false pullback in April that is fairly common. The First Floor Roof has five reversals. The only tricky item here is that in order to get a count of 221–224 days to time the top, it must be counted from that initial false pullback in April—which counts 225 days. Given that the count is only 1 day more than perfect, and it originates at the bottom of a pullback, this suggests that the top would have been caught by the observant (and patient) analyst.
Figure 14.8. 1966–68 advance: 3PDh pattern. Chart created by MetaStock®.
1968–70 Decline
A low could have been expected in late 1969/early 1970. That is because the 12-year interval from the high of July 12, 1957, placed a low somewhere between September 1969 (12 years, 2 months) and March 1970 (12 years, 8 months). As it turned out, the low arrived 12 years, 10 months later, in May 1970.
Sometime during the decline from December 1968, two rallies in roughly the same price range would be expected to form. The two rallies began on July 29th and lasted until November 10th, 104 days or almost 15 weeks later. The second rally was higher than the top of the first rally. In the majority of cases, the two (or three) rallies make a series of descending tops. The subsequent decline from November 10th to January 30th lasted 82 days and was shorter than most major bear market legs (see Figure 14.9).
Figure 14.9. 1968–70 decline. Chart created by MetaStock®.

January 30, 1970, came 423 days (1 year, 2 months) after a bull market high in December 1968, the typical duration of a long basic decline. Therefore, 14 months after the top, January 30, 1970, becomes a basic low. Unlike 1966, it did not coincide with a bear market low, as the ultimate low came later in May. A basic low that precedes the final bear market low is very important in this system. A new basic advance must be counted from it.
The fluctuations between B and H in 1967–68 constituted an Ascending Middle Section (see Figure 14.9). Point E fell on June 13, 1967, and counts 539 days until the bull market high on December 3, 1968. Counting 539 days from the December high targets May 26, 1970—the exact date of the bear market low. Note that 539 days is longer than the typical “long” bear market. They have ranged between 386 and 448 days. Declines are more likely to be irregular in their durations than advances. Note that in this example, the date Lindsay labeled with the letter J is a bull market top. Point J isn’t always a bull market high.
Before concluding this case study (and this Middle Section), examine the movements between point G and H alone. Ordinarily, they would be merely the second decline in an Ascending Middle Section. But when the decline from G to H contains two rallies at about the same price level, it becomes a Descending Middle Section in its own right.
The decline from point G to H in Figure 14.10 did contain the necessary two rallies, although the dip that separated them was not as sharp as it should have been. This dip was the reaction from December 7th to December 15th. Ideally, prices should have broken under the intraday low posted on December 1st. The demarcation between the two rallies would then have become unmistakable. Nevertheless, the highs of December 7, 1967, and January 9, 1968, must be considered the tops of two separate rallies. December 7th, the high of the next-to-the-last rally, becomes point E. We always count from point E first since it has worked more often than point C.
Figure 14.10. Descending Middle Section, 1967-68. Chart created by MetaStock®.
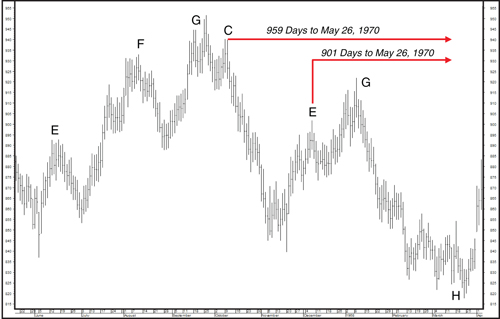
Counting from point E on December 7, 1967, we find that 901 calendar days elapsed until the bear market low on May 26, 1970 (remember that counts from the Middle Section always center on absolute highs and lows and do not use secondary lows). Here is another example of always needing to compare the count from the Middle Section with the Standard Time Spans. In Table 12.1, we found that long advances have continued anywhere from 775 to 830 days, and extended advances have lasted anywhere between 929 and 968 days. But no uptrend since 1877 has ever ended anywhere between 830 and 929 days. Given the historical record, an advance of 901 days was very unlikely.
We abandon point E and go back to point C, the less frequently used measuring point, to see if a count from there will fit better. The Dow formed a small top between September 14, 1967, and October 9, 1967. The first very weak day after the high, October 10th, becomes point C. It was 959 days before the bear market low of May 26, 1970. Counting 959 days forward from there, we arrive at January 9, 1973.
Notice that 959 days fall within the range of extended basic advances as shown in Table 12.1. Early January 1973 was also 15 years and about 2½ months after the bear market low of October 1957. The three ways of counting time coincided as well as they ever do. As it turned out, the bull market high came only two days later than the count from point C indicated it should have—that is, on January 11, 1973.
Conclusion
It is hoped that this case study will help the reader assimilate the material in the preceding chapters. It can be seen that, in the real world, the counts are rarely exactly what Lindsay had prescribed, yet they are surprisingly close, and oftentimes they are exactly as he had written. As noted in the Introduction, it is important to learn the rules and specific counts Lindsay laid out in his years of writing newsletters. Once those guidelines are firmly in mind, you can use them as an anchor from which to drift with the market’s ebbs and flows. It is with this footing that you can then declare that you truly have a “feel for the market.”
Endnote
1 Unless otherwise indicated, all quotes in this chapter are taken from George Lindsay’s self-published newsletter, George Lindsay’s Opinion, during the years 1959–72.