
9.2. Metal Combustion Thermodynamics
9.2.1. The Criterion for Vapor-Phase Combustion
What is unique about metal particles burning in oxygen is that the flame temperature developed is a specific known value—the vaporization–dissociation or volatilization temperature of the metal oxide product. This temperature could be referred to as a boiling point. This interesting observation is attributable to the physical fact that the heat of vaporization–dissociation or decomposition of the metal oxide formed is greater than the heat available to raise the condensed state of the oxide above its boiling point. That is, if QR is the heat of reaction of the metal at the reference temperature 298 K and  is the enthalpy required to raise the product oxide to its volatilization temperature at the pressure of concern, then
![]() (9.1)
(9.1)
where ΔHvap–dissoc is the heat of vaporization–dissociation of the metal oxide [3]. Note that QR is the negative of the heat of formation of the metal oxide. Equation (9.1) assumes conservatively that no vaporization or decomposition takes place between the reference temperature and the volatilization temperature.
The developments in Chapter 6 show that in the steady state the temperature of the fuel particle undergoing combustion approaches its boiling point (saturation) temperature at the given pressure. Characteristically, it is a few degrees less. For a condensed-phase fuel to burn in the vapor phase, the flame temperature must be greater than the fuel saturation temperature so that the fuel will vaporize and diffuse toward the oxidizing atmosphere to react. For liquid hydrocarbon fuels, the droplet flame temperature is substantially higher than the fuel saturation temperature. However, many metals have very high saturation temperatures. Thus, for a metal to burn as a vapor, the oxide volatilization temperature must be greater than the temperature of the metal boiling point. This statement is known as Glassman's criterion for the vapor-phase combustion of metals. The metals that will burn in the vapor phase in oxygen can then be determined by comparing the second and last columns of Table 9.1 for the appropriate oxide.
9.2.2. Thermodynamics of Metal–Oxygen Systems
Modern computational programs [4] and thermodynamic tables [5] now make it possible to explicitly calculate metal–oxygen flame temperatures, thereby opening up a unique aspect of combustion thermodynamics that could be important in the consideration of metal as fuels and as reactants in combustion synthesis.
As early as 1953, Brewer [6] elaborated on the fact that an equilibrium thermodynamic boiling point is difficult to define for many metal oxides. Indeed, the experimental evidence demonstrated that many metal oxides volatilize exclusively by decomposition to gaseous suboxides and elements such as O2, or by dissociation to species such as O. Few actually formed gaseous molecules of the original metallic oxide. Subsequent investigators [1,7] recognized the importance of dissociation in metal combustion systems. But despite the understanding of the thermodynamic definition of boiling point implied by this recognition, the term was used to describe the vaporization–decomposition process of metal oxides. The JANAF tables [5] recognize the difficulty of defining a true boiling point for metallic oxides. In a few cases, a “decomposition temperature” is defined for a particular reaction equilibrium. For MgO, for example, a “decomposition or boiling temperature (3533 K)” is defined at 1 atm, where the free energy change of the reaction MgO(l) → MgO(g) approaches zero. Similarly, a heat of vaporization is defined as the difference between  for MgO(g) and MgO(l), where
  is the standard state heat of formation [5]. This definition, however, is not acceptable in the case of many metal oxides, including MgO. The term “boiling temperature” would be correct for the Mg–O2 system if MgO(l) were vaporized congruently to MgO(g). But as the JANAF tables note, “vaporization near 2000 K is primarily to the elements Mg(g) and presumably O(g) and O2(g) rather than to MgO(g)” [5]. The term “vaporization–decomposition” temperature would probably be more appropriate to describe the volatilization of metallic oxides. In fact, this temperature was later defined as a “volatilization temperature, exhibiting characteristics of a transition temperature or boiling point” [6]. Furthermore, in order to distinguish between the condition of complete decomposition of a nitride and the condition in which all the decomposed products are gases, the decomposition temperature and volatilization temperatures will be defined more explicitly.
Table 9.1
Various Properties of Metal Oxides and Nitrides
| Metallic Compound | Tvola,b (K) | ΔHvola,b (kJ/mol) | Metal Tbc (K) | ||
| AlN | 2710 (2710) | 620 (620) | 740 (730) | −318 | 2791 |
| Al2O3 | 4000 | 1860 | 2550 | −1676 | 2791 |
| BN | 4010 (2770) | 840 (300) | 950 (410) | −251 | 4139 |
| B2O3 | 2340 | 360 | 640 | −1272 | 4139 |
| BeO | 4200 | 740 | 1060 | −608 | 2741 |
| Cr2O3 | 3280 | 1160 | 1700 | −1135 | 2952 |
| FeO | 3400 | 610 | 830 | −272 | 3133 |
| Li2O | 2710 | 400 | 680 | −599 | 1620 |
| MgO | 3430 | 670 | 920 | −601 | 1366 |
| Si3N4 | 3350 (2150) | 2120 (870) | 2420 (1160) | −745 | 3505 |
| TiN | 3540 (3450) | 700 (450) | 950 (710) | −338 | 3631 |
| Ti3O5 | 4000 | 1890 | 2970 | −2459 | 3631 |
| ZrO2 | 4280 | 920 | 1320 | −1097 | 4703 |
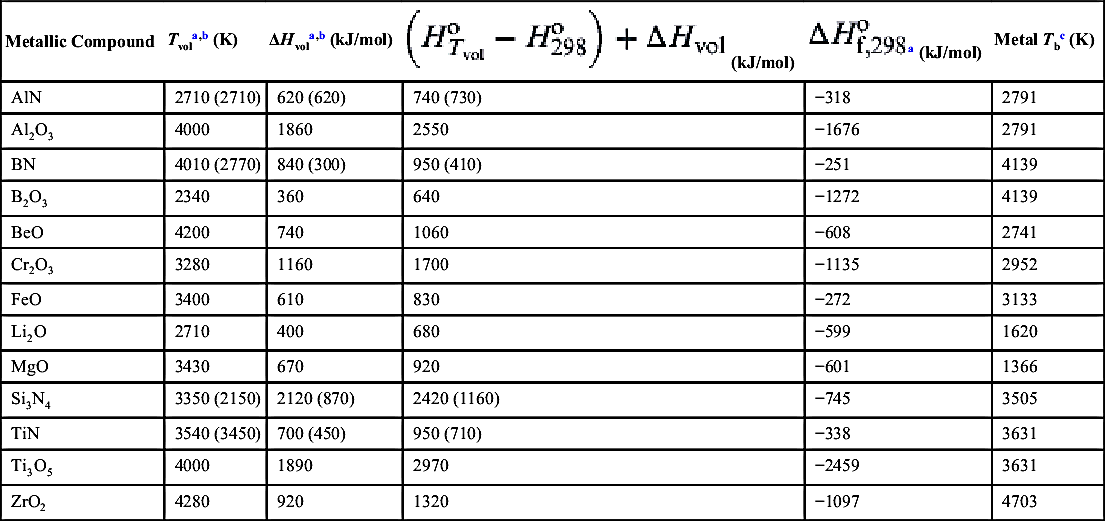
Note: Tvol, volatilization temperature (or stoichiometric adiabatic combustion temperature creating compound under ambient conditions T = 298 K, P = 1 atm); Tb, metal boiling point at 1 atm; Td, decomposition temperature (see text).
a Values reported are rounded to the nearest integer.
b Values in parentheses are (or are based on) decomposition temperatures, Td, or enthalpies of decomposition, ΔHd.
c Values from JANAF tables.
Von Grosse and Conway [7] were the first to realize that the evaluation of the adiabatic combustion temperatures for metal–oxygen systems was largely dependent on the metal oxide volatilization characteristics. Recognizing that many metallic oxides do not exert any appreciable vapor pressure until they reach very high temperatures, these investigators concluded that the enthalpy required for complete volatilization was large. Citing aluminum oxide as an example, von Grosse and Conway noted that “only about 140 kcal/mol are required to heat aluminum oxide to its boiling point. The heat amounting to the difference between 400.2 (the enthalpy of reaction) and 140 kcal must be interpreted as being used to vaporize and decompose the aluminum oxide at its boiling point (aluminum oxide decomposes on vaporization). The combustion temperature is thus limited to the boiling point of the oxide (emphasis added). This is the case in many metal–oxygen systems, but each reaction must be evaluated independently.”
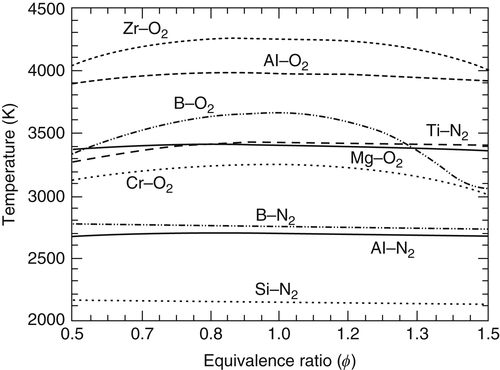
The current ability to readily calculate combustion temperatures has confirmed the concept of a “limiting temperature” [1,7] in metal processes. The term limit temperature is now used as a formal statement that the enthalpy of combustion of the reactants at the stoichiometric ambient (298 K) condition is insufficient to volatilize all the condensed-phase metallic oxide formed; that is, the metallic oxide undergoes a phase change. This concept of a limit temperature can be applied to metal–nitrogen systems as well [8]. Shown in Figure 9.1 are the adiabatic combustion temperatures at 1 atm, calculated for the oxidation and nitriding of many metals at 298 K as a function of the equivalence ratio ϕ. Of course, a value of ϕ greater or less than 1 signifies an excess of one or the other of the reactants. Note that the temperature variation over a wide range (0.5–1.5) of equivalence ratios varies by only a few percent for many metal–oxygen/nitrogen systems. Boron is an exception because, at the stoichiometric value with oxygen, no condensed phases exist in the combustion products. Off stoichiometric for other metal–oxygen/nitrogen systems, a temperature is reached that will vary minimally as stoichiometric is approached. The only reason there is a variation with equivalence ratio is that the equilibria of the decomposed metal oxide or nitride species are influenced by an excess of one of the reactants. Of course, it is possible to be so far off stoichiometric that the temperature drops appreciably to a value indicative of transition temperatures for other condensed-phase products formed. The point is that the very weak dependence of the combustion temperature over a wide range of equivalence ratios near stoichiometric further confirms the reasoning that the adiabatic combustion temperature in pure oxygen and nitrogen is limited due to the volatilization of the condensed-phase product formed. It would be possible, of course, to exceed this limiting temperature for a stoichiometric metal–oxygen/nitrogen system if the reactants were initially at very high temperatures.
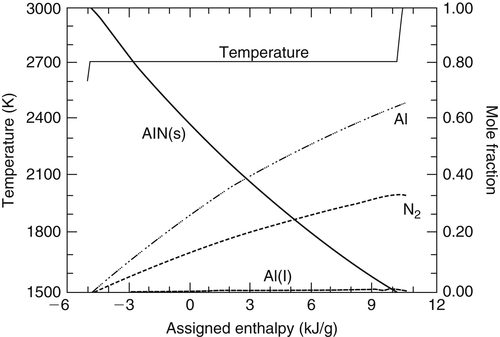
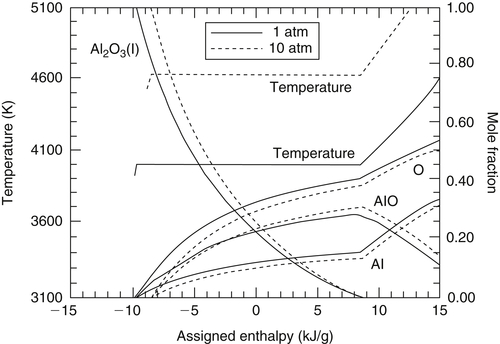
The equilibrium combustion temperatures and compositions of many metal–oxygen/nitrogen systems were calculated by assigning various values of the total enthalpy,  , of these reactants at a given, fixed total pressure [8]. One should recognize that this procedure is analogous to varying the total enthalpy or the enthalpy of formation of the product metal oxide or nitride. Performing these calculations for stoichiometric proportions of metal and oxidizer provides a means for the determination of the enthalpies needed to completely decompose and/or volatilize the metal oxide or nitride in question. Shown in Figures 9.2–9.9 are the results for most of the systems designated by the product compounds listed in Table 9.1. An input “assigned” enthalpy of zero is a condition equivalent to one in which the reactants enter at the ambient (298 K) state. Examining Figure 9.2 for the Al–O2 system, one notes that the product composition shows a 0.216 mole fraction of Al2O3 liquid at this initial reactant state. As the input enthalpy increases, the temperature remains the same, but the amount of Al2O3 liquid decreases. When the assigned enthalpy reaches 8.56 kJ/g reactants, condensed-phase Al2O3 no longer exists and any further increase in the total assigned enthalpy raises the temperature. It is also possible to withdraw enthalpy from the system. Again, the temperature does not change, but the amount of Al2O3 liquid increases. When an enthalpy of 9.68 kJ/g reactants is withdrawn, the temperature begins to drop and the product composition contains only condensed-phase Al2O3. These results verify that a “pseudo-phase change” exists and that the limiting combustion equilibrium temperature has characteristics “similar to a boiling point.” An enthalpy of volatilization can thus be calculated for
  to be {[8.56 − (−9.68)]102} = 1860 kJ/mol. Obviously, this enthalpy of volatilization/decomposition holds only for the stoichiometric condition, or more precisely, when the ratio of metal to oxygen (nitrogen) reactants is equal to that of the oxide (nitride) in question. This value of 1860 kJ/mol plus the enthalpy 688 kJ/mol needed to raise Al2O3 liquid to the limiting temperature is clearly greater than 1676 kJ/mol, the overall enthalpy of reaction or the enthalpy of formation of the metal oxide at the ambient condition (see Table 9.1). This example and the results shown in Figures 9.2–9.9 appear to verify that limiting combustion temperatures are reached for many metal–oxygen/nitrogen systems. The approach has been adopted for alloys as well [9]. It is also worthwhile to point out that the gaseous species listed in Figure 9.2 have all been identified in the combustion of aluminum. However, it is to be noted that in the case of aluminum, and perhaps other metals, that the chemical structure of the condensed phase product is not found to exist in that phase. The actual physics of the chemical nucleation process to form condensed phase Al2O3 from the gaseous species is still not understood.


It is necessary to distinguish between the limiting decomposition temperature and the limiting volatilization temperature as well as their corresponding enthalpies of decomposition and volatilization. For example, depending on the system and system pressure, a decomposing refractory product may produce a species in a condensed phase. There is a temperature associated with this condition designated as the limiting decomposition temperature. As the assigned enthalpy is increased past the value that produced the limiting decomposition temperature, the condensed-phase product of decomposition volatilizes further. The temperature increases gradually with respect to this assigned enthalpy increase until the condensed-phase product species is completely vaporized, at which point the temperature rises sharply. The point of this sharp rise is designated the volatilization temperature. At 1 atm, none of the oxide systems exhibits a condensed-phase decomposition product so that the decomposition and volatilization temperatures, Td and Tvol, are the same. These two limiting temperatures and their corresponding enthalpies are readily seen in Figure 9.8 for the Ti–N2 system at 1 atm. This consideration could be particularly important in various combustion synthesis approaches.
A volatilization temperature for the B–O2 system can be defined only if sufficient enthalpy is withdrawn to allow for B2O3(l) (see Figure 9.5). This value of 2340 K corresponds exactly to the “boiling point” (2340 K) reported in the JANAF tables as the temperature at which the fugacity is 1 atm for B2O3(l) → B2O3(g). Since B2O3(l) vaporizes congruently to B2O3(g), the boiling point reported for this case should equal the calculated volatilization temperature.
The JANAF tables specify a volatilization temperature of a condensed-phase material to be where the standard-state free energy  approaches zero for a given equilibrium reaction, that is,
  . One can obtain a heat of vaporization for materials such as Li2O(l), FeO(l), BeO(l), and MgO(l), which also exist in the gas phase, by the differences in the of the condensed and gas phases at this volatilization temperature. This type of thermodynamic calculation attempts to specify a true equilibrium thermodynamic volatilization temperature and enthalpy of volatilization at 1 atm. Values determined in this manner would not correspond to those calculated by the approach described simply because the procedure discussed takes into account the fact that some of the condensed-phase species dissociate on volatilization.
Examination of Figure 9.4 for the B–N2 system reveals that BN decomposes into gaseous nitrogen and liquid boron. Since these elements are in their standard states at 1 atm and the decomposition temperature, the  must equal the enthalpy of formation of the BN at the decomposition temperature. Indeed, the (300 kJ/mol) calculated by the means described agrees with the value of
  (300 kJ/mol) given in the JANAF tables, as it should. The same condition holds for the Si–N2 system.
As noted in Figure 9.8, over the range of assigned enthalpies that define the limiting decomposition temperature, the major TiN decomposition products are Ti(l), Ti(g), and N2. Since both Ti(g) and Ti(l) exist, the products of decomposition are not in their standard states. For TiN, then, unlike BN, the enthalpy of decomposition will not equal the enthalpy of formation at the decomposition temperature. When the assigned enthalpy is increased to 9.9 kJ/g reactants for the Ti–N2 system, the decomposition products are only gases (Ti(g) and N2). This condition specifies a volatilization temperature of 3540 K and a partial Ti(g) pressure of 0.666 atm. At 0.666 atm, the vaporization temperature for titanium has been found to be 3530 K. Indeed, neglecting dissociation, the values should be the same because the vaporization of Ti becomes the limiting condition. The enthalpy of volatilization for TiN, as determined by the procedure described here, is then found to be 700 kJ/mol. A value for the enthalpy of volatilization can be estimated as the heat of formation of TiN at 3630 K [7], the vaporization temperature of Ti at 1 atm. This value is of the order of 690 kJ/mol. Since the enthalpy of vaporization of Ti is not a function of pressure or temperature, the agreement between the value of enthalpy of volatilization of TiN at 3540 K and the estimated value of the enthalpy of formation of TiN from the JANAF tables at 3630 K, where the value has been determined at 1 atm, is not surprising.
The volatilization process of the metal oxides behaves like a “pseudo-boiling point.” For the volatilization of liquid Al2O3 alone, Brewer and Searcy [10] clearly pointed out that AlO(g) is the principal species, so that Al2O3 → 2AlO + O is the principal reaction of concern. From Figure 9.2, one sees clearly that as enthalpy is increased in the stoichiometric Al–O2 system, the equilibrium shifts to favor more AlO(g) and O(g) and less Al2O3(l). As in the case of Al2O3, such dissociated species as O are important in the volatilization process of many metal oxides. Dissociation is also evident with the nitrides. Therefore, if the pressure is increased, as dictated by Le Chatelier's principle, less dissociation occurs; thus, a smaller enthalpy of volatilization or decomposition and a higher adiabatic combustion temperature are found for most of the metal–oxygen and nitrogen systems examined. Figure 9.10 depicts the temperature variation of the Al–O2 system over a 10-fold variation in pressure. Indeed, if the total pressure is increased from 1 to 10 atm in the stoichiometric Al–O2 system, the heat of volatilization decreases by approximately 7% and the temperature increases by 15%. Similarly, there is an approximate 4% decrease in the volatilization enthalpy and a 17% increase in the temperature for the Mg–O2 system. With respect to the compositions shown in Figures 9.2–9.9, the variations in the species composition can be explained by the combination of temperature and pressure effects, not just by pressure alone.
The volatilization or pseudo-boiling point temperature and the corresponding enthalpies of decomposition and volatilization of all the systems examined as a function of total pressure are reported in Table 9.2. The variation in the enthalpy of volatilization as a function of pressure is generally less than 7%. The Ti–O2 system (Figure 9.7) shows an anomalous rise in  with pressure. When the Al–N2 system is raised from 0.1 to 10 atm, the Al(g) product condenses and the species of decomposition are no longer in their standard states. When the assigned enthalpy is increased further so that the Al returns to the gaseous state, an enthalpy of volatilization based on this new assigned enthalpy can be defined. The values of specify these new values based on the condition that the elements are in their gaseous states at the pressure and volatilization temperature. When values of for the metal–nitrogen systems are calculated for the condition in which the decomposition products are completely in the gaseous state, the pressure variation of , unlike , is minimal.
The apparently anomalous result that the of the Ti–O2 system rises with pressure is explained by examining the volatilization product compositions as a function of pressure. The following equilibria exist for this system:
![]() (9.2)
(9.2)
![]() (9.3)
(9.3)
As the pressure is increased in the system, the equilibrium designated as reaction (9.2) shifts to Ti3O5(l) because the pressure effect overrides the increase in temperature with pressure that would make the shift to the gaseous products. Indeed, at a given assigned enthalpy, the Ti3O5(l) mole fraction increases as the total pressure increases. For the equilibrium designated as reaction (9.3), however, the increase of temperature with pressure overrides the shift that would occur due to pressure; so there is more dissociation, resulting in a greater quantity of O atoms. This trend explains the increase in with pressure for the Ti–O2 system and for other systems that form the more complex stable oxides.
Table 9.2
Temperatures and Heats of Volatilization of Various Oxide and Nitride Products at Various Pressuresa
| Metallic Compound | Tvolb,c (K) | ΔHvolb,c (kJ/mol) | ||||
| 0.1 atm | 1 atm | 10 atm | 0.1 atm | 1 atm | 10 atm | |
| AlN | 2110 (2410) | 2710 (2710) | 3290 (3030) | 630 (630) | 620 (620) | 620 (370) |
| Al2O3 | 3540 | 4000 | 4620 | 1970 | 1860 | 1750 |
| BN | 3470 (2540) | 4010 (2770) | 4770 (3040) | 830 (300) | 840 (300) | 850 (300) |
| B2O3 | 2080 | 2340 | 2670 | 370 | 360 | 360 |
| BeO | 3640 | 4200 | 4980 | 740 | 740 | 730 |
| Cr2O3 | 2910 | 3280 | 3760 | 1180 | 1160 | 1140 |
| FeO | 2940 | 3400 | 4050 | 610 | 610 | 610 |
| Li2O | 2330 | 2710 | 3270 | 410 | 400 | 400 |
| MgO | (s) | 3430 | 4020 | (s) | 670 | 640 |
| Si3N4 | 2880 (1960) | 3350 (2150) | 4000 (2370) | 2120 (870) | 2120 (870) | 2140 (860) |
| TiN | (s) | 3540 (3450) | 4250 (3960) | (s) | 700 (460) | 700 (370) |
| Ti3O5 | 3470 | 4000 | 4740 | 1800 | 1890 | 1930 |
| ZrO2 | 3790 | 4280 | 4920 | 930 | 920 | 910 |

Note: (s), solid forms.
a Temperatures are those obtained by the reacting systems creating the products under stoichiometric conditions for initial temperature of 298 K.
b Values reported are rounded to nearest integer.
c Values in parentheses are decomposition temperatures, Td, or enthalpies of decomposition, ΔHd.
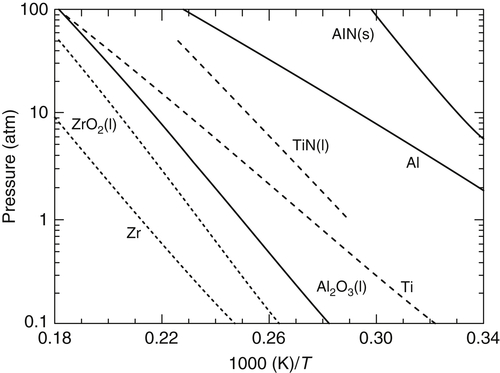
Considering that dissociation occurs on volatilization, the temperatures can be correlated extremely well on a ln P versus (1/Td,vol) plot, where P is the total system pressure and Td,vol is the volatilization or decomposition temperature, as the case dictates. Such a plot is shown in Figure 9.11. Since the Clausius–Clapeyron relation for vapor pressure of pure substances shows an exponential dependence on temperature, Tvol was considered a pseudo-boiling point at the respective system pressure. For a substance that vaporizes congruently to its gaseous state, the slope of lines on a ln P versus (1/Tvol) plot represents the enthalpy of vaporization. Indeed, the enthalpy of vaporization calculated from the slope on a ln P versus (1/Tvol) plot for the B–O2 system (360 kJ/mol) agrees exactly with the value calculated by using the procedure outlined. Since the other metal oxides/nitrides examined do not vaporize congruently to their gaseous state, it is quite apparent that enthalpies of dissociation play a role in determining the slope of the ln P versus (1/Tvol) plots.
Table 9.1 and Figure 9.11 also depict vaporization temperatures of the metals in each product composition and give a graphical representation of Glassman's criterion. When Tvol (or Td, as the case dictates) of the refractory compound formed is greater than the vaporization temperature, Tb, of the metal reactant, small metal particles will vaporize during combustion and burn in the vapor phase. When the contracondition holds, much slower surface reactions will take place. This temperature condition could change with pressure; however, change is not likely to occur over a large pressure variation for combustion in pure oxygen [3]. Thus in pure oxygen, Al, Be, Cr, Li, Mg, and Ti fit the criterion for vapor-phase combustion while B and Zr do not. The temperatures for the criterion for vapor-phase combustion at 1 atm for Fe and Ti are close (about 300 K for Fe and 400 K for Ti); consequently, thermal losses from the flame front would make the actual flame temperature less than the volatilization temperature of FeO and Ti3O5, just to complicate matters. With regard to combustion synthesis processes, it would appear that, at least for nitride formation, heterogeneous surface reactions would dominate the synthesis procedure.
9.2.3. Thermodynamics of Metal–Air Systems
In the metal reaction systems described in the preceding section, the gaseous atmosphere was either pure oxygen or pure nitrogen. Two questions now arise: Would a metal burning in air have a flame temperature equal to the vaporization–dissociation temperature of the metal oxide at the total pressure of the system? And would a temperature plateau exist over a range of equivalence ratios or over a range of assigned enthalpies?
Figure 9.12 details the same type of stoichiometric calculations as shown in earlier figures, except that given amounts of inert (argon) are added to an aluminum–oxygen mixture [11]. In one case, 8.46 mol of argon is added to the stoichiometric amount of oxygen, and in another 2.82 mol. Argon was considered instead of nitrogen because the formation of gaseous nitrogen oxides and aluminum nitride would obscure the major thermodynamic point to be made. As one can see from Figure 9.12, the results with inert addition do not show a complete temperature plateau as the assigned enthalpy is varied. Next, a question arises as to whether the volatilization of the condensed-phase product oxide controls the combustion temperature. Analysis of points 1, 2, 3, and 4 specified on this figure verifies that it does. Table 9.3 lists the data for the explicit calculations at the four points.

Table 9.3
Summary Data for Figure 9.12
| Point | T (K) | Ptot − PAr (atm) | Al2O3(l) (mole fraction) | Ar (mole fraction) | |
| 1 | 0.000 | 4005 | 1.0000 | 0.2160 | 0.0000 |
| 2 | 0.000 | 3769 | 0.3350 | 0.1178 | 0.5868 |
| 3 | 0.000 | 3527 | 0.0931 | 0.0736 | 0.8402 |
| 4 | −3.351 | 3527 | 0.0931 | 0.2271 | 0.7009 |

It is evident from the earlier discussion of the titanium–nitrogen system that the final volatilization temperature (3540 K) was controlled by the complete vaporization of the titanium formed due to the dissociation of the product titanium nitride. The partial pressure of titanium vapor was equal to 0.666 atm at the final volatilization temperature of 3540 K (see Figure 9.8). Indeed, the vaporization temperature of titanium at 0.666 atm is 3530 K. Consequently, to analyze the results in Figure 9.12, the conditions represented by points 3 and 4 were selected in order to consider what the gaseous partial pressures of the aluminum oxide vaporization components would be at the same temperature of 3500 K. Even though different amounts of assigned enthalpies were used in each case, the partial pressures of the oxide volatilization gases (the total pressure less the partial pressure of argon) are equal to 0.0931 atm in both cases.
Figure 9.13 shows a plot of the calculated adiabatic flame temperature for the stoichiometric Al–O2 system as a function of pressure in the form used previously. The solid line labeled 2Al + 1.5O2 is based on the condition that no inert was added. What is significant is that points 3 and 4 on Figure 9.13 were found to have a partial pressure of 0.0931 atm for the dissociated gases—the remaining gas contributing to the total pressure of 1 atm was argon. For a pressure of 0.0931 atm, Figure 9.12 gives a temperature of 3500 K for a stoichiometric Al–O2 mixture. Similarly, for the nonargon gases, the partial pressure for point 2 is 0.3350 atm and the corresponding temperature is 3769 K. Point 2 falls directly on the ln P versus (1/T) line in Figure 9.13. The significance of these correspondences is that the volatilization—or, more explicitly, the enthalpy of vaporization–dissociation determined from Figure 9.2 of the condensed-phase A12O3 that forms—controls the flame temperature even when the gaseous mixture reacting with the metal is not pure oxygen.
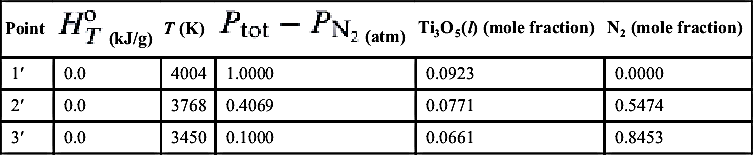
Figure 9.14 reports the data for titanium reacting with air and another O2–N2 mixture at 1 atm under stoichiometric conditions. The temperature–pressure variation for the pure O2–Ti system is also detailed in Figure 9.13. Table 9.4 reports data similar to those in Table 9.3 for the aluminum system. Note that point 3′ (Ti–air) has a combustion temperature of 3450 K and a partial pressure of the nonnitrogen decomposition gases of 0.10 atm. The Ti–O2 system data in Figure 9.13 reveal that at a pressure of 0.10 atm the adiabatic flame temperature should be 3471 K. For point 2′, where the amount of nitrogen is one-third that in air, the combustion temperature is 3768 K, and the partial pressure of nonnitrogen decomposition gases is 0.4069 atm. The temperature for this pressure in Figure 9.13 is 3777 K. Thus, it is concluded that the formation of nitrogen oxides has a minimal effect on the controlling vaporization characteristics of the condensed-phase Ti3O5 that forms. When the N2 was replaced with the same molar concentration of Ar for the Ti–air case (3Ti + 2.5O2 + 9.4N2), even though the specific heats of N2 and Ar are greatly different, the corresponding noninert partial pressure was 0.1530 atm and the adiabatic flame temperature was 3558 K. The flame temperature calculated for the pure O2–Ti system at 0.1530 atm is also 3558 K, and the condition falls exactly on the P–T relationship for the Ti–O2 system in Figure 9.13.
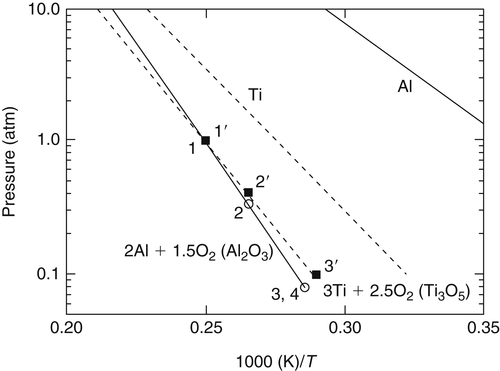

Table 9.4
Summary Data for Figure 9.14
| Point | T (K) | Ti3O5(l) (mole fraction) | N2 (mole fraction) | ||
| 1′ | 0.0 | 4004 | 1.0000 | 0.0923 | 0.0000 |
| 2′ | 0.0 | 3768 | 0.4069 | 0.0771 | 0.5474 |
| 3′ | 0.0 | 3450 | 0.1000 | 0.0661 | 0.8453 |
These results for the metal reactions in air and oxygen–argon mixtures have great practical significance. In solid propellant rocket operation, the temperature of the flame around a burning aluminum particle will correspond to the volatilization temperature of the oxide at a pressure less than the total pressure; consequently, the radiative contribution to the propellant grain would not correspond to the known volatilization temperature at the total pressure, but to some lower temperature that would vary with the propellant composition. Furthermore, it is possible that some metals that would burn in the vapor phase in pure oxygen at 1 atm may burn heterogeneously in air.
As noted in the previous section, the condition for vapor-phase combustion versus heterogeneous combustion may be influenced by pressure by its effect on the flame temperature (Tvol or Td) as well as by its effect on the vaporization temperature of the metal reactant (Tb). For aluminum combustion in pure oxygen, combustion for all practical conditions occurs in the vapor phase. In air, this transition might be expected to occur near 200 atm as shown in Figure 9.15 where for pressures greater than ∼200 atm, the vaporization temperature of pure aluminum exceeds the adiabatic flame temperature. This condition is only indicative of that which will occur in real particle combustion systems as some reactant vaporization will occur at temperatures below the boiling point temperature of pure Al when inert and product species are present near the particle surface. In solid propellant rocket propulsion, aluminum is mostly oxidized by other oxygen-containing oxidizers, such as CO2 and H2O, since for the generally fuel-rich propellants, the amount of O2 formed in the gaseous products is small (or rapidly consumed by the hydrocarbon binder). Oxidizers such as CO2 and H2O have also been considered for Mars and lunar propulsion systems or for hydrogen production and underwater propulsion, respectively. Figure 9.15 shows that when aluminum burns with either of these two reactants (with the reactants initially at near ambient conditions), the combustion process will be located much closer to the surface and even possibly burn heterogeneously at considerably lower pressures than with O2 due to the lower heats of reaction and consequently lower flame temperatures.

9.2.4. Combustion Synthesis
The increasing importance of refractory materials has stimulated the search for new, economical techniques for synthesizing a number of substances that are not plentiful or pure enough to be useful. These materials are needed because new technologies require components capable of withstanding higher temperatures, more corrosive atmospheres, and increasingly abrasive environments. Material properties are important limiting factors in the design of cutting tools, turbine blades, engine nozzles, superconductors, semiconductors, electrodes, and certain components of nuclear power facilities. For those materials currently of practical importance, industrial production techniques require large amounts of external heat and involve complex, time-consuming processes. For example, the methods of forming the refractory compound titanium nitride (TiN) employ temperatures from 1400 to 1900 K and require anywhere from several hours to days. Additionally, most of these techniques require significant postprocessing to achieve reasonable purity levels.
A new development in the area of refractory material production began to receive considerable attention in the former Soviet Union in the mid-1970s. Led by Merzhanov and Borovenskaya [2] this work has been recognized as a major advancement and has created a new and important field of study in combustion involving mostly solid-phase (heterogeneous) reactions of metals. This new technique, designated self-propagating high-temperature synthesis (SHS), makes use of the exothermic nature of reactions that form ceramics and similar materials from their constituent elements. Using this process, carbides, borides, selenides, silicides, and sulfides have been fabricated by igniting a compacted mixture of their constituent powders (Table 9.5). Nitrides and hydrides have been produced by igniting powder compacts under nitrogen or hydrogen gas [12]. SHS offers many advantages in comparison with current commercial techniques. It requires much less external heat and far shorter reaction times; moreover, the purity of its products can be better than that of the initial reactants owing to the vaporization of impurities [13]. Initially, very poor yields were recovered using SHS when gaseous reactants N2 and H2 were involved. However, variations of the initial SHS process have improved yields. Such variations include replacing the gaseous nitrogen with a solid source of nitrogen (specifically, sodium azide) [13] and using high pressures in combination with dilution of the initial reactants with the product being produced [13,14]. Indeed, a slurry of liquid nitrogen and titanium powder will, when ignited, propagate a thermal wave and create titanium nitride [15]. Unfortunately, the total mass of titanium necessary to cause thermal propagation of the wave is such that it is in excess stoichiometrically with the nitrogen; thus Ti cannot be completely converted to TiN.
Many SHS processes include an oxide as one of the reactant materials. As a convenience, all the elements to be discussed in the various SHS processes will be referred to as metals. The selection of a metal–metal oxide reacting combination is readily made without detailed thermodynamic considerations. Nevertheless, it is fruitful to examine the overall thermodynamics that govern the choice of a particular SHS combination. Consider the classic thermite reaction
![]() (9.4)
(9.4)
Intuitively, one knows that this equilibrium reaction will proceed to the right to form A12O3 and release heat. What largely determines the direction is the free energy change of the reacting system:
![]()
where the symbols are defined in Chapter 1. In most SHS processes the difference in the total number of moles of product formed compared to the total number of moles of reactant is small, particularly in comparison to that which occurs in the oxidation of a hydrocarbon fuel. Consequently, in SHS processes the order–disorder change is small and indicates that the entropy change must be small. In fact, the entropy change is quite small in these processes so that the TΔS term in the free energy equation above can be neglected even at the elevated temperatures that occur in SHS. Thus the free energy change is directly proportional to the enthalpy change, and the enthalpy change becomes a measure of the direction an SHS reaction will proceed. Since an oxide product is always forming in an SHS system, it is evident that if a metal oxide with a smaller negative heat of formation is reacted with a metal whose oxide has a higher negative heat of formation, an exothermic reaction will occur, in which case the SHS process will proceed. If the opposite condition with respect to the heats of formation exists, the reaction will be endothermic, and conversion will not occur. A good thermodynamic screening method for selecting an SHS process from among all the exothermic, and hence possible, metal–metal oxide systems is to consider the order of the heats of formation in terms of kilojoules per atom of oxygen as originally proposed by Venturini [16]. This procedure is feasible because ΔHo is determined from the heats of formation of the reactant and product oxides. Since the heats of formation of the elements are zero, the molar differences between the two oxides can be accounted for by dealing with the heats of formation per oxygen atom. An example of a molar difference would be
Table 9.5
Compounds Produced by Self-Propagating, High-Temperature Synthesis (SHS)a
| Compounds | Group of Metals of the Periodic Table | ||||||
| II | III | IV | V | VI | VII | VIII | |
| Nitrides | Mg3N2 | BN, AlN | TiN, ZrN, HfN | VN, NbN, TaN(cub) TaN(hex), Ta2N | – | – | – |
| Carbides | – | – | TiCx, ZrCx, | VC, NbC, | WC | – | – |
| HfC (x = 0.6–1.0) | Nb2C, TaC | ||||||
| Borides | MgB2, | TiB, TiB2, | VB, VB2, | CrB, CrB2, | FeB, | ||
| MgB4, | – | ZrB2, ZrB12, | NbB, NbB2, | MoB, Mo2B, | MnB | NiB | |
| MgB6 | HfB2 | TaB, TaB2 | Mo2B5, W2B, WB, WB2 | ||||
| Silicides | – | – | TiSi, TiSi2, | – | – | – | |
| ZrSi, ZrSi2 | MoSi2 | ||||||
| Chalcogenides | – | – | TiSe2 | NbSe2, | MoSe2, | – | – |
| TaSe2 | WSe2 | ||||||
| Solid | TiC–WC, Ni–Al, MoS2–NbS2, BC–BN, NbC–NbN, | ||||||
| Solutions | TiC–TiN, TaC–TaN, NbxZr1−xCyN1−y | ||||||

Table 9.6
Heats of Formation of Certain Oxides
| Oxide | Per O Atom | |
| CaO | −635 | −635 |
| ThO2 | −1222 | −611 |
| BeO | −608 | −608 |
| MgO | −601 | −601 |
| Li2O | −599 | −599 |
| SrO | −592 | −592 |
| Al2O3 | −1676 | −559 |
| ZrO2 | −1097 | −549 |
| BaO | −548 | −548 |
| UO2 | −1084 | −542 |
| CeO2 | −1084 | −542 |
| TiO2 | −945 | −473 |
| SiO2 | −903 | −452 |
| B2O3 | −1272 | −424 |
| Cr2O3 | −1135 | −378 |
| V2O5 | −1490 | −298 |
| Fe2O3 | −826 | −275 |
| WO3 | −789 | −263 |
| CuO | −156 | −156 |

![]() (9.5)
(9.5)
A list of oxides in these terms is presented as Table 9.6. Following the logic described, one obtains an exothermic system by choosing a metal whose oxide has a  per O atom high on the list to react with a metal oxide that is lower on the list. Indeed, the application of this conceptual approach appears to explain why in the oxidation of lithium–aluminum alloys, the dominant product is Li2O and that Al does not burn in the vapor phase [9].
The reaction sequence (9.4) must be ignited by an external heat source, even though the reaction is quite exothermic. The reason is that metals such as aluminum have a protective thin (∼35 Å) oxide coat. Until this coat is destroyed by another thermal source, the thermite reaction cannot proceed. Once the protective oxide is broken, reaction is initiated, and the energy release from the initial reaction phase is sufficient to ignite the next layer of reaction, and so forth. The thermal wave established in these solid-phase reactions propagates in much the same way that a premixed gaseous flame propagates. Although some metals that react are not protected by oxide coats, ignition energy is necessary to initiate the reaction for the intermetallics.
For practical applications, one must calculate the temperature of the reaction in order to establish whether this temperature is so high that it will melt the metal that forms. Such melting causes metal flow that will prevent further reaction and hence propagation of the thermal wave. The actual temperature can be controlled by adding some of the product oxide to the reaction mixture. Consequently, for the system depicted as reaction (9.4), the initial reactants would be Fe2O3, Al, and A12O3. Sometimes, the production of very high temperatures works to advantage. If the temperature of an SHS process is high enough to vaporize the metal formed, the reaction proceeds well. This type of reaction permits the titanium–sodium azide reaction to proceed to completion. The SHS technique found application in the system used to seed the van Allen belts during the 1968 International Geophysical Year. In this instance, the SHS system chosen was the reaction of barium with copper oxide with an excess of barium. Thus the products were barium oxide, copper, and barium. The temperature of the reaction was sufficient to ionize the barium in the product. Of course, Table 9.6 reveals that such a reaction will proceed.
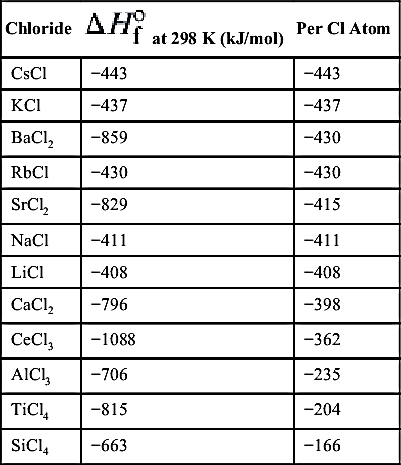
It is not necessary that one of the reactants be an oxide; it may, for example, be a chloride. Thus Table 9.7 represents a similar table to that for the oxides. The same logic for the choice of reacting systems prevails here [17]. Since the metal halides are readily vaporized, halogen exchange reactions can be used to liberate free metal atoms through gas-phase reactions, as opposed to the mostly heterogeneous “thermite-type” oxide reactions just discussed. In some early work by Olson et al. [18], a technique was developed for the production of solar-grade silicon based on this type of chemistry. These investigators examined the reaction between silicon tetrachloride and sodium vapor under conditions such that
![]() (9.6)
(9.6)
where (v) specifies vapor and (l) specifies liquid. The silicon liquid product comes from the nucleation of silicon atoms. Another SHS process is a modification of this halogen reaction to produce nitrides and other refractory and cermet powders. The simple addition of gaseous nitrogen to reactants similar to those above permits further reaction of the very reactive nascent metal atoms with the nitrogen to form the nitride. Table 9.8 gives the nitride information comparable to that in Table 9.7 for chlorides.
From this information, one again observes that the metals that form useful metal nitrides have nitrides with large negative heats of formation and chlorides with relatively small negative heats of formation. Thermodynamically, because the heat of formation of nitrogen is zero, the titanium–nitrogen reaction must proceed, as has been found experimentally [19,20]. Note that the opposite is true for the alkali metals, which have small nitride negative heats of formation and large chloride negative heats of formation. These comparisons suggest a unique method of forming nitrides via gas-phase reactions. For example, the reaction of an alkali–metal vapor, say sodium, with titanium tetrachloride, silicon tetrachloride, or aluminum trichloride vapor in the presence of nitrogen should produce titanium nitride, silicon nitride, or aluminum nitride according to the following overall reaction:
![]() (9.7)
(9.7)

Mixed chlorides can also be used to produce intermetallics:
![]() (9.8)
(9.8)
where the M represents various metal species.
Thermodynamic calculations of the equilibrium product distribution from these alkali–vapor reactions reveal very poor yields with a large amount of sodium impurity owing to the very high flame temperatures involved and a correspondingly high degree of dissociation. Because of the very large latent heat of vaporization of sodium, the calculated results for liquid sodium were extremely promising, with conversion of metal to nitride in all three cases.
..................Content has been hidden....................
You can't read the all page of ebook, please click here login for view all page.