
As we've mentioned throughout these chapters and projects, the success of your VR app will be negatively impacted by any discomfort your users feel. It is a fact that VR can cause motion sickness. The symptoms of motion sickness include nausea, sweating, headaches, and even vomiting. It can take hours – perhaps an overnight sleep – to recover. In real life, humans are susceptible to motion sickness: riding a roller coaster, a bumpy airplane, a rocking boat. It's caused when one part of your balance-sensing system thinks your body is moving but other parts don't.
In VR, this could occur when the eyes see motion but your body doesn't sense it. We've considered ways you can design your VR apps to avoid this. With locomotion, always give the user control over their first-person movement. Try to avoid riding-the-rails experiences and especially avoid free-falling. Display a horizon line or dashboard in the foreground so that the player at least feels like they're grounded in a cockpit if not on solid ground.
The opposite is also true: when your body feels motion but your eyes don't see it, this can also cause motion sickness. Even a very subtle discord can have a bad effect. In VR, a major culprit of this is motion-to-pixel latency. For example, if you move your head but the view you see doesn't keep up with the movement, that can cause nausea. Causes of latency in VR are often because your application has too much to compute during each frame, so rendering a frame takes longer than it should, slowing down the frame rate the user experiences. This chapter addresses ways to optimize your application to improve performance, reduce the computation per frame, reduce latency, and give your users a more comfortable experience.
Although this chapter is at the end of this book, we do not mean to suggest that performance issues be left for the end of your project's implementation. The old software development adage "first get it to work, then get it to work faster" doesn't necessarily apply to VR development. You need to pay attention to performance and comfort throughout your development process, which we will address as the main topics in this chapter, including using the Unity Profiler window, optimizing your 3D models, using Static objects in the scene, and using best practices for optimizing your C# code. This chapter will cover the following topics:
- Using the Unity Profiler tools
- Optimizing your artwork and 3D models
- Optimizing your scene and rendering options
- Optimizing your code
- Runtime performance analysis
By the end of this chapter, you will be able to use Unity's Profiler tools to analyze and diagnose performance issues, flag static objects, and provide other performance optimizations. We will start with a quick introduction to the Profiler and Stats windows.
Technical requirements
To implement the projects and exercises in this chapter, you will need the following:
- A PC or Mac with Unity 2019.4 LTS or later, the XR plugin for your device, and the XR Interaction Toolkit installed
- A VR headset supported by the Unity XR platform
You can access or clone the GitHub repository for this book (https://github.com/PacktPublishing/Unity-2020-Virtual-Reality-Projects-3rd-Edition-) to optionally use the following assets and completed projects for this chapter:
- The asset files for you to use in this chapter are located in UVRP3Files/Chapter-13-Files.zip.
- All the completed projects for this book can be found in a single Unity project atUVRP3Projects.
- The completed assets and scenes for this chapter can be found in the UVRP3Projects/Assets/_UVRP3Assets/Chapter13/folder.
Using the Unity Profiler and Stats windows
Optimizing can be a lot of work, and there is a learning curve to get the hang of it. The good news is that it can be accomplished incrementally. Tackle the more obvious, bigger bang-for-their-buck things first. You can accomplish a lot with little or no visual degradation after a bit of experimentation. The UnityEditorincludes two built-in tools that can be used to assess performance: theStatswindow and theProfilerwindow, both of which I will introduce in this section.
The Stats window
The Stats window shows real-time rendering statistics when you press Play in the Unity Editor. Reviewing and understanding these statistics is your first line of call when it comes to evaluating and improving the performance of your app, and it can help you decide which optimization strategies, including those covered in this chapter, to tackle first. In theGamewindow, enableStats by pressing the Stats button. The output of doing this can be seen in the following screenshot:

The actual statistics displayed will vary, depending on your current build target (seehttp://docs.unity3d.com/Manual/RenderingStatistics.html), including the following:
- Graphics frames per second (FPS) and time per frame
- CPU time per frame
- Tris (triangles) and Verts (vertices) geometry to be rendered in the frame
- Batches of graphic data efficiently grouped together for the GPU
In VR, you want to pay close attention to the frames per second. The minimum acceptable rate varies, depending on your target device, but generally, for desktop devices, you should aim as high as 120 FPS, while 60 FPS (or 75 FPS) is considered an absolute minimum. The Sony PlayStation VR accepts 60 FPS but uses hardware to automatically double the rate to 120 FPS to compensate. Windows Mixed Reality HMD will throttle the frame rate between 90 and 60, depending on the graphics processor hardware on your computer, allowing laptops with slower mobile GPU to run VR. The Oculus Quest mobile VR device's target is 72 FPS.
Examining the CPU time per frame and comparing that with the overall graphics time per frame will tell you whether your app is CPU-bound or GPU-bound; that is, which process is the bottleneck slowing you down the most. The CPU is used for physics calculations, geometry culling, and other operations that prepare the data for rendering in the GPU. On the other hand, the GPU runs the shaders and actually generates the pixel values for display. Knowing if you're CPU- or GPU-bound can help direct your focus for what optimization efforts are required to improve your game's performance.
The Tris and Verts values show the size of your geometric models' meshes that are drawn. Only the visible faces of your meshes are counted, so your scene could include much more. The values in Stats are the geometry the camera is looking at, not including any vertices outside the view, and after any occluded surfaces and back faces have been removed. This culling is performed by the CPU. As you move the camera or as objects in the scene animate, the numbers will change. As we'll see in the next section, reducing the poly count of your models can lead to significant gains in performance.
The Batches value is an indicator of how hard your GPU is working. The more batches, the more rendering the GPU must perform each frame. The number of batches, not the size of a batch, is the bottleneck. You can reduce batches by reducing and/or combining the geometry in your scene. Since it's faster to have fewer (albeit larger) batches than lots of small ones, you can tell Unity to optimize the graphics by combining more geometry into larger batches and pump that through the GPU pipeline.
Next, we'll take a look at the Profiler window.
Overview of the Profiler window
The UnityProfiler window is a performance instrumentation tool that reports how much processing time is spent in various areas of your game, including rendering and scripts. It records the statistics during gameplay and shows them in a timeline graph. Clicking various parts lets you drill down into the details. The Profiler can be seen in the following screenshot (seehttp://docs.unity3d.com/Manual/Profiler.html):

The Profiler compacts a lot of information into a small space, so you should recognize its various parts to understand what you're seeing. On the left (A) are the Profiler modules, that is, the list of areas that you can monitor through the Profiler. Along the top of the window is the Profiler controls toolbar (B), which enables you to record profiling data as your application runs and navigate through profiled frames. The white vertical line in the profile tracks is the playhead, indicating the current frame being examined. Underneath the toolbar are the profile tracks (C). Scroll down the Tracks pane to reveal more. You can add and remove tracks using the Add Profiler select list.
Each track includes stats for many parameters pertaining to that category of processing. For example, CPU Usage includes Scripts and Physics, while Rendering includes Batches and Triangles. The visual graph helps you easily detect anomalies. When troubleshooting, look for stretches and spikes where the data exceeds your expected thresholds. The bottom panel (D) shows details for the current frame and selected module that can really help you drill down into your scene to determine what processes are working and when.
When you discover a situation that requires deeper analysis, you can enable the Deep Profile button at top of the window. Deep Profile lets you drill down into more detail, recording all the function calls in your scripts. This can be useful if you wish to see exactly where time is spent in your code or other systems. Note that deep profiling only works in the Editor rather than remote profiling the build running on your target device, and it incurs a lot of overheads that may cause your game to run very slowly. So, in general, you'd run the Profiler without Deep Profile, and only when you find a trouble spot would you enable Deep Profile to try and discover the root cause.
As a complement to the Profiler, there is also a new Profile Analyzer tool (presently in preview mode) that helps you conduct a multi-frame analysis of your profile data by aggregating and visualizing frame data from the Profiler. Use Package Manager to install the Profile Analyzer tool (see https://docs.unity3d.com/Manual/com.unity.performance.profile-analyzer.html).
Now that you have the stats and profiler tools at your disposal, you can begin analyzing and diagnosing performance issues in your project.
Analyzing and diagnosing performance problems
The first line of attack in evaluating performance problems is to determine whether the bottleneck is on the CPU or the GPU. When your app is CPU-bound, the CPU (general central processor) is taking too long to execute its tasks. When your app is GPU-bound, the GPU (graphics processor) is taking too long to execute its tasks. Therefore, you need to be familiar with not just how your application is implemented but also how Unity carries out its work.
The Unity engine play loop (for example, calls to Update and FixedUpdate) is performed by the CPU. Likewise, any C# code that you write is run on the CPU. If your app is CPU-bound, you should first determine whether the cause is in components you have written versus how you're using Unity's built-in ones. Physics calculations and animations are performed by the CPU. The CPU is also used in the rendering pipeline to select which objects are candidates to be rendered in the current frame, and then prepares the geometry and texture data and feeds them to the GPU as vertices, triangles, normals, and other attributes, including the shader parameters. The more complex and detailed your geometry, the more work that happens on the CPU.
The GPU renders the geometry into pixels for display on the screen, re-rendering the screen every frame update. GPUs are very good at parallel processing so that they can calculate the value of multiple pixels concurrently from the same input data that was fed from the CPU. The code that runs on the GPU is called a shader. We've been selecting and using various shaders throughout this book in our materials and setting some of their properties (and ignoring other properties). Unity compiles your shaders into multiple efficient shader variants based on the properties being utilized.
But in practice, the line is not always so clearly drawn between CPU and GPU responsibilities. For example, Unity will normally organize meshes on the CPU, but you could be using a geometry shader on the GPU. Unity will build batches on the CPU or use instancing on the GPU. You can perform calculations on the CPU or in a compute shader on the GPU. Once you've identified whether the performance bottleneck in your project is within the CPU or GPU, you can use the Profiler to try and see what specific processes are consuming the most time. The basic workflow is as follows:
- Use the Profiler on your project, looking for general areas of poor performance and/or latency spikes.
- Enable Deep Profile and examine sample frames to determine, or at least form a hypothesis for what's causing the issue.
- Make a change to your project.
- Repeat the preceding steps, profiling the effect of that change.
When it comes to diagnosing problems, sometimes the third step, Make a change to your project, is not necessarily an attempt to fix the problem – it could be there to give more insight into what is going on. For example, if you guess that a particular Update call in one of your components is the root cause of the problem, you might temporarily disable that component or comment out a few lines of code to see whether that produces an improvement. If so, then you can figure out an alternative, more efficient way to implement that same feature.
Now that you are familiar with the Stats and Profile tools, you can begin to analyze and diagnose performance issues in your project. Causes of performance problems can be attributed to the geometry of your game object's artwork, scene illumination, C# code, and GPU rendering. We'll consider each of these in turn in the following sections.
Optimizing your art
The one thing that you have the most control over in your project is the content of your scenes. And sometimes, it's these very same intentionally creative decisions that have the greatest negative impacts on performance. Maybe you want hyper-realistic graphics with high-fidelity sound because its gotta be so awesome! Realizing you must dial that down may constitute a difficult design compromise. However, it's also likely that, with a little creative thinking and experimentation, you can achieve (nearly) identical visual results with much better performance.
In general, try to minimize the number of vertices and faces in your model's meshes. Avoid complex meshes. Remove faces that will never be seen, such as the ones inside of solid objects. Clean up duplicate vertices and remove doubles. This will most likely be done in the same 3D modeling application you used to create them in the first place. For example, Blender has built-in tools for this. Also, there are third-party tools that you can purchase to simplify model meshes.
In order to demonstrate these ideas, let's set up a scene with a high polygon count model, replicate that model 1,000 times, examine it in the Profiler, and try some optimization techniques. To begin with, we'll need a high-poly model. It's not unusual for 3D artists to produce models with a ridiculously high number of polygons that are virtually unusable in a game engine such as Unity. I recently found a model on Sketchfab that will do fine for our demonstration – a 3D version of the NPC meme man (see https://knowyourmeme.com/memes/npc-wojak) created by TANMATE. You can download a copy of this OBJ file from Sketchfab (https://sketchfab.com/3d-models/meme-manmr-succspecial-meme-fresh-head-3d1f49bc7e6e446fb0d97e98cd40e749) under the Creative Commons license, and a copy is included on the GitHub repository for this book, along with the modified versions of the model that will be used in this tutorial.
My local file is named mememan-original.obj. The original model has over 500,000 triangles and is over 37 MB in size. Let's suppose you didn't notice or mind this size and used the file as-is in your Unity project. In Unity, create a new scene with the mememan-orginal model, as follows:
- Create a new scene (File|New Scene) and then save it (File|Save As) with the nameOptimization.
- Select GameObject | XR | Stationary XR Rig.
- Create a ground plane using GameObject |3D Object|Plane called Ground Plane, reset itsTransform, and create a material with a neutralBasecolor such as #908070.
- Open the Lighting window using Window | Rendering | Lighting, select its Scene tab, click New Lighting Settings (Unity 2020+), and check the Auto Generate checkbox for lightmaps.
Now, add a copy of the Mememan, normalize its size, and save it as a prefab:
- Create an empty game object using GameObject | Create Empty, name it Mememan, and Position it at (0, 1, 1).
- Drag a copy of mememan-original into the scene as a child of the Mememan object we just created.
- Set itsScale(0.35, 0.35, 0.35) and Rotation (0, -135, 0) so that it fits inside a single one-unit cube and is facing the camera.
- Make it a prefab by dragging the root Mememan object into your ProjectAssets/Prefabs/ folder.
Let's look at its Stats and Profile information and make a note of some values:
- In theGamewindow, pressStats to open the Stats window.
- Also, open the Profiler window using Window | Analysis | Profiler.
- PressPlay.
TheGamewindow has the following scene and Stats window that shows, on my hardware, the graphics hovering around 160 FPS, CPU main 6 ms, with 11 batches:

The corresponding Profiler window is shown in the following screenshot:

This scene is too simple for us to gather much in the way of meaningful statistics. Let's create 1,000 copies of the Mememan in the scene by following these steps:
- Create anEmptygame object and name itObject Replicator.
- Create a new C# script on it called ObjectReplicator and write it as follows:
public class ObjectReplicator : MonoBehaviour
{
    public GameObject prefab;
    public Vector3Int dup = new Vector3Int(10, 10, 10);
    public Vector3 delta = new Vector3(1.2f, 1.2f, 1.2f);

    void Start()
    {
        Vector3 position = transform.position;
        for (int ix = 0; ix < dup.x; ix++)
        {
            for (int iy = 0; iy < dup.y; iy++)
            {
                for (int iz = 0; iz < dup.z; iz++)
                {
                    position.x = transform.position.x + ix
                         * delta.x;
                    position.y = transform.position.y + iy
                         * delta.y;
                    position.z = transform.position.z + iz
                         * delta.z;
                    GameObject go = Instantiate(prefab, transform);
                    go.transform.position = position;
                }
            }
        }
    }
}
This script takes aprefabobject and instantiates it dupnumber of times (10) in each of the X, Y, and Z axes, offsetting each bydeltaunits (set to 1.2), thereby generating a total of 1,000 instances of the prefab. Save the script. Then, back in Unity, set up and assign the replicator parameters, as follows:
- Select Object ReplicatorinHierarchyagain and drag theMememan prefab from theProjectAssets/Prefabs folder to itsPrefabslot.
- Set theObject ReplicatorPositionto (-5, 0, 1) as the origin of our stack of objects.
- Save the scene and the project (File | Save, and File | Save Project) as this may crash your system!
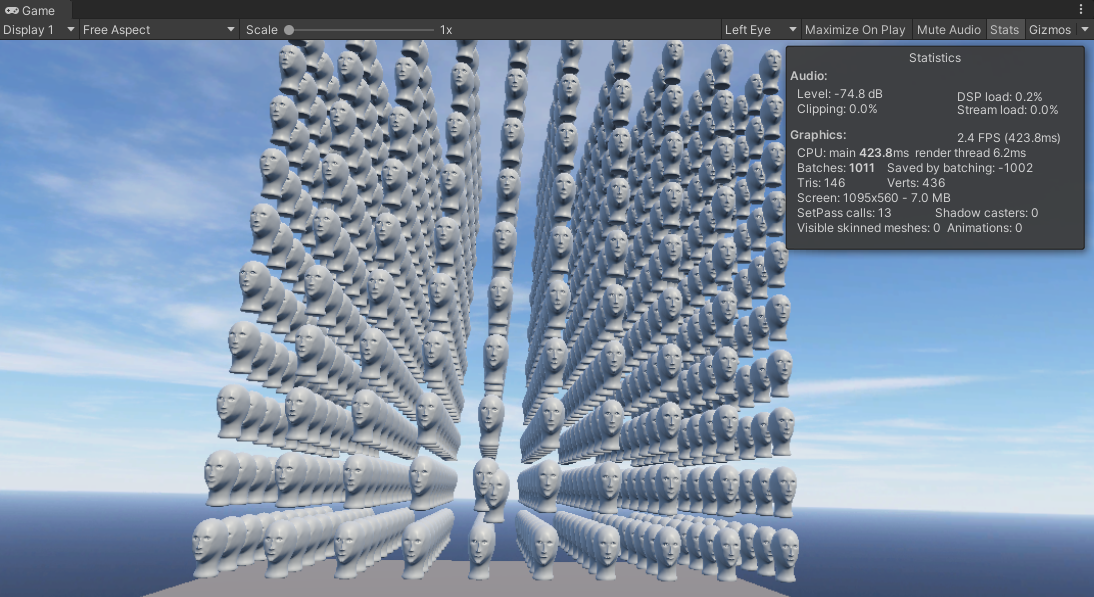
PressPlay. The generated scene in theGame window is shown in the following screenshot (with the camera rig pulled back so that the whole thing is within view). You can see that our frame rate has dropped to a dramatically slow 2 or 3 FPS and that Graphics went to 1,011 Batches:
Now that we have a poorly performing scene, let's see what we can do about it. First, we will try to reduce the polys by decimating the model and then further reduce the polys by dynamically choosing the level of detail based on their distance from the camera.
Decimating models
One thing we can do is try to simplify the 3D modelsbefore we import them into Unity. If you select themememan-originalobject in yourProject window's Assets/ folder, you will see that it consists of a mesh named default with 515365 triangles, as shown in the following screenshot:

We should reduce the number of faces on the mesh, or decimatethe model. I have used the separate (free and open source) Blender application (https://www.blender.org/) to produce a set of modified models. The following screenshot of the Blender editor shows where to find the Decimate modifier tool (https://docs.blender.org/manual/en/latest/modeling/modifiers/generate/decimate.html). It is set to 0.1Ratio, thus reducing the number of triangles (tris) from 500,000 to 50,000. This is only for your reference, should you want to try it yourself:

I decimated the model from 500,000 triangles to 50,000, 5,000, 2,500, 1,000, and 500 triangles, and saved them into separate FBX files in this project. The results are shown in the following composite image. Reading the image clockwise from the top right, you can see that the density of the mesh reduced with the number of triangles (and corresponding file size):

Depending on your requirements, preferences, and the size of the object in the camera view, you might find an acceptable version in the smaller models. (Of course, automated tools can only take you so far – manual editing and refinement may still be required; for example, the rim of the face and shape of the lips in this example have lost a lot of definition and may need work). Personally, I like the 2,500 version – it's relatively small and still works. Let's use that in our scene. Its filename is mememan-2.5k.fbx. Let's create and use a new prefab for this version of the model by copying the Mememan prefab and replacing its model using the following steps:
- In the Project window's Assets/Prefabs/ folder, select the Mememan prefab and select Edit | Duplicate from the main menu.
- Rename the copy Mememan-decimated.
- Double-click Mememan-decimated to open it for editing.
- Drag the mememan-2.5k model from the ProjectAssets/Models/ window into Hierarchy.
- Copy/paste or set the transform we used to normalize the model earlier (Rotation Y: -135, Scale: 0.35).
- Delete the mememan-original object in the prefab Hierarchy.
- Save the prefab and exit to the scene Hierarchy.
- Select the Object Replicator object in the scene Hierarchy.
- Drag the Mememan-decimated prefab from the ProjectAssets/Prefabs/ window to the Object Replicator | Prefab slot.
- Save the scene using File | Save.
Press Play. Much better! As shown here, it's now running faster at about 50 FPS. There's still room for improvement, but this is much better:

This example does not consider another important characteristic of 3D modeling and art – the texture maps and materials used with the objects, as we've seen in other project chapters of this book, including Chapter 8, Lighting, Rendering, Realism. Material properties and shaders work as a fantastic substitute for geometric mesh details. With careful application of Physically-Based Rendering (PBR) materials composed of textures maps for base texture, surface normal, occlusion, metallic, and other surface properties, you can get fantastic results in terms of performance, file size, and rendering flexibility – better than you can hope to achieve with overly dense model meshes.
It may occur to you that we could get away with a lower detail model when the object is further away from the camera and vice versa with the higher detail version when closing up. Let's take a look at this now.
Levels of detail
Reviewing the scene, you may realize that a higher poly object may only be needed when you're near it. As the object recedes further into the distance, a lower poly version does just fine. Unity understands this and provides a component to automatically manage levels of detail, called LOD Group (see https://docs.unity3d.com/Manual/LevelOfDetail.html). Let's use this now. We'll create a group of Mememans with each of the detail level versions. Follow these steps:
- In Hierarchy, create an Empty game object, name it MememanLOD, and reset its Transform.
- Drag a copy of the mememan-2.5k model as a child of MememanLOD.
- Drag a copy of the mememan-1k model as another child.
- Finally, drag a copy of the mememan-500 model as yet another child.
- Set the Transform details we used to normalize the model earlier (Rotation Y: -135, Scale: 0.35) for all three models.
- Select the parent MememanLOD object and select Add Component | LOD Group.
Look at the LOD Group component in Inspector. Notice that it has several ranges for when to use one model or another based on camera distance, labeled LOD0, LOD1, and LOD2. The range is a percentage of the object's bounding box height relative to the screen height. When closest, the LOD0 objects are active. Further away, those will be deactivated and the LOD1 ones will be active, and so on. Let's assign the LOD groups now:
- Select LOD0.
- Drag the mememan-2.5k game object from Hierarchy onto the Add button.
- Select LOD1.
- Drag the mememan-1k game object onto the Add button.
- Select LOD2.
- Drag the mememan-500 object onto Add as well.
The following is a screenshot of LOD Group in the Inspector window:

Notice that there is a little camera icon on the top edge of the LOD group graphic. You can select and slide it across to preview the LOD activations based on camera distance. You can also configure the active range of each LOD (percentage) by sliding the edge of each area box. The Scene view and Hierarchy we created can be seen in the following screenshot, with the camera at a distance that activates the LOD 1 graphics:

Now, let's try it in our scene:
- Save it as a prefab by dragging the MememanLOD object to your Project Prefabs folder.
- Select the Object Replicator game object in Hierarchy and drag the MememanLOD prefab to its Prefab slot.
Press Play. The scene looks essentially the same in VR but we have now achieved our target, rendering at 120 FPS or higher. The ones closest to us are the 2.5K tri heads, the middle contains the 1K ones, and the models furthest away contains the low poly 500-tri version of the model, as shown in the following screenshot:

The Profiler timeline, as shown in the following screenshot, is busy but maintains an acceptable frame rate:

In this section, we have seen how high-poly models can have a significant detrimental effect on the performance of our app. Simplifying your models before they're even imported into Unity is a good first step, but you may need to work with your 3D artist to keep the integrity and quality you require, as well as the application of the material's texture and shader properties. Then, you can get greater control of the models instantiated in the scene using LOD groups to choose the level of detail based on the object's distance from the player and camera.
In addition to your art objects, the next step in terms of optimization might be how your scene itself is organized, including tagging game objects as Static.
Optimizing your scene with static objects
Another way of optimizing your scene is to let Unity pre-compute a lot of the processing work in advance rather than at runtime. You can do this by informing Unity that specific objects will not change or move in the scene. This is accomplished by defining these game objects as static and then baking them into specific Unity system contexts, including lighting, occlusion, batching, navigation, and reflection probes. In the top-right of the Inspector window for each game object is a Static checkbox that can be used to set the object to Static for all Unity systems that can use it. Alternatively, you can choose the down arrow to select the static setting for individual systems, as shown in the following screenshot:

Ordinarily, if you're going to make an object Static, go ahead and check Everything, unless you know you need to refine it. The specific Static flags are as follows:
- Contribute GI: Use this object when precomputing lighting data, general illumination, lightmaps, and shadows (see the Window | Lighting | Lightingwindow). We used this in the art gallery scene inChapter 10, Exploring Interactive Spaces.
- Occluder / Occludee: Use this object when precomputingocclusion culling, which divides the scene into static volumes that can be quickly removed when out of view, saving processing by possibly eliminating many objects from consideration at once. We'll try using this next.
- Batching: Include this object when batching draw calls to the GPU (see https://docs.unity3d.com/Manual/DrawCallBatching.html).
- NavigationandOff Mesh Link: Use these objects when generating aNavmeshfor AI characters. (We used this in Chapter 4, UsingGazed-Based Control, when we baked a Navmesh for Ethan's walkable areas in the scene.)
- Reflection Probe: Use this object whenprecomputing Reflection Probes whoseTypeis set toBaked(SeeChapter 8, Lighting, Rendering, and Realism).
Let's try out some examples by setting up the scene, baking the lighting, and then adding occlusion culling.
Setting up the scene
To demonstrate the use of static game objects, we cannot use the dynamically instantiated Mememan GameObjects generated by the ObjectReplicator script at runtime because, by definition, a Static GameObject must be present and unchanging in the Unity Editor and built into the app, not instantiated at runtime. But given we have this script, we'll use it to our advantage by playing the scene to generate the 1,000 objects, then copy/paste them into the Hierarchy window that we save with the scene. Follow these steps:
- In Hierarchy, select Object Replicator and drag the Mememan-decimated prefab from Project Assets onto its Prefab slot.
- Press Play. Note that Object Replicator now has 1,000 children game objects named Mememan-decimated(Clone).
- While playing, in the Hierarchy window, right-click the Mememan-decimated object and select Copy.
- Stop Play mode.
- From the main menu, select Edit | Paste, which inserts a copy of Object Replicator and all 1,000 of its children into the Hierarchy window.
- Rename it Mememan Borg.
- In Inspector, remove the Object Replicator component of Mememan Borg by right-clicking| Remove Component.
- In Hierarchy, select the Object Replicator GameObject and deactivate it by unchecking its checkbox at the top-left of Inspector, as we no longer want to use it.
Now, we have all the instantiated models in the Hierarchy window, as shown in the following screenshot:

A problem with this technique is that all the Mememan children are now unpacked; that is, they've lost their association with the original prefab asset. To avoid this, you could write the version of the replicator script as an Editor Script to achieve a similar result and preserve the prefab link. Editor scripts extend the features of the Unity Editor and are not compiled into your final built application. For example, it could add a BorgMaker menu item to the Editor menu that may prompt you with a dialog box asking for the prefab object, duplication counts, and offset parameters, much like our Object Replicator. Writing scripts that customize and extend the Unity Editor is common practice. If you're interested, see Manual: Extending the Editor (https://docs.unity3d.com/Manual/ExtendingTheEditor.html) and the Editor Scripting Intro tutorial (https://unity3d.com/learn/tutorials/topics/scripting/editor-scripting-intro).
Next, we'll bake the scene lighting by making these objects Static.
Lighting and baking
The use of lights in your scene affects the frame rate. You have a great deal of control over the number of lights, types of lights, their placement, and their settings. Use baked lightmaps whenever possible, which precalculates the lighting effects into separate images rather than at runtime. Use real-time shadows sparingly. When an object casts shadows, a shadow map is generated, which will be used to render the other objects that might receive shadows. Shadows have a high rendering overhead and generally require high-end GPU hardware. Let's see the impact of using baked lightmaps on our scene:
- SelectMememan Borg and click itsStaticcheckbox in the upper-right corner ofInspector.
- When prompted, answer Yes, change children.
Depending on your Lighting settings, the lightmaps may begin generating right away. Review and modify the lightmap settings, as follows:
- Open the Lighting window by selecting Window | Rendering | Lighting.
- With Auto Generate checked, it will start generating lightmaps any time your scene changes.
- Alternatively, uncheck it and click Generate Lighting to build them manually.
It can take several minutes or more to generate the lightmaps in a complex scene. The following screenshot shows one of the baked lightmaps in the Lighting window's Baked Lightmaps tab, along with a Preview of the lightmap texture for its Baked Directionality:

Here are some more tips when dealing with lighting and performance:
- Avoid dynamic shadows altogether, especially on mobile devices. You can substitute by using a "blurry blob" underneath moving things.
- Check your project's Quality Settings (Edit | Project Settings | Quality). Use fewerPixel Lights(on a mobile, limit them to 1 or 2). UseHigh ResolutiononHard and Soft Shadows.
- You can have as many baked lights as you want. Baked lighting produces high-quality results, whereas real-time shadows can appear blocky.
- When baking, you can improve lightmap quality by increasing the baked resolution (a 40-100 pixel resolution is reasonable).
- Use light probes with baked lighting to illuminate dynamic objects.
- Use reflection probes for reflective surfaces. These can be static (baked) or dynamic (real-time).
Light probes (either real-time or baked) and the shaders you use (and the shader options) can make your scene look really amazing. However, they can also have a significant effect on performance. Balancing aesthetics and graphics performance is an art and a science.
Next, we'll take a look at flagging game objects as static for occlusion culling.
Occlusion culling
As we've seen, the less geometry that's rendered each frame, the better. Whether or not you are using high- or low-poly models, Unity still needs to figure out which faces are in view. This process is split into viewport clipping and occlusion culling. Clipping occurs on objects completely outside of the camera view. Unity includes built-in occlusion culling on the CPU when determining what data to send on to the GPU for rendering. When there are a lot of overlapping objects, perhaps we could help Unity out by giving it some clues.
Occlusion culling disables the rendering of objects altogether when they are not seen by the camera because they are obscured (occluded) by other objects (seehttp://docs.unity3d.com/Manual/OcclusionCulling.html for more details). It examines your scene and, using the bounding boxes (extents) of each object, divides the world space into a hierarchy of cubes. When Unity needs to determine if an object is within view, it will throw away any objects whose culling box is obviously outside of the view and continue through the hierarchy.
To demonstrate this, we'll bake Occlusion Culling of our 1,000 object called Mememan Borg. Assuming all the GameObjects are marked as Static (including the Occluder and Occludee flags), you can generate it with the following steps:
- Open the Occlusion Culling window using Window | Rendering | Occlusion Culling.
- Click Bake (at the bottom right of the window).
This may take a while. The following screenshot shows a visualization image in the Scene window showing Camera Volumes (white) and Visibility Lines (green). Only a portion of the 1,000 objects remains in the scene after the ones outside the camera's view have been culled. Due to this, less data needs to be processed in the frame:

Unity's built-in occlusion culling is automatically performed at runtime and calculated on the CPU. Precomputed baked occlusion culling is most beneficial when your app is GPU-bound due to overdraw where the same pixels are rendered more than once in a frame. According to the Unity manual, "Occlusion culling works best in scenes where small, well-defined areas are clearly separated from one another by solid GameObjects. A common example is rooms connected by corridors."
Occlusion can be further controlled with the use of Occlusion Area components and Occlusion Portal components. An Occlusion Area defines a view volume or area of the scene where the camera is likely to be at runtime. When the occlusion data is baked, Unity generates the data at a higher precision within View Volumes. An Occlusion Portal lets you control occlusion at runtime, which is useful for objects that can be open or closed, such as a door.
In this section, we have learned how to improve performance and help Unity by reducing the number of runtime calculations with precomputed, or baked, information, including lightmaps and occlusions. This is achieved by flagging specific GameObjects in the scene as Static and then baking the specific system that we want. This is a strategic optimization consideration and very much depends on our particular project, scene, objects, and behaviors in play.
The next line of attack regarding performance is taking a closer look at the rendering pipeline.
Optimizing the rendering pipeline
There are a number of important performance considerations that are specific to how Unity does its rendering. Some of these may be common for any graphics engine. Recommendations will vary, depending on your target platform (for example, desktop VR versus mobile VR), your render pipeline (for example, Universal Render Pipeline versus High-Definition Render Pipeline), and Project Quality settings. There are many articles on the internet offering recommendations on which settings to use to optimize your VR apps, and it's not unusual for someone's advice to contradict that of someone else. Here are some good ones:
- In GraphicsProject Settings, select the render pipeline (RP) settings object for the project. This may have been set up by default when you chose a Project Template from Unity Hub when the project was first created.
- In your chosen RP settings object (for example, UniversalRP-HighQuality versus UniversalRP-LowQuality), set Anti Aliasing (MSAA) to 2x or 4x (multi-sampling anti-aliasing). This is a low-cost, anti-aliasing technique that helps remove jagged edges and shimmering effects.
- In the RP settings object's Renderer, useForwardRenderer. This is the default for the Universal Render Pipeline (URP).
- In QualityProject Settings, disable the use of Realtime Reflection Probes.
- In XR Plugin Project Settings, use Single Pass Stereo Rendering. It performs efficient rendering of a parallax perspective for each eye in a single pass.
- In Player Settings, enable Static Batching and Multithreaded Rendering.
This is a sample of the settings from across various settings windows in the Unity Editor, including Graphics settings (Edit | Project Settings | Graphics), Quality settings (Edit | Project Settings | Quality), XR Plugin settings (Edit | Project Settings | XR Plugin Management | Oculus, for example), and Player settings (Edit | Project Settings | Player | Other Settings). The render pipeline settings are stored in an asset file in your Project window and can be edited in that object's Inspector.
Perhaps the biggest bang-for-the-buck is a feature in Unity that groups different meshes into a single batch, which is then shoveled into the graphics hardware all at once. This is much faster than sending the meshes separately. Meshes are actually first compiled into an OpenGL vertex buffer object or VBO, but that's a low-level detail of the rendering pipeline. Each batch takes one draw call. Reducing the number of draw calls in a scene is more significant than the actual number of vertices or triangles in the batch. For mobile VR, for example, stay around 50 (up to 100) draw calls. There are two types of batching: static batching and dynamic batching.
For static batching, simply mark the objects as Static by checking off the Static checkbox in the UnityInspectorfor each object in the scene. Marking an object as Static tells Unity that it will never move, animate, or scale. Unity will automatically batch together the meshes that share the same material into a large. single mesh. The caveat here is that meshes must share the same Material settings: the same texture, shader, shader parameters, and the material pointer object. How can this be, since they're different objects? This can be done by combining multiple textures into a single macro-texture file or TextureAtlas and then UV mapping as many models as will fit. It's a lot like a sprite image used for 2D and web graphics. There are third-party tools that help you build these.
Dynamic batching is similar to static batching. For objects that are not marked as Static, when Dynamic Batching is enabled, Unity will still try to batch them, albeit it will be a slower process since it needs to think about it frame by frame (the CPU cost). The shared Material requirement still holds, as well as other restrictions such as vertex count (less than 300 vertices) and uniformTransform Scalerules. For more details and other caveats governing batching draw calls, please refer to the Unity documentation at http://docs.unity3d.com/Manual/DrawCallBatching.html. By default, Dynamic Batching is disabled in the URP settings.
Another concern in the rendering pipeline is sometimes referred to as the pixel fill rate. If you think about it, the ultimate goal of rendering is to set each pixel on the display device with a correct color value. If Unity has to paint any pixels more than once, that's more costly. For example, watch out for transparent particle effects, such as smoke, that touch many pixels with mostly transparent quads.
For VR, Unity paints into a frame buffer memory that is larger than the physical display dimensions, which is then post-processed for ocular distortion correction (barrel effect) and chromatic aberration correction (color separation), before getting tossed onto the HMD display. In fact, there may be multiple overlay buffers that get composited before post-processing.
This multipass pixel filling is how some advanced renderers work, including lighting and material effects such as multiple lights, dynamic shadows, and transparency. VBO batches with materials that require multipass pixel filling get submitted multiple times, thus increasing the net number of draw calls. Depending on your project, you may choose to either optimize the heck out of it and avoid multipass pixel filling altogether, or carefully curate the scenes with an understanding of what should have high performance and what should have high fidelity.
You can useLightProbesto inexpensively simulate the dynamic lighting of your dynamic objects. Light probes are baked cubemaps that store information about direct, indirect, and even emissive light at various points in your scene. As a dynamic object moves, it interpolates samples of the nearby light probes to approximate the lighting at that specific position. This is a cheap way of simulating realistic lighting on dynamic objects without using expensive real-time lights. We discussed light probes in Chapter 8, Lighting, Rendering, Realism.
In this section, we learned more about opportunities to tune the graphics and render pipeline in your project, if needed, to squeeze out extra performance. It's important to become familiar with the many parameters available to you in the Graphics, Quality, Render Pipeline, Player Settings, and XRPlugin settings. Visit the default settings in your project and, from time to time, experiment with the effects of changing one or two values at a time. In practice, Unity is getting better every day at automatically optimizing the render pipeline for you and provides well-balanced default sets of parameter values for high-, medium-, and low-quality graphics. But there's comfort in knowing that if (or when) you need to fine-tune it, the settings are available to you.
There's one other major area of concern that affects performance, especially when your project is CPU-bound: the C# code you have written.
Optimizing your code
Another area prone to performance problems and ripe for optimization is your C# script code. Throughout this book, we have used various coding best practices, without always explaining why. (On the other hand, some examples in this book are not necessarily efficient, in favor of simplicity and explanation). InChapter 9,Playing with Physics and Fire, for example, we implemented an object pool memory manager to avoid repeatedly instantiating and destroying game objects that cause memorygarbage collection(GC) issues, which, in turn, slows down your app.
In general, try to avoid code that repeats a lot of computation over and over. Try to pre-compute as much work as you can and store the partial results in variables. At some point, you may have to use a profiling tool to see how your code is performing under the hood. If the Profiler indicates that a large amount of time is spent in the scripts that you've written, you should consider another way to refactor the code so that it's more efficient. Often, this is related to memory management, but it could be math or physics. For tips from Unity, seehttp://docs.unity3d.com/Manual/MobileOptimizationPracticalScriptingOptimizations.html.
Let's take a closer look at the Unity play loop and life cycle of GameObjects and then consider some suggestions for writing efficient code.
Understanding the Unity life cycle
Like all video game engines, when your game runs, Unity is executing a giant loop, repeating each frame update over and over. Unity provides manyhooks to tap into events at just about every step in the game loop. The following is the life cycle flowchart, annotated from the Unity Manual page's Execution Order of Event Functions (https://docs.unity3d.com/Manual/ExecutionOrder.html). The two event functions you are most familiar with,StartandUpdate, are highlighted with large arrows. The dots highlight a number of other events we'll reference in this section:

Reading from the top of this chart, when your game starts, each GameObject's component (which is derived from the MonoBehaviourclass) will be initialized with a call toAwake. Then, OnEnable and then Start is called. Awake and Start are only called once in the life cycle of an object. OnEnable is called each time the GameObject is enabled, at the start, and also if deactivated and reactivated. Unless you need to useAwakeorOnEnable, we typically initialize objects inStart.
Skipping down to the Game logic section,Updateis called on each frame iteration. Note the loop line/arrows in the chart. (The physics engine has its own loop timing for dealing with RigidBody, which may be more frequent than the frame updates. You hook into that with FixedUpdate.)
TheOnDestroyevent is called to decommission the object.
For the current discussion, the important thing to notice is which events are within the game loop and which are outside. Now, let's look at ways to write efficient scripts.
Writing efficient code
We want to keep all of the code within the game loop (such as FixedUpdate, Update, and LateUpdate) as lean as possible. Move any initialization intoAwake,OnEnable, orStart. We also want to precompute and cache any computationally expensive work in the initialization functions.
For example, a call toGetComponent (and its variants) is expensive. As we've seen in many of the scripts in this book, it is a best practice to get references to any components that Update will need beforehand, outside the game logic loop, inStart. Likewise, finding the Camera.main reference can be slow. Consider the following example script, which detects a gaze-based hit by ray casting from the camera and displays the hit count in a text element on the screen:
    public class HitScore : MonoBehaviour
    {
        private int score = 0;

        void Update()
        {
            RaycastHit hit;
            Ray ray = new Ray(Camera.main.transform.position,
                              Camera.main.transform.rotation *
                                 Vector3.forward);
            if (Physics.Raycast(ray, out hit))
            {
                score++;
                GetComponentInChildren<Text>().text =
                    "Score: " + score;
            }
        }
    }
For each Update, perhaps 120 times per second, I'm calling GetComponentInChildren and calling Camera.main (twice!). In the following code, we have refactored the script to precompute any initialization into Start using private variables and making the Update function more efficient:
    public class HitScore : MonoBehaviour
    {
        private int score;
        private Transform camera;
        private Text scoreText;
        RaycastHit hit;

        void Start()
        {
            score = 0;
            camera = Camera.main.transform;
            scoreText = GetComponentInChildren<Text>();
        }

        void Update()
        {
            Ray ray = new Ray(camera.position,
                 camera.rotation * Vector3.forward);
            if (Physics.Raycast(ray, out hit))
            {
                score++;
                scoreText.text = "Score: " + score;
            }
        }
    }
Likewise, if you have code inUpdatethat does not need to be called every frame, turn off the calculations using a state variable (and anifstatement) when they are not needed, as follows:
    public bool isWalking;

    void Update()
    {
        if (isWalking)
        {
            character.SimpleMove(camera.transform.forward * 0.4f);
        }
    }
You can go even further than this. If you need to make regular updates but not as often as every frame, you can do this in a coroutine instead of Update. In the following code, for example, a DoSomething function is performed twice a second rather than at the game's normal frame rate. Note that I'm also precomputing the WaitForSeconds delay so that a new one is not reallocated every iteration:
    private WaitForSeconds delay;
    private Coroutine co;

    private void Start()
    {
        delay = new WaitForSeconds(0.5f);
    }

    private void OnEnable()
    {
        if (co == null)
            co = StartCoroutine(SlowUpdate());
    }

    IEnumerator SlowUpdate()
    {
        while (true)
        {
            DoSomething();
            yield return delay;
        }
        co = null;
    }
The coroutine is restarted in OnEnable rather than Start because if you deactivate a GameObject, any coroutines running in any of its components are automatically stopped. If you expect the SlowUpdate function to be running any time the object is active, you must restart the coroutine yourself. Also, for safety, I'm keeping a reference of the running coroutine (co) to make sure we don't accidentally have two instances of the SlowUpdate coroutine running at the same time for this specific object.
Other than moving expensive API calls out ofUpdate into an initialization function or a coroutine, there are some APIs that should be avoided altogether if possible. Here are a few:
- AvoidObject.Find("ObjectName"). To obtain a reference to a game object in your scene, do not callFind. Not only isFind (by name) expensive, as it must search the Hierarchy tree, it is brittle (might break) if you rename the object it is looking for. If you can, define apublicvariable to reference the object and associate it in the Editor Inspector. If you have to find the object at runtime, use Tags or perhaps Layers to limit the search to a known fixed set of candidates.
- AvoidSendMessage(). The legacy use ofSendMessageis computationally expensive (because it makes use of runtimereflection). To trigger functions in another object, use Unity Events instead.
- Avoid fragmenting memory and garbage collection. Temporary allocations of data and objects may cause memory to fragment. Unity will periodically go through the memory heap to consolidate free blocks, but this is expensive and can cause frames to skip in your app.
Another area of optimization is Unity Physics. In previous chapters, we mentioned using layers for ray casting in order to limit the objects Unity needs to search, for example, for gaze-based selection in VR. Likewise, physics collision detection can be limited to objects on specific layers by defining a Layer Collision Matrix. Refer to the manual page on Optimizing Physics Performance (https://docs.unity3d.com/Manual/iphone-Optimizing-Physics.html) and the Physics Best Practices tutorial (https://unity3d.com/learn/tutorials/topics/physics/physics-best-practices).
For more coding best practices and optimization suggestions, see the Unity best practices guide,Understanding Optimization in Unity(https://docs.unity3d.com/Manual/BestPracticeUnderstandingPerformanceInUnity.html). In this section, we learned about the Unity play loop and hooks in each GameObject life cycle. We then saw several techniques for optimizing our own code by reducing the amount of CPU processing in each frame Update.
As we mentioned earlier, the Profiler is very useful for determining where and what in our code may be causing our project to slow down. However, running the Profiler in the Unity Editor's Play mode has limitations, especially, for example, if you're targeting an Android device but obviously, Unity is running on your desktop. For that, you'll want a better picture of the runtime performance of the actual device.
Runtime performance and debugging
Graphics hardware architectures continue to evolve toward a performance that benefits rendering pipelines for virtual reality and 3D graphics. VR introduced requirements that weren't very important for traditional video gaming just a few years ago. Latency and dropped frames (where rendering a frame takes longer than the refresh rate) took a back seat to high-fidelity AAA rendering capabilities. VR needs to render each frame in time and do it twice: once for each eye. Driven by the requirements of this emerging industry, semiconductor and hardware manufacturers are building new and improved devices, which will inevitably impact how content developers think about optimization.
That said, you should develop and optimize for the lower specs that you want to target. If such optimizations necessitate undesirable compromises, consider separate versions of the game for high- versus low-end platforms. VR device manufacturers have started publishing minimum/recommended hardware specifications, which take much of the guesswork out of this. Start with the recommended Unity settings of your target device and adjust them as needed.
For instance, for mobile VR, it is recommended that you tune for CPU-bound rather than GPU-bound usage. Some games will make the CPU work harder, while others will impact the GPU. Normally, you should favor CPU over GPU. Running in the Editor is not the same as running on a mobile device. However, you can still use the Profiler while running in the device.
It can be useful to have a developer mode in your app that shows a heads up display (HUD) with the current frames per second (FPS) and other vital statistics at runtime. To make your own FPS HUD display, add a UI Canvas to your scene with a child Textobject. The following script updates the text string with the FPS value:
public class FramesPerSecondText : MonoBehaviour
{
    private float updateInterval = 0.5f;
    private int framesCount;
    private float framesTime;
    private Text text;

    void Start()
    {
        text = GetComponent<Text>();
    }

    void Update()
    {
        framesCount++;
        framesTime += Time.unscaledDeltaTime;
        if (framesTime > updateInterval)
        {
            float fps = framesCount / framesTime;
            text.text = string.Format("{0:F2} FPS", fps);
            framesCount = 0;
            framesTime = 0;
        }
    }
}
Some VR hardware producers also provide their own tools. Oculus, for example, offers a suite of performance analysis and optimization tools (https://developer.oculus.com/documentation/pcsdk/latest/concepts/dg-performance/), which includes extensive documentation and a workflow guide for developers. Good stuff! It also includes a Performance Profiler and a Performance Head-Up Display, both of which you can add to your Unity projects.
Summary
Latency and low frames-per-second rates are not acceptable and can cause motion sickness in VR. We are bound by the capabilities and limitations of the hardware devices we run on and their SDKs. In this chapter, we dove into some of the more technical aspects of making great VR by considering four separate areas that affect performance: the artwork, the scene, the rendering pipeline, and the code. This was a survey of the profiling and analysis techniques you can use and suggestions on how to address performance problems. This is no way a prescription for your own specific project, nor is this a complete treatment of this deep topic. This also gets into system architecture and engineering problems that may not be everyone's forte.
We started this chapter by introducing the built-in Unity Profiler and Stats windows, our primary weapons in this battle. To illustrate the impacts of designing models and materials, we built a scene with 1,000 high-poly Mememan objects, examined the performance stats, and learned a couple of ways to improve the frame rate: decimating the models (making them lower poly) and managing the level of detail (LOD) in the scene. Then, you learned about the things you can do at the scene level using static objects, baked lightmaps, and occlusion culling.
Next, we looked at the rendering pipeline and gained some insight into how it works. Then, you learned how to use the recommended Quality, Graphics, and Player settings, VR optimized shaders, and runtime tools to analyze and improve performance. After that, you learned about the basic practices for optimizing your C# scripts. A key to this is understanding the Unity life cycle, game loop, and expensive API functions, thus encouraging you to make frame Update processing as lean as possible.
It should be abundantly clear by now that developing for VR has many facets (pun intended). You work hard to create an awesome project with beautiful models, textures, and lighting. You try to provide a thrilling interactive and immersive experience for your visitors. At the same time, you should also be thinking about the requirements of your target platform, rendering performance, frames per second, latency, and motion sickness. It's never too early to focus on performance. It's a mistake to start too late. Follow the recommended best practices that are easy to implement while keeping your code and object hierarchy readable, clean, and maintainable. However, take a thoughtful, scientific approach to troubleshooting and performance tuning by using the Profiler and other tools to analyze your project so that you can zero in on the root causes rather than spending time on areas that may yield little net effect.
– Tom Forsyth, Oculus
Developing for VR is a moving target. The platform hardware, software SDKs, and the Unity 3D engine itself are all changing and improving rapidly. Books, blog posts, and YouTube videos can be readily superseded as products improve and new developer insights emerge. On the other hand, great strides have already been made to establish best practices, preferred Unity settings, and optimized device SDKs that address the needs of VR developers.
With VR becoming mainstream, it is coming into its own as a new medium for expression, communication, education, problem-solving, and storytelling. Your grandparents needed to learn to type and read. Your parents needed to learn PowerPoint and browse the web. Your children will build castles and teleport between virtual spaces. VR will not replace the real world and ourhumanity; it will enhance it.