

156 CHAPTER 7 ABOUT THESE NUMBERS
3 Carry forward totals. To ensure a painless interaction between the worksheets,
use formulas to carry forward totals. For example, the current-year profit (loss) in
the balance sheet should be taken directly from the bottom line on the profit and
loss account (which is calculated as the sum of individual entries).
4 Use colour. It’s a good idea to use one colour to display the characters in the cells
into which you key raw data (say, black) and another colour for all automated cells
(say, blue). You can then see at a glance which is which. In fact, I take this a stage
further and use red print for cells which are mechanical projections so that it is
easy to see where the assumptions are that might be modified during a review
process. But I usually print the final version in black only – to avoid distracting
other users.
When you have a standard workbook, you can give copies to R&D, Marketing, and so on
for them to complete during the planning exercise. When you get these workbooks back,
you can use an additional identical workbook to automatically aggregate the numbers for
the constituent departments. You then have consistent financial plans for the whole busi-
ness and its constituent parts.
The workbooks can also be used for operational purposes, including tracking actual
spending against budget, which is discussed in Chapter 13.
Putting it to good use
This introduction to accountancy’s idiosyncrasies, crystal ball gazing and spreadsheets
should have set you in good stead for the rewarding task of working out your financial
prospects. I can’t wait. Make sure that you have understood the concepts raised in this
chapter. When you have, see you in Chapter 8.
Squeeze it in
A venture capital provider I knew generally asked for detailed financials for the
first six months only, and for broad expectations thereafter. He maintained there
are so many variables for a start-up that it is pointless trying to look further ahead.
This is a sensible approach. But where you have to show more than 6 months for a
financial statement or forecast, you will find that it is usually possible to squeeze in
15 columns (line number, description, 12 months and a total) on one sheet of A4 or
letter paper. You can always turn it sideways or spread over two pages.
t
PUTTING IT TO GOOD USE 157
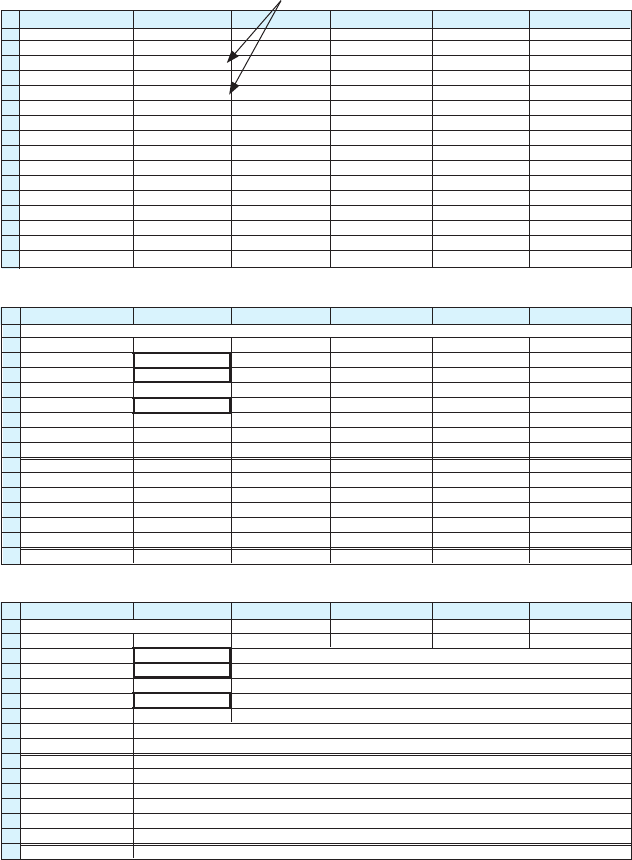
Figure 7.5 Spreadsheet magic
A B C D E F
1
2 Operating costs
3 Year 2007 2008 2009 2010 2011
4 Salaries 10 000 10 000 10 000 10 000 10 000
… … … … … … …
14 Telecomms 1 000 1 020 1 040 1 061 1 082
… … … … … … …
28 Sundry costs 143 453 122 36 445
29 Total expenditure 23 967 25 333 24 666 24 921 24 921
30
31 P&L summary
32 Year 1999 2000 2001 2002 2003
33 Gross profit 45 654 34 566 37 543 35 567 35 468
34 Less expenditure 23 967 25 333 24 666 24 921 24 921
35 Net profit 21 687 9 233 12 877 10 546 10 547
36
A B C D E F
1
2 Operating costs
3 Year 2007 Each cell displays the value in the cell to its left incremented by 1
4 Salaries 10 000 Each cell displays the value from the cell to its left
… … … …
14 Telecomms 1 000 Each cell displays the value in the cell to its left increased by 2%
… … … …
28 Sundry costs Each cell displays the corresponding value from the worksheet called 'Sundry'
29 Total expenditure Each cell displays the sum of the values above
30
31 P&L summary
32 Year Each cell displays the corresponding value from row 3
33 Gross profit Each cell displays the corresponding value from row 29
34 Less expenditure Each cell displays the corresponding value from the worksheet called 'Gross' (profit)
35 Net profit Each cell displays the value in row 33 less the value in row 34
36
A B C D E F
1
2 Operating costs
3 Year 2007 =B3+1 =C3+1 =D3+1 =E3+1
4 Salaries 10 000 =B4 =C4 =D4 =E4
… … … … … … …
14 Telecomms 1 000 =B9*1.02 =C9*1.02 =D9*1.02 =E9*1.02
… … … … … … …
28 Sundry costs =’SUNDRY’!B45 ='SUNDRY'!C45 ='SUNDRY'!D45 ='SUNDRY'!E45 ='SUNDRY'!F45
29 Total expenditure =SUM(B4:B28) =SUM(C4:C28) =SUM(D4:D28) =SUM(E4:E28) =SUM(F4:F28)
30
31
32 =A3 =B3 =C3 =D3 =E3 =F3
33 =’GROSS’!A99 ='GROSS’!B99 ='GROSS'!C99 ='GROSS'!D99 ='GROSS'!E99 ='GROSS'!F99
34 Less expenditure =B29 =C29 =D29 =E29 =F29
35 Net profit =B33-B34 =C33-C34 =D33-D34 =E33-E34 =F33-F34
36
What you entered:
What you see:
What it means:
Only three new figures
..................Content has been hidden....................
You can't read the all page of ebook, please click here login for view all page.