

FINANCIAL OBJECTIVES 331
Unfortunately, it never works quite as smoothly in practice as this simple exposition
suggests. But the logic is compelling and intellectually satisfying. I will look at some stum-
bling blocks in a moment. First, we should complete the mechanics by looking at how the
financial part of your business plan is brought into play.
How much freedom?
You want your employees to try to achieve their objectives while operating within your
plans, policies, rules and procedures. It is common to set limits on the amount of discre-
tion permitted – at both the functional and the personal level. This might be related to
general decision-making (the Chief Executive is authorised to operate the business within the
business plan as approved providing that the following exceptional items are pre-approved by
the Board of Directors on a case by case basis …). Or limits might be financial.
For example, department heads might be permitted to spend up to $10,000 in one
month or on any one item, but your head of R&D has had his knuckles rapped for buying
pointless electronic gadgets and his personal limit is just $5000. This spending usually, of
course, has to be within guidelines already identified in their budgets.
Financial objectives
There is one more set of objectives that you need to take into account: budgets – which is
another name for financial objectives. They are yardsticks against which you can measure
actual performance. People tend to get rather hung up about budgets. They are actually
straightforward. Keep an open mind as you read the next few paragraphs.
You do not have any more work to do at the outset. In the financial section (Chapters
7–10) we agreed that you would use your central – most likely – forecast as an operating
budget for the first year of your plan.
As you progress through the year, your accounting people will prepare monthly state-
ments of actual revenue and spending. You might sit behind the accounting desk from
time to time yourself and do this if you are running your own business and the finances
are simple.
Once a month, as close to the end of the previous month as possible, compare actual
spending and revenue against the budget. I do not suggest waiting for the end of the
quarter. Three months is too long if things are going off track.
Don’t forget to watch all the gauges, see page 302.
t
332 CHAPTER 13 NOW MAKE IT HAPPEN
COMPARING THE REALITY WITH THE PLAN
Numbers tend to look scary when they gather together in large groups. My grandfather
always used to say avoid any gathering of large numbers. With hindsight, I am not sure if he
was warning about crowds of football spectators or the monthly budget review. In fact,
although this might look dull and complex, it’s actually simple and revealing. It can pro-
vide valuable insight.
Figure 13.7 shows extracts from three spreadsheets that you might use.
1 The first is your original budget – this is what you planned.
2 The second shows the actual transactions (the outturn) – this is what you did.
3 The third brings the first two together in a common summary format – this shows
where the reality diverged from the plan.
Look carefully at the third spreadsheet. It shows planned and actual spending in the
month, together with the actual and percentage variance between the two. It also does
the same for the year to date – the first six months in this example.
The three examples, salaries, travel and total spending, are illustrated graphically in
Figures 13.8–13.10. With such pictures, it is easy to spot what is happening. You can read
the same information from the budget report (the lower spreadsheet).
Taking each graph in turn, the following information is revealed.
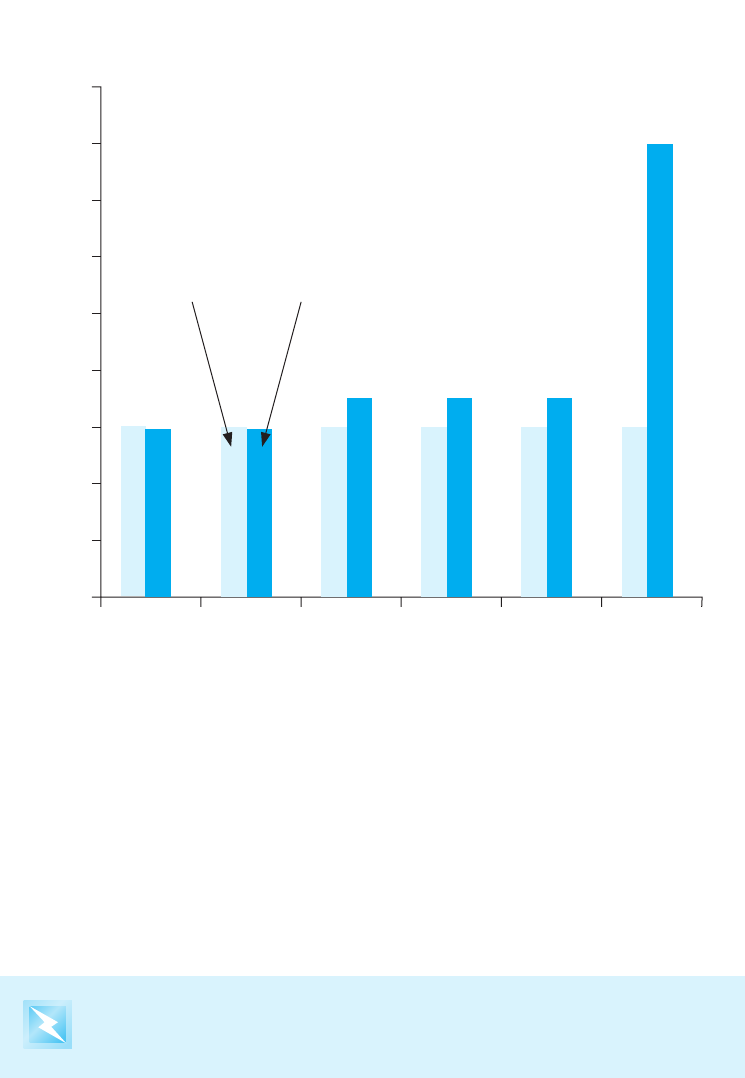
SALARIES
Salaries were close to budget each month until June. Over the first six months they were
just 2.3% above plan and even in June itself they were within what might be regarded as
a reasonable margin of error – 10%. However, the sudden jump in June suggests an unex-
pected event – perhaps across-the-board pay awards or recruitment of an extra member
of staff. This merits investigation.
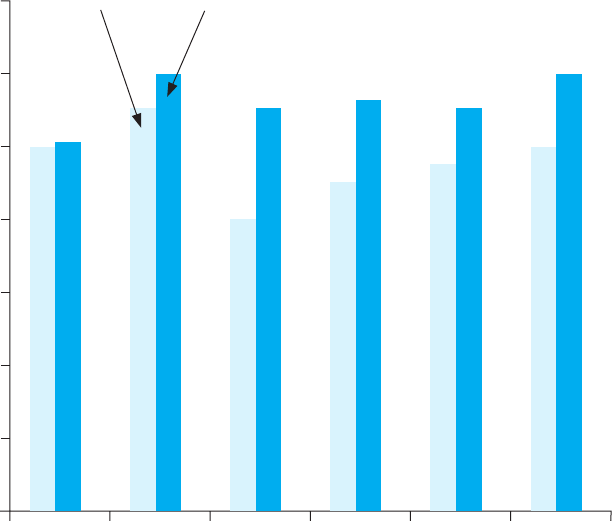
TRAVEL
The percentage variances show that travel spending is running seriously over budget and
needs investigation. Looking back at the raw data (illustrated in Figure 13.9) there is per-
sistent overspending that should have been questioned already.

FINANCIAL OBJECTIVES 333
Figure 13.7 Sample monthly budget health check
A B C D E B C D E
1 Marketing Department
2 Budget report June 20xx
3 Local currency
4 Month of June Year to end June
5 Actual Budget Variance Var, % Actual Budget Variance Var, %
6 Salaries 11 004 10 000 1,004 10.0 61 351 60 000 1 351 2.3
… … … … … … … … … …
24 Travel 5 995 5 000 995 19.9 33 531 28 750 4 781 16.6
… … … … … … … … … …
51 Total spending 458 204 399 750 58 454 14.6 2 619 356 2 481 600 137 756 5.6
52 Contingency used 58 454 39 975 18 479 46.2 137 756 248 160 –110 404 –44.5
53 Total spending 458 204 439 725 18 479 4.2 2 619 356 2 729 760 –110 404 –4.0
A B C D E F G H
1 ZXTY International
2 Marketing Department
3 Budget for calendar year 20xx
4 Local currency Year to
5 Jan Feb Mar Apr May Jun end June
6 Salaries 10 000 10 000 10 000 10 000 10 000 10 000 60 000
… … … … … … … … …
24 Travel 5 000 5 500 4 000 4 500 4 750 5 000 28 750
… … … … … … … … …
51 Total actual 400 050 410 150 385 450 433 000 453 200 399 750 2 481 600
52 Contingency 40 005 41 015 38 545 43 300 45 320 39 975 248 160
53 Total spending 440 055 451 165 423 995 476 300 498 520 439 725 2 729 760
54 Cumulative 440 055 891 220 1 315 215 1 791 515 2 290 035 2 729 760
56
A B C D E F G H
1 Marketing Department
2 Outturn for January to June 20xx
3 Local currency
4 Year to
5 Jan Feb Mar Apr May Jun end June
6 Salaries 9 986 9 986 10 125 10 125 10 125 11 004 61 351
… … … … … … … … …
24 Travel 5 120 5 977 5 450 5 569 5 420 5 995 33 531
… … … … … … … … …
51 Total actual 399 457 420 435 399 499 451 397 490 364 458 204 2 619 356
52 Unused contingency 40 598 30 730 24 496 24 903 8 156 –18 479 110 404
53 Total budget 440 055 451 165 423 995 476 300 498 520 439 725 2 729 760
54 Cumulative, actual 399 457 819 892 1 219 391 1 670 788 2 161 152 2 619 356
56
Salaries within acceptable % variance
but check if Marketing recruited
above headcount budget in June
or conceded big pay increases
Total spending was high in June.
Contingency for month was exceeded
by 46% (worrying) BUT less than half
the contingency for Jan-June was
consumed (good) and overall spending
is 4% below the total provision
Travel is running over budget.
Check and control or revise budget
334 CHAPTER 13 NOW MAKE IT HAPPEN
TOTAL SPENDING
The summary shows that total expenditure in the year to June was 5.6% over the level
of identified planned spending, but still within the overall plan including the 10% contin-
gency. Spending in the month of June was over target.
What does all this tell us? It indicates that percentages are more revealing than raw
numbers. It shows that many questions can be raised by a quick perusal of the budget
report. It highlights the fact that more information is needed. It is, incidentally, valuable
to include volume figures – such as planned and actual headcount, number of units pro-
duced or sold, volume of inventory, number of contracts completed.
This shows that spending was close to plan every month until June (note that to magnify
the pattern, the left-hand scale does not start at zero)
11
200
11
000
10 800
10 600
10 400
10 200
10 000
9 800
9 600
9 400
Jan Feb Mar Apr May Jun
Budget Outturn
Figure 13.8 Salaries, planned and actual
Most important, you cannot make any decision without looking at both the
spending and the revenue side of the equation.
FINANCIAL OBJECTIVES 335
If the extra spending is going into generating more sales it might be entirely acceptable
and welcome. However, recall from Chapter 11 (risks) that it can sometimes be counter-
productive if sales exceed their optimum level.
EXTRACTING VALUE FROM A BUDGET REPORT
There is perhaps nothing more common or more irritating than a manager or director
who is hung up on spending figures. The budget is only a forecast. The reality is more
important. And this is not usually measured by whether you are or should be spending
$100 or $200 on telephone calls. It is usually measured by whether you are achieving your
objectives. So, as already indicated, take spending with revenue – and look at this in the
light of your overall objectives and constraints.
When it comes to producing or reviewing monthly budget reports, it is clearly neces-
sary to have an understanding of why the outturns are above, in line with or below plan.
This understanding is usually conveyed in a written commentary. Ten warnings are listed
on page 336 – things to explain in the commentary or to watch for when reviewing
budget reports. Remember that the originator always knows better than the recipients
the details and where to hide things. In this connection, you might also wish to look back
to page 210, Areas where managers massage costs.
Budget Outturn
6000
7000
0
Jan Feb Mar Apr May Jun
1000
2000
3000
4000
5000
This shows clearly that spending was above plan every month
Figure 13.9 Travel spending, planned and actual
..................Content has been hidden....................
You can't read the all page of ebook, please click here login for view all page.