
238 CHAPTER 10 FUNDING THE BUSINESS
Figure 10.5 Financials from the business plan
TETRYLUS BUSINESS PLAN Doc 20110136 Financial Analysis
FINANCIAL ANALYSIS, continued
Profit and loss account
The revenues and costs described above are brought together in
the profit and loss account in Table 12 (full details are in Annex A).
The $1.4m net loss in year 1 reduces to $0.2m in year 2 and turns to
a net profit of $3.8m by year 3. Sales could …
Balance sheet
A summarised balance sheet is shown in Table 13 (full details are in
Annex A). By year 5, retained earnings exceed $12m and net asset
value is …
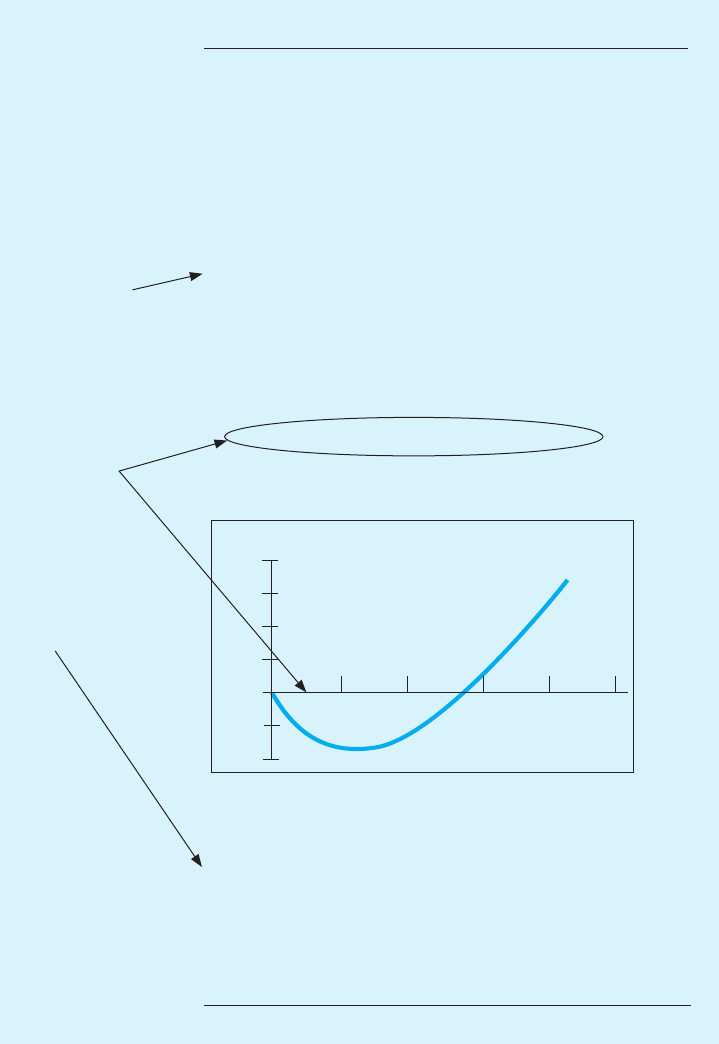
Cash flow and funding requirements
The following chart illustrates our cumulative cash flow projection
(detailed figures are in Annex A). Monthly cash inflows start to ex-
ceed outflows by month 14 and we move into a surplus by month 30.
Our maximum funding requirement is $1.25 million …
…
Valuation
On a modest price earnings multiple of 10, the implied market value
of the equity capital will be nearly $40m by year 3 … This would
represent a potential return on investment of …
Copyright © 2011 TETRYLUS Inc Page 16 of 20
The real grit was in
the sales projections,
and cost structure.
Now this is brought
together to reveal the
bottom line. You need
a sensible summary
highlighting key points
(think about it from
the perspective of your
audience).
This is starting to
illustrate value to
prospective backers.
This is the hole that
you are asking backers
to jump into …
… and here is their
reward when they climb
out.
Year 3 Year 4 Year 5
Cumulative cash flow projection
Year 1 Year 2
$4m
3
2
1
0
–1
–2
..................Content has been hidden....................
You can't read the all page of ebook, please click here login for view all page.