
Chapter 11. Determining Entry Points
Now that you understand the pattern-recognition strategy and the importance of keeping a trade journal, we will begin to discuss and dissect the mechanics of an actual trade. In an earlier chapter, I briefly mentioned the two different methodologies I use when entering a trade: anticipatory or reactionary. This chapter covers each in detail, along with a hybrid method I call delayed reactionary. The examples included assume that you have already identified a potential trade and that the strategy of either going with the trend or playing a trend change has been predetermined. Let’s look at a specific example.
Assume that through your daily chart work you have come across the chart of Ford Motor Co. on November 5, 2009, shown in Figure 11.1. You notice that the stock has been establishing a series of lower highs and lower lows for the past several weeks, developing a very notable angular descending trend line, which I have drawn on the chart. You also note that Ford seems to be consolidating in a tighter range, possibly preparing to break out of this trend and embark on a move higher. You suspect this because the market has been advancing as a whole, and the larger trend is clearly up. Therefore, you are inclined to look for potential longs. It is at this point you must decide whether you will enter this trade in anticipation of a break or act in a reactionary fashion after the break occurs. The methodologies are self-explanatory in that an anticipatory trade is one taken before the desired action, whereas a reactionary trade is one taken only after the desired action has taken place. Many variables come into play when deciding which methodology to apply, such as how confident you are of the pending action and how the general market is acting. The biggest variable, however, will typically come down to your trading schedule and the time available to be in front of the computer watching the action unfold.
Figure 11.1 Ford trading below an angular descending trend.
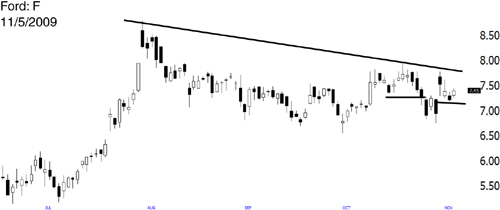
Chart courtesy of Worden—www.Worden.com.
Most part-time traders do not have the option due to their limited time, and so must use an anticipatory approach. However, this is not always the case. Although I do encourage part-time traders to gain a firm grasp of anticipatory trading, I have seen firsthand that one of the best methodologies utilized by a part-time trader is a reactionary style deployed in the final hours of the trading day. This method is the basis for the hybrid methodology we will discuss called delayed reactionary. Clearly, risks are involved with either, and each methodology requires its own unique variables, such as where to set a stop and how large a position to take. We cover these extremely important variables in subsequent chapters. I believe that as you evolve as a trader, you will eventually seek to perfect and utilize each methodology. However, in the beginning, it is of utmost importance to focus on one method at a time, to gain a fundamental understanding and experience a period of success before moving on.
Let’s take the Ford trade a step further and dissect the different methodologies and review how you would have fared. Take a look at Figure 11.2. It is the same as Figure 11.1 except for the addition of an ascending angular trend and an arrow that notes the current consolidation. Because the stock is coiling up like a spring above and below two critical trends, you determine the probability for a significant move is high. You assume that the move may be a break up rather than down because the general market trend has been higher. You begin to study the stock, watching for signs to confirm your thoughts. As a passive trader, working your full-time job all throughout the day with limited opportunity to check the markets, you place a limit order with your broker to execute a buy at the $7.50 level, with a stop on a break below $7. (Do not analyze the stop at this time; we dissect stops in the next chapter.) The following day the order is executed as the stock makes a 4% move toward the upper trend line, closing the day dead into that key resistance point, the angular trend as noted in Figure 11.3.
The following day, the stock breaks the trend line and goes on to have a solid move, topping out in the very short term at $9.14. Assuming the broker executed your limit order to purchase the stock and you received a price around $7.60, the trade is already showing you an unrealized profit of 20.26% in the first two days. It’s at this point you might be shaking your head thinking that a 20% gain in two days is a rare event. In part, you may be correct. However, when you understand and can execute the pattern-recognition strategy, with a defined plan such as the one we’re laying out, you will quickly learn it is not that uncommon to see incredible returns in short order.
Figure 11.2 Ford trading between angular trend lines.

Chart courtesy of Worden–www.Worden.com.
Figure 11.3 Ford advancing towards the angular descending trend.

Chart courtesy of Worden—www.Worden.com.
The difference lies within the pattern-recognition strategy itself that seeks to find trading opportunities prior to a bigger move. Most traders disregard the importance of proper timing, as we discussed in an earlier example of our two investors trading the same stock. In that scenario, Investor 1 did not seek to improve his entry point at all, whereas Investor 2 waited patiently for an ideal entry and thus improved his returns a great deal. As a trader, you should never accept dead money, continuing to hold a stock that isn’t moving in the direction you desire. Furthermore, you should always be seeking to improve your timing and entering trades only when they’re ripe for a move. There is a fine line between hyperactive trading based on impatience and allowing a trade to mature in a healthy manner, yet the purpose of adhering to a pattern-recognition strategy is to play the stocks that have the potential to move in a predetermined direction fairly quickly. Seeing rapid gains when you time an entry appropriately is something you will become accustomed to, and I suspect you will soon realize how powerful such a trading strategy can be.
Returning to our Ford example, let’s assume that after recognizing the stock setup your schedule did not mandate you anticipate the break. Instead, you could wait for the break to occur, before taking the trade at all. This reactionary strategy may improve the success rate of your trades, due to only entering after the desired movement has already begun. Assuming you are in front of your computer for most of the day, and have the luxury of waiting for the ideal entry to execute your order, it would make sense then, that you would not enter the trade at the same level you would have used when anticipating the break, but would instead execute at the price after the stock broke over the trend line indicated on the chart. For the purposes of this example, we’ll assume that due to a normal delay, such as how quickly the stock was moving or how long it took to enter your order, you did not execute on the exact breakout price of $7.80 but rather $7.90.
Regardless of the strategy from which you entered Ford, the stock broke higher, showing gains for both the anticipatory and reactionary method. Because you were following the anticipatory strategy and entering before the break, the price from which the trade was executed was lower, resulting in a higher return on investment. Despite this higher rate of return, the anticipatory strategy was susceptible to the potential that the break higher never occurred at all. Because the reactionary strategy was contingent on the break higher to be executed, it made this potential for failure obsolete. Anticipatory traders often enter trades that never move according to plan. Why then would anyone take a trade in anticipation of a move rather than wait for the move to occur first? More often than not, the methodology you deploy will be determined by your schedule. You might not have a choice and will have to default to an anticipatory approach. If that is the case, you will have to be much more selective and exercise great discipline to find success. Make no mistake, however, that the reactionary style is far from foolproof. With so many traders seeking to capitalize on reactionary moves such as the one we’ve studied with Ford, many times these breakouts will reverse abruptly and result in a loss for reactionary traders in the same day. Typically, this activity becomes a theme dependent on the current trading environment and may be grounds to become a strategy within itself, whereby you actually look to profit from the failure of a technical break. Not only do you improve your odds of pattern success with the reactionary style by knowing the break has definitely taken place, but there is also the added benefit of a closer stop level. If you recall from our example, the reactionary method had a much smaller percentage stop than the anticipatory. This means you could take a larger amount of stock, while maintaining the same level of financial risk, as you did on the anticipatory trade. Stated further, if you were to enter the anticipatory trade at $7.60 with a stop below $7, you would be risking .60 per share. If you were to take the trade as a reaction to the break, entering the trade at $7.90, with a stop at $7.70, your risk per share would be .20. To expose yourself to the same amount of financial risk on the reactionary trade as you did on the anticipatory trade, you would need to take three times as many shares. Following my profit strategy, which is calculated using multiples of risk, you would achieve your profit levels much more quickly on the reactionary trade than you would on the anticipatory trade. Again, we will delve further into the intricacies of stops, risk, and profit levels in subsequent chapters.
Now let’s take a look at what we’ll call the delayed reactionary methodology. This is a hybrid of our reactionary style tweaked slightly to accommodate a more passive trader. Instead of taking the trade the moment the stock breaks the desired price point, you do not make a purchase until you are certain the break will hold. This generally means waiting until the trading day is coming to a close before executing an order. This hybrid methodology attempts to both improve the success rate of trades and to avoid same-day reversals (which are not uncommon) while maintaining the passive strategy typically mandatory for part time traders. This strategy does, however, assume you have the ability to check the market and your stocks within the final hour of the day to place any trades needed before the market closes.
For this example, let’s assume you are checking back in on the market in the final hour of trading the day Ford is breaking out as shown in Figure 11.4. With the day coming to a close, you are certain that Ford has broken out. You did not enter the trade as it was occurring, nor will you wait until the following day to place your trade. Instead, you enter the trade at $8.15, a few pennies from the high of the day, which also happens to be the closing price. To ensure you do not remain long Ford in the event the stock reverses resulting in a failed breakout, you place a stop at the day low, which would negate the break of $7.75. As with our previous two examples, the delayed reactionary trade experiences a gain, as Ford moves higher the next few sessions toward its short-term top of $9.14. It isn’t surprising that your unrealized gain for the trade while adhering to this style is smaller than that of the anticipatory or reactionary methods. Your financial risk per share is between both the anticipatory trader (.60) and the reactionary trader (.20), coming in at .40 per share ($8.15 – $7.75). In essence, you are willing to accept a lesser rate of return than was experienced with the anticipatory style to improve the odds that the initial break you are looking to capitalize on doesn’t reverse the same day. The delayed reactionary style is a perfect hybrid for the part-time trader who still has intermittent access to his charts and brokerage platform throughout the day, specifically the final hour of trading.
Each style has its positives and negatives. However, only the anticipatory trade mandates entering the stock before the break, thus opening yourself up to the potential of the break never transpiring at all. You are rewarded for this risk with a much better return once the move unfolds (if and when it does). Once you understand the different methodologies, I suspect you will favor the reactionary or delayed reactionary style. For some, this just might not be possible. The anticipatory method is discussed and taught so that regardless of your schedule you can make successful trades.
Figure 11.4 Ford breaking above a descending angular trend.
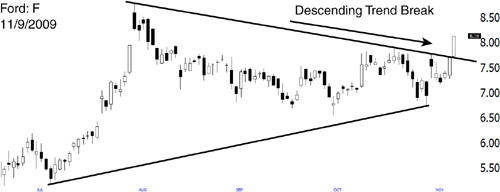
Chart courtesy of Worden—www.Worden.com.
The Ford example looked at a trend-change style using the three methodologies. Let’s now review a trend-following style in which you seek to simply follow the existing move. Suppose, for instance, that during the early part of July 2009, July 10 to be exact, you stumble on Express Scripts. As noted in Figure 11.5, Express Scripts had started to advance off its March bottom, establishing a defined trend higher. When you found Express Scripts, you also noted that the stock was approaching the trend support or the area in which you would enter a long-side trade, buying the stock if you believed the trend would continue.
Figure 11.5 Express Scripts trading above an angular ascending trend.
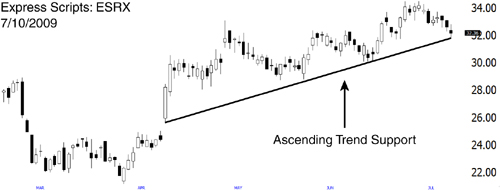
Chart courtesy of Worden—www.Worden.com.
Let’s assume for a moment that you are about to embark on a business trip during which you will have little or no access to the Internet. Instead of passing on the trade completely, you place a “good till cancel buy limit order” for Express Scripts at $32, the approximate level you believed the trend support to be. This order says that you are willing to buy Express Scripts at $32, and it will remain an open order while you are away on your trip. You are willing to give the position some room to move, so you place a conditional stop order $1 below your entry, to be executed only if your initial buy order is placed and you do in fact own the stock at $32. As a side note, the broker you are using should have these capabilities and be willing to help you place the orders you need. Even if you don’t fully understand the lingo, you should be able to explain your strategy and see your broker comply.
The very next day, while you are flying across the country enjoying your peanuts and in-flight movie, Express Scripts drifts lower, and your initial buy order is executed at $32. As soon as your buy order is complete, your stop order is also entered. The trade shows you a loss of .20 because the low for the day was $31.80. However, this is still well above your predetermined stop price, and you remain in the trade. As the market continues to roll along, you spend the remainder of July taking care of your business engagements, while Express Scripts continues to follow its predetermined trend, showing you a solid gain of 15.63%, reaching a high of $37 on July 30, just 14 trading days after your initial buy order was executed.
In this example, because of your travels you had to be anticipatory or proactive with your selection and order entry. Let’s now review what the trade would look like if you had the luxury of the stock confirming the bounce and trend-following pattern you previously laid out, before entering your trade. Not wanting to see a reversal the same day, you wait until the final minutes of the day Express Scripts bounces off the ascending trend, executing your buy order for $32.57, the closing price of Express Scripts. Because you don’t want to be in the trade should it reverse and trade below your critical trend line support, you place a stop slightly below the day’s low at $32.50. Without ever coming close to being stopped out, you experience the same move as your anticipatory trade, riding Express Scripts to a high of $37, just a few trading days later. The delayed reactionary method results in an unrealized gain of 13.6%. Although this return is below the anticipatory trade return of 15.63%, the financial risk for the delayed reactionary method was $.07 per share, whereas the anticipatory trade required $1 of risk per share. Let’s assume the predetermined financial risk you are willing to take is a total of $100 on any given trade. On the anticipatory trade, you set a stop $1 below entry, which means you were able to buy 100 shares. On a delayed reactionary trade, however, by risking .07 per share, the same $100 risk allowed you to buy 1,428 shares. When the trade was all said and done, the risk reward was far greater on the reactionary side than on the anticipatory side.
Of course, not every trade will be profitable. In fact, as you become a successful trader, odds are you will experience almost as many losers as you do winners. It is only by exercising your proven and strategic edge that you will be allowed to consistently make money over time.
Let’s review the different methodologies as we work through a trade that does not work and study its consequences. Let’s assume that through your chart work you come across General Electric on February 1, 2010, as shown in Figure 11.6.
Figure 11.6 General Electric trading in between angular trends.

Chart courtesy of Worden—www.Worden.com.
Despite the fact that the general market at that specific time was experiencing some weakness, your view of the longer-term trend being up, along with the bullish consolidation in General Electric, had you believing that a long side trade might be successful and worth an attempt. If you were trading in anticipation of the break above trend, you would waste no time, more than likely, taking your shares on the very day you noticed the setup. For the purpose of this example, we’ll assume you execute your order at $16.25, the closing price for that day, with a stop at $15.50, risking .75 per share. The break you were anticipating doesn’t take long to transpire, because the very next day the stock moved to a high of $16.95, edging out above the descending trend line shown on the chart. The day after that, General Electric did not follow through but rather reversed resulting in a failed breakout. Despite the reversal, your anticipatory trade is not yet stopped out. Instead, it shows an unrealized gain of 2.64%, or the difference between the $16.68 closing price on the day of the reversal and your anticipatory entry of $16.25. At this point, you might choose to raise your stop in the anticipatory trade, noting that something may be wrong with the trade if it did not follow through to the upside. For the purpose of this example, we’ll assume you do not, because you are not able to review trades or charts (because you are once again traveling for business).
The following days, General Electric experiences significant weakness, not only reversing back to your anticipatory trade entry point, but far below, stopping you out at your predetermined stop point of $15.50 and solidifying a loss of .75 per share.
If you were not anticipating within General Electric, the reactionary or delayed reactionary style would have you waiting for confirmation of the break. Playing the reactionary style, you go long General Electric a day after finding the trade. The breakout level in General Electric corresponds to the highest trade of the day, so we’ll assume you enter General Electric at the day’s high of $16.95, placing a stop .20 below, the point at which you think the break would be a failure. Despite reversing slightly into the close, General Electric does not stop you out of your reactionary trade the same day, closing at $16.85. The very next day, however, you are stopped for your full loss of .20 per share.
Within the delayed reactionary style, you are waiting for a break confirmation in addition to making sure the break holds all throughout the day. Despite the small reversal into the close, General Electric holds its breakout level, so you enter the trade at the closing price of $16.85. Adhering to the same stop level as you would in your reactionary trade ($16.75), you use a .10 stop for your delayed reactionary style, which would negate the break and take you out of the trade. The following day you are stopped out of General Electric at a loss of .10 per share.
Let’s assume that your financial risk per trade remained constant for each strategy you followed in the preceding example, and that risk was $100 for the entire trade. Because your risk per share was .75 within your anticipatory strategy, you would have taken approximately 133 shares ($100 / .75). Within your reactionary style, you risked .20, so you entered the trade by taking 500 shares ($100 / .20). Finally, within your delayed reactionary style, you risked .10 per share, so you entered the trade by taking 1,000 shares ($100 / .10). Because all three trades were stopped for their respective losses, each trade would have lost you $100, with only the anticipatory trade showing you a profit at any time.
In my opinion, no statistical evidence supports one strategy being superior to another. In the General Electric example, all the financial losses were the same. Had the trade been profitable, it would have shown you a greater reward in a more rapid fashion if you had taken the smallest risk per share, which equates to the greater share count. No style presented will provide you with a greater edge or a reduced risk.
The importance of the strategy is found within its ability to meet your realistic trading schedule. Adopting the correct strategy is of utmost importance. If you haven’t thought about the strategy that is right for you, do so now.