
20
Strategy Mapping with Visio and PerformancePoint
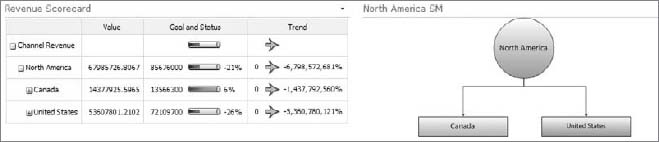
In SharePoint 2010 you have the ability to create relationships between key performance indicators (KPIs) and a shapes Visio diagram. This relationship is called a strategy map. Typically, in a PerformancePoint Dashboard you will see a scorecard coupled with a strategy map, as shown in Figure 20-1.
When creating strategy maps, you are not limited to the one shown in the figure. You can use any Visio diagram to create a strategy map. However, when designing your diagram, care should be taken when choosing shapes. If you want the shapes and colors to automatically update, avoid using complex shapes such as those that include groupings or sets of other shapes. In this lesson, you will learn how to leverage the contents of a scorecard to create a strategy map.
WHY DO WE MAP STRATEGY?
Strategy maps are created for various reasons. Typically, strategy maps are created to assist organizations in visualizing and uncovering strategic objectives. In addition, the mapping also illustrates cause-effect relationships among an organization or department objectives and strategies. For example, you could create a strategy map to show performance metrics across plants in a region. You could also create a strategy map that shows how individual branch offices are performing across the country. Regardless of your motive, the end results should reveal existing or potential bottlenecks that may hinder the success of your company.
CREATING A STRATEGY MAP
You can use PerformancePoint Dashboard Designer to create a strategy map inside of SharePoint 2010 that can be included on your dashboard. A scorecard will be used as the data source for the strategy map. Each shape is connected to a KPI in a scorecard when designing and configuring a strategy map. The color of the shape will correspond to the performance of the particular item.
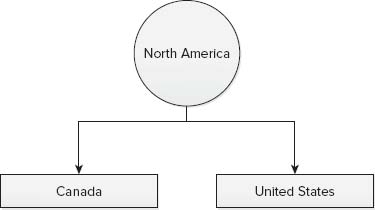
To create a strategy map, start by creating a diagram in Visio and a scorecard in PerformancePoint. Before you create a strategy map report, make sure that you are using the 64-bit version of Microsoft Visio. Figure 20-2 is a simple Visio drawing, which is a simple strategy map that shows a country grouping at the top level and its corresponding countries below.
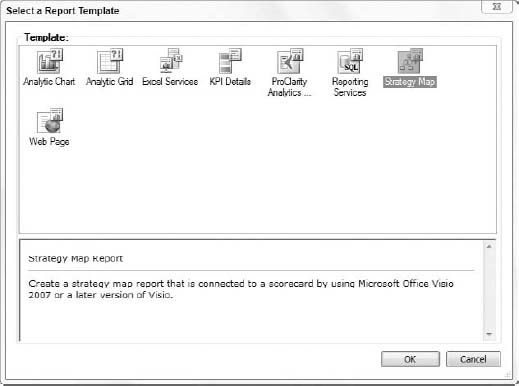
Once you have completed these steps, start the Dashboard Designer and locate the Workspace Browser pane. Then right-click the PerformancePoint Content item and select New ![]() Report from the dialog box that appears. In the Select a Report Template window, shown in Figure 20-3, choose Strategy Map and click OK.
Report from the dialog box that appears. In the Select a Report Template window, shown in Figure 20-3, choose Strategy Map and click OK.
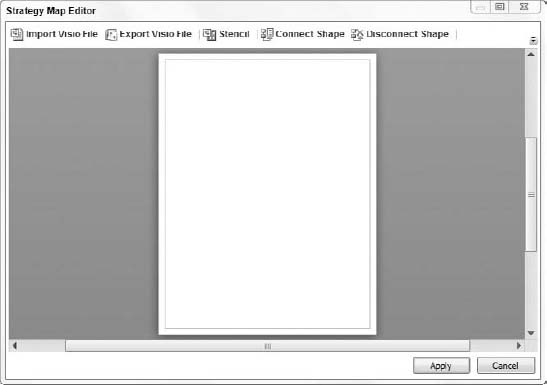
On the next screen select the scorecard that will serve as the data source for the strategy map. A blank report will be created. Now click the Edit Strategy Map icon in the top-left corner of the designer and the Strategy Map Editor will appear, as shown in Figure 20-4.
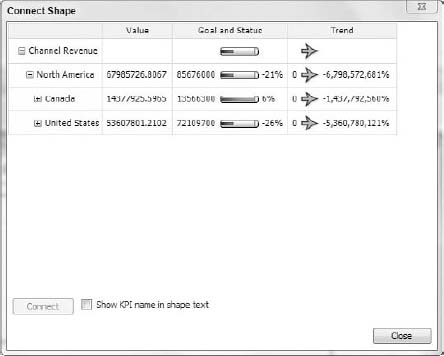
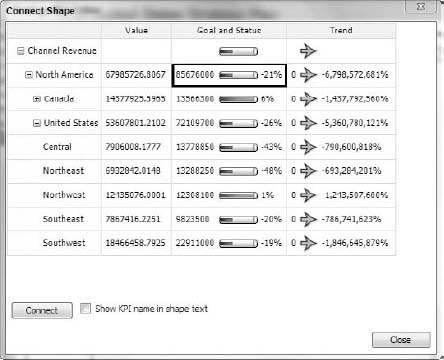
You can now either import an existing Visio file using the Import Visio File button or you can create a Visio diagram from scratch by clicking the Stencil button. Regardless of your selection, all the subsequent steps are the same. Select a shape from the diagram and click Connect in the menu bar. The Connect Shape dialog window appears, as shown in Figure 20-5.
Select a cell from the Goal and Status column in the scorecard, click the Connect button, and click Close. Repeat the steps for each shape on the diagram. Once you are finished, click the Apply button.
DEPLOYING AND TESTING A STRATEGY MAP
Now that you have created a strategy map, you will need to deploy and test it in SharePoint. The deployment process is very straightforward. To deploy your strategy map, ensure that it is selected in the Workspace Browser. Then click the save icon on the Dashboard Designer menu bar. Once you are done, open your SharePoint Business Intelligence site and click PerformancePoint Content, as shown in Figure 20-6.

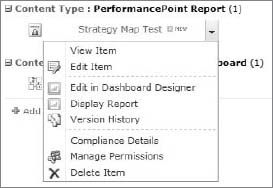
Finally, to test your strategy map, hover over the item in the list and a drop-down arrow will appear. Click the arrow and select Display Report, as shown in Figure 20-7.
TRY IT
In this Try It, you learn to create a strategy map from a Visio diagram. You also learn how to deploy the completed strategy map to your SharePoint site.
Lesson Requirements
Use the Dashboard Designer to create a scorecard. Then create a strategy map that will use the aforementioned scorecard as the data source for each shape. You will need to download Lesson20VisioDiagram from the Wrox website. You will also need to download Visio Viewer, which is located here: www.microsoft.com/downloads/en/details.aspx?FamilyID=f9ed50b0-c7df-4fb8-89f8-db2932e624f7.
Hints
- Create a data source that connects to the Adventure Works 2008 R2 cube.
- Create a scorecard using the Dashboard Designer.
- Create a strategy map using the Dashboard Designer.
- Using the Dashboard Designer, save your strategy map to your SharePoint Business Intelligence site.
Step-by-Step
- If you have not yet done so, deploy the completed Adventure Works cube that you receive when you download the sample databases from www.codeplex.com. You will find the sample files to deploy in the C:Program FilesMicrosoft SQL Server100ToolsSamplesAdventureWorkes2008R2 Analysis Services Project directory.
- Open the SharePoint site Knights24HourSharepoint. If you are starting first on this lesson, just create a new site using the Business Intelligence Center template.
- Select PerformancePoint Content from the Navigation pane on the left.
- Click Add New Item. This opens the PerformancePoint Dashboard Designer.
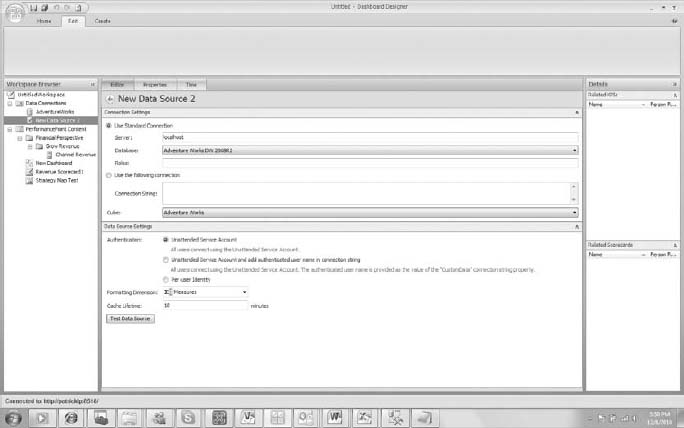
- Right-click Data Connections and select New Data Source.
- Choose Analysis Services as the template and click OK.
- Rename the connection to Adventure Works and fill in the properties shown in Figure 20-8.
- Right-click the PerformancePoint Content folder and select New
 Scorecard.
 - Select the Analysis Services template that will use an existing Analysis Services data source to create the scorecard and click OK.
- Select the newly created data source and click Next.
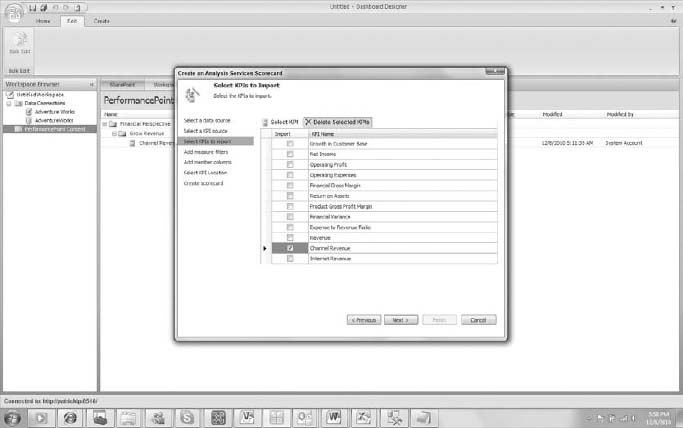
- Select Import SQL Server Analysis Services KPI and click Next.
- Check the Channel Revenue KPI and click Next, as shown in Figure 20-9.
- Click Next to bypass the Add Measure Filters window without making any changes.
- Click Next to bypass the Add Member Columns windows without making any changes. You can add measure filters and member columns at any time.
- Click Finish to publish the KPI to the PerformancePoint Content folder.
- Rename the new scorecard Channel Revenue Scorecard in the Workspace Browser.
- With the scorecard open, drag the Sales Territory hierarchy from the Sales Territory dimension to the right of the words Channel Revenue. The words “Last child” should appear before you drop the hierarchy.
- The Select Members dialog box will open. Expand All and check North America before you click OK.
If you expand any of the Groups, you will see the scorecard values, goals, status, and trends.
- The scorecard is not complete. Right-click the PerformancePoint Content folder and select New Report.
- Select the Strategy Map option and click OK.
- Choose the Channel Revenue Scorecard and click Finish.
- Rename the report United States Strategy Map.
- Click the Edit Strategy Map icon that is located under the Edit Tab on the ribbon, as shown in Figure 20-10.

- Click Import Visio File In on the Strategy Map Editor menu.
- Browse to the directory where you saved the downloaded Visio diagram, select it, and click Open.
- Click the circle labeled North America and click the Connect Shape item in the menu bar.
- On the Connect Shape dialog window, select the cell that is in the Goal and Status column on the North America Row, as shown in Figure 20-11.
- Uncheck the Show KPI name in the shape text checkbox and click the buttons labeled Connect and Close.
- Repeat the steps for all of the remaining shapes. Ensure that you select the row that corresponds to the label in the shape.
- When you are done, click Apply and your diagram should resemble Figure 20-12.

- Click the Save All icon in the Dashboard Designer to deploy the scorecard and the strategy map.
- Open your SharePoint Business Intelligence site and click PerformancePoint Content.
- Hover over the United States Strategy Map and click the drop-down arrow that appears.
- From the dialog box select Display Report and your strategy map will appear.
 Please select Lesson 20 on the DVD to view the video that accompanies this lesson.