
19
Developing and Deploying PerformancePoint and SharePoint Filters
Filters enable a greater level of interactivity for users, and can be used to filter multiple charts, scorecards, and reports at once. In this lesson you learn about the most important filters, how to create them, and how to link them to both PerformancePoint components and SharePoint components.
PERFORMANCEPOINT FILTERS VS. SHAREPOINT FILTERS
Both PerformancePoint and SharePoint provide different filter controls, and each has advantages and disadvantages. PerformancePoint filters generally have much more richly featured UIs, whereas SharePoint filters are more interactive with the SharePoint platform, providing capabilities such as being able to accept defaults from other filters or receiving values from the URL.
Of course different capabilities exist within the different types of filters — SharePoint provides only a dimension filter for SSAS sources, whereas PerformancePoint provides multiple filter types. The Current User and Query String filter types are provided only by SharePoint.
In addition, PerformancePoint filters have the ability to add formulae to connections from the filter to the component — for example, a date picker control could filter a chart by the full month rather than just the day. In Figure 19-1, we've added a formula to return all the children of the current member.

These formulae can use many of the standard MDX functions, using <<UniqueName>> or <<SourceName>> as a placeholder for the currently selected value.
COMMON FILTERS
Filters can either be added to PerformancePoint Dashboards through Dashboard Designer, or to SharePoint pages. The set of steps to add filters is very similar in both, and has been covered in the previous lesson on dashboards. The only addition is the use of connection formulae to modify the values sent from the filter to the component. This section goes through a subset of the PerformancePoint filters, and two of the SharePoint filters. The PerformancePoint filters are listed in Figure 19-2, and SharePoint filters in Figure 19-3.


Time Intelligence Filters
Time Intelligence or TI filters come in two varieties. A Time Intelligence Post Connection Formula filter is a calendar control that passes a date range related to the date picked in the calendar — the calendar defaults to the current date.
A Time Intelligence filter is a drop-down filter with each entry being a formula related to the current data.
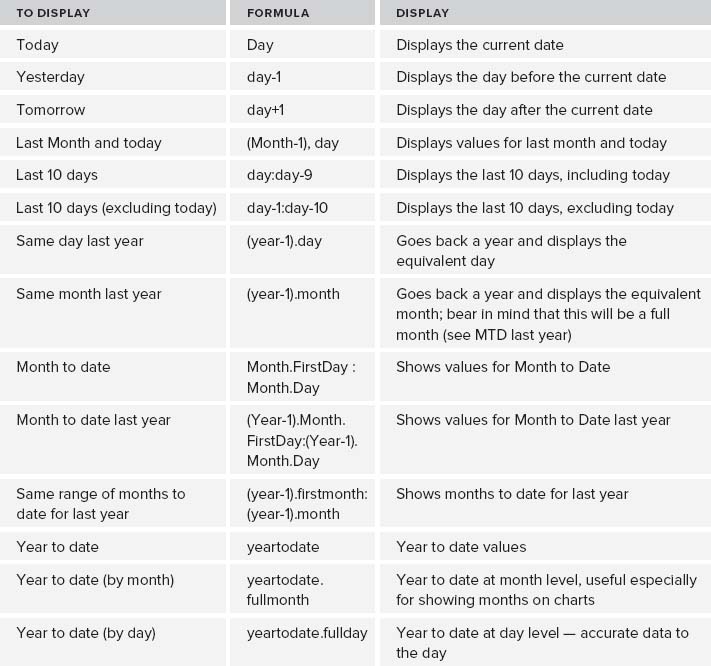
The formulae used are built up from the following items, called Simple Time Period (STP) Specification:
Structure: [(]<Period>[Offset>[)][ <Function>[<Offset>]]]
The following table provides a reference for all the elements of the STP specification.
STP - Simple Time Period Reference Sheet
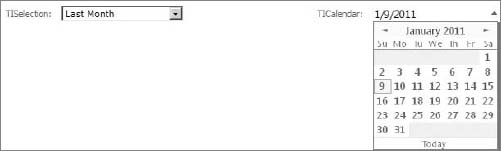
In Figure 19-4, you can see the two filter types next to each other.
Creating a Time Intelligence Connection Formula is very simple, because the only parameter to set is the data source to be used — select Time Intelligence Connection Formula. However, when linking it to a PerformancePoint component (also called adding a connection) an additional step of adding a formula can also be done. See Figure 19-5 for an example of adding a formula for all the months of this year prior to the current month in Dashboard Designer.
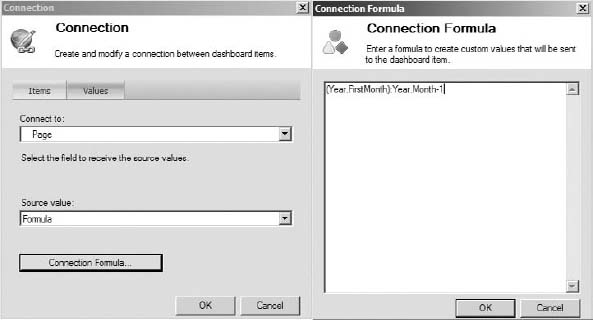
 Note that Source Value could either be Formula or Member Unique Name. If connecting to a Reporting Services Report, it must be Member Unique Name, because the report will not be able to parse the formula.
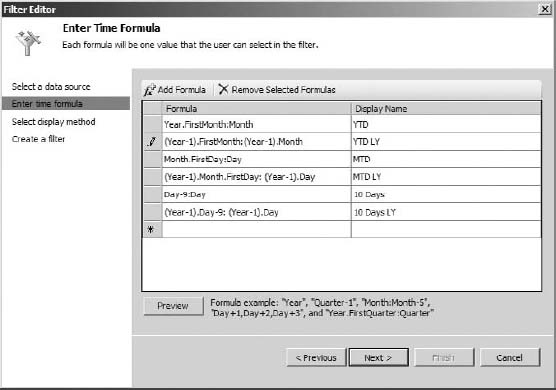
You have some additional steps when creating the drop-down version. Start by creating a new Time Intelligence filter and selecting the data source. In the next screen, enter the formulae and display names for the entries you require in the drop-down, as in Figure 19-6.
You can also preview the formula generated to ensure that it is correct by clicking the Preview button, as shown in Figure 19-7.
Because there is no hierarchy, choose List for the display method.
Time Intelligence formulae don't work with fiscal calendars that have a different month end. In addition, the dimension members need to exist for the formula to be generated.
Because the formulae are entered and used from the drop-down box, no connection formula will be specified when connecting a filter.


Member Selection Filter
A Member Selection filter allows you to include specific members of a dimension, as well as set the filter to dynamically update as more members are added to the dimension.
Start by creating a new Member Selection filter, and choosing a data source.
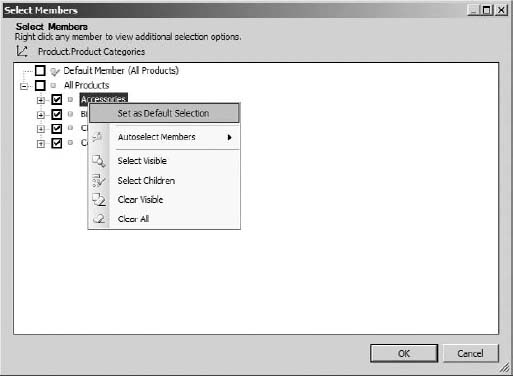
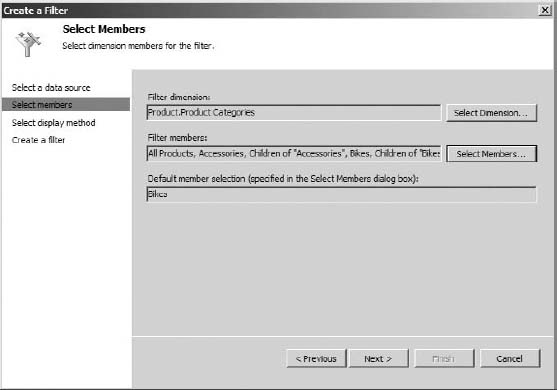
In the next step, select a dimension and the appropriate members, as in Figure 19-8.

After selecting a dimension, select the members as well as set the default by clicking Select Members. Unlike the scorecard, only members you select will appear in the drop-down. Use the Autoselect option to dynamically select members as they're added to the dimension. Right-click and select Set as Default Selection, as in Figure 19-9.
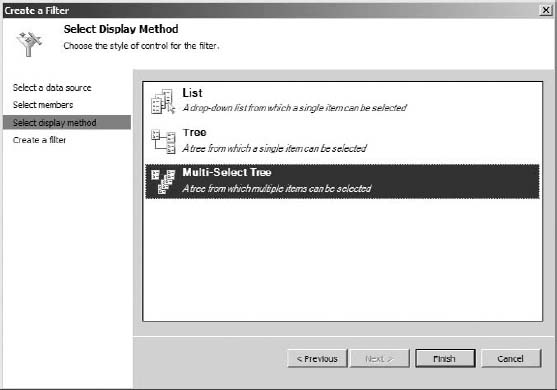
Depending on whether you want to allow multiple selections, you can choose either Tree or Multi-Select tree, as shown in Figure 19-10. If you have members from multiple dimension levels, List is likely to be confusing.
Click Finish to create the filter.
Named Set Filter
A Named Set is a collection of individual members in analysis services. A Named Set filter uses the individual members of this set as items to choose from in the drop-down selection. To use an Adventure Works Named Set as an example, choosing Top 25 Selling Products would give you a drop-down list of all the 25 products, and allow you to select an individual product from these 25 products. However, what it will not allow you to do, is use the entire set as a filter — i.e., send all 25 members across as a filter.
Setting up a Named Set filter is similar to the other filters, with the only difference being the Named Set selection screen shown in Figure 19-11.
Custom MDX Filter
A Custom MDX filter gives a very similar capability to the Named Set filter, except that the members of the set are defined in PerformancePoint rather than in Analysis Services. After choosing a data source, you will be presented with a screen, as shown in Figure 19-12, to enter your set — this follows standard set syntax — surrounded by { and }, and separated by commas.
Notice how the names of the members are displayed in Figure 19-13.
Note that filtering individual members, for example, ([Product].[Product Categories].[Subcategory].&[30]*[Date].[Calendar].[Calendar Year].&[2010]) is not supported.


SQL Server Analysis Services Filter
The SQL Server Analysis Services filter is the only SharePoint filter you will use often - all the filters you have used so far this lesson have been PerformancePoint filters. Unlike all of the previous filters, you create this one in the SharePoint web pages, rather than in Dashboard Designer. To do so, add it as a Web Part under the Filters Category, and then edit it to set it up, as shown in Figure 19-14.
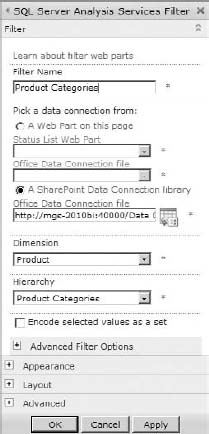
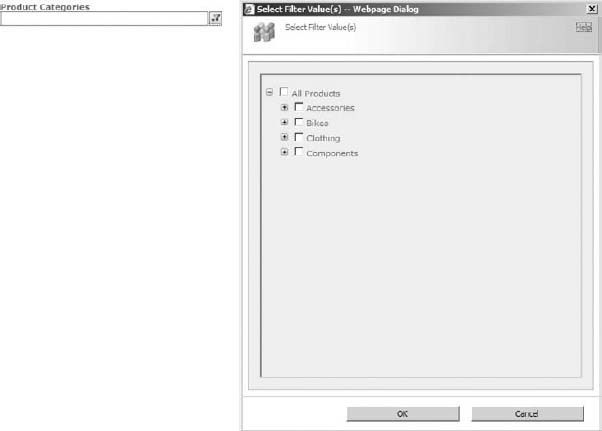
The most common setup for this filter is to browse to an Office Data Connection file in a Data Connection library — this data connection will need to have been set up previously, for example, using Excel. Lesson 12 covers creating an .ODC file for data connections. After selecting a data source, a dimension and hierarchy need to be selected. Figure 19-15 shows the filter on a page.
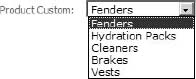
Clicking the Filter button next to the drop-down brings up another drop-down that allows for selecting members — very similar in functionality to the Member Selection filter, but more limited. The real reason to use this filter is in combination with a query string parameter filter, to set the default.
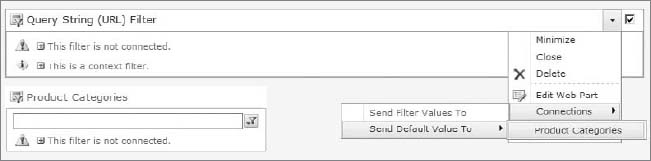
Click Add a Web Part, then add a Query String (URL) Filter under the Filter Category. Configure the web part using the settings in the following table. Figure 19-16 shows what the fully set up Filter should look like.
Query String Filter Settings
| FIELD | VALUE |
| Filter Name | qsProductCategory |
| Query String Parameter Name | qsProductCategory |
| Default Value | [Product].[Product Categories].[Category].&[4] |
| Title | qsProductCategory |
This will set the default to the Accessories member. The Query String Parameter Name is the name to be used in the URL later. Next, connect the Query String Parameter filter to the SQL Server Analysis Services filter, as in Figure 19-17. This means that when no query string parameter is supplied in the URL, the Query String Parameter filter will default to the Accessories member.
To send this default value, you will need to either set up a Summary Links web part, or create a navigation item. You are going to test the filter by manually editing the URL. Stop editing the page, delete everything after .aspx (including the question mark) in the URL, and add the following to the URL at the end: ?qsProductCategory = [Product].[Product Categories].[Category].%26[1]. This will now set the default for the selection box to Bikes, while still letting the user override the value by selecting a different one.

The & (ampersand) needs to be replaced with %26 — also known as URL encoding it — to work correctly.
TRY IT
In this Try It, you add a Time Intelligence filter to the All Periods Analysis Page created in Lesson 18, as well as a Product Category filter.
Lesson Requirements
Create a Time Intelligence filter called TIFilter, using YTD at month level, YTD Last Year at Month Level, MTD at day level, MTD Last Year at day level, last 10 days, and last 10 days Last Year as the formulae.
Create a Member Selection filter called msProductCategory, and auto-select all children of Accessories, Bikes, Clothing, and Components. Set Bikes to be the default, and include the All member.
Add both these filters to the All Periods Analysis Page, and connect TIFilter to the Interactive Scorecard columns, and to Interactive Report using Date.Calendar. Connect msProductCategory to only Interactive Scorecard, and use Page as the connector.
Hints
- Remember that the year to date figures must ignore values lower than day.
- You will need to remove the connection from the scorecard to the chart.
- Remember to map the first of January in this year to the first of January 2008 in your data source.
- The formulae you need for the six TI filter items are:
Formulae
| FORMULA | DISPLAY NAME |
| Year.FirstMonth:Month | YTD |
| (Year−1).FirstMonth:(Year−1).Month | YTD LY |
| Month.FirstDay:Day | MTD |
| (Year−1).Month.FirstDay: (Year−1).Day | MTD LY |
| Day−9:Day | 10 Days |
| (Year−1).Day−9: (Year−1).Day | 10 Days LY |
Step-by-Step
- Open Dashboard Designer by opening up the content created in the previous lesson.
- Right-click the PerformancePoint Content list, and create a new filter.
- Choose Time Intelligence, and click OK.
- Click Add Data Source, select the dsAdventureWorks data source created previously, and click Next.
- Add the formulae defined in the hints, as in Figure 19-18.
- Click Next.
- Choose Tree from the Display Methods and click Finish.
- Name the filter TIFilter, right-click it, and save.
- Right-click the PerformancePoint Content list, and create a new filter.
- Choose Member Selection and click OK.
- Select the dsAdventureWorks data source.
- Click Select Dimension and choose Product.ProductCategories.
- Click Select Members to bring up the screen in Figure 19-19.
- Select All Products, Accessories, Bikes, Clothing, and Components.
- Right-click Accessories and Autoselect Members
 Select Children.
 - Right-click Bikes and Autoselect Members Select Children.
- Right-click Clothing and Autoselect Members Select Children.
- Right-click Components and Autoselect Members Select Children.
- Right-click Bikes and Set as Default Selection.
- Click OK to see the completed screen in Figure 19-20.
- Click Next.
- Choose Multi-Select Tree and click Finish.
- Name the filter msProductCategories, right-click, and save it.
- Go to SharePoint and open the All Periods Analysis page.
- Click Site Action, and click Edit Page.
- Click Add a Web Part in the top web part zone.
- Choose PerformancePoint in Categories, select PerformancePoint Filter, and click Add.
- Click Click Here to Open the Tool Pane to bring up the configuration screen.
- Click the orange button next to the Location textbox, and browse to the TIFilter.
- Change the Title to TI Filter, and the Chrome Type to None, and click OK, as in Figure 19-21.

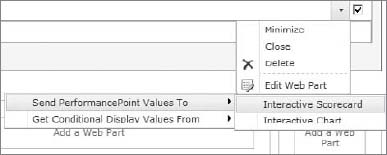
- Click the down arrow to the right of the words TI Filter, and choose Connections Send PerformancePoint Values To Interactive Scorecard, as in Figure 19-22.
- Select Get PerformancePoint Values from the Connection type and click Configure.
- Click Add Connection.
- Select Member Unique Name for Source Value.
- Select Endpoint_Column.
- Click OK.
- Click the down arrow to the right of the words TI Interactive Report, and choose Connections Get PerformancePoint Values From Interactive Scorecard (it will already be ticked).
- Select the row that has Column Member:MemberUniqueName as the source, as in Figure 19-23.
- Click Delete Connection, then click OK.
- Click the down arrow to the right of the words TI Filter, and choose Connections Send PerformancePoint Values To Interactive Report.
- Select Get PerformancePoint Values from the Connection type and click Configure.
- Click Add Connection.
- Select Member Unique Name for Source Value.
- Select [Date].[Calendar] for Connect To, and click OK.
- Click Add a Web Part in the left column above the Interactive Scorecard.
- Choose PerformancePoint in Categories, select PerformancePoint Filter, and click Add.
- Click Click Here to Open the Tool Pane to bring up the configuration screen.
- Click the orange button next to the Location textbox, and browse to the ProductCategories.
- Change the Title to Product Categories, and the Chrome Type to None, and click OK.
- Click the down arrow to the right of the words Product Categories, and choose Connections Send PerformancePoint Values To Interactive Scorecard.
- Select Get PerformancePoint Values from the Connection type and click Configure.
- Click Add Connection.
- Select Member Unique Name for Source Value.
- Select Endpoint_Page to filter all the values.
- Note how the time filter changes both the controls, but the product categories filter only changes the scorecard values, as in Figure 19-24. Also note how the interactivity is lost on the drill-downs on the columns, being overridden on the filter.


The dashboard you have just created is an example of the utility to be found in mixing business intelligence and collaboration content using the SharePoint environment, but it is just an introduction — experiment by adding other collaboration web parts to your dashboards.
Please select Lesson 19 on the DVD to view the video that accompanies this lesson.