
1
Why SharePoint for Business Intelligence?
The question you might be asking yourself is “What can SharePoint do for my Business Intelligence efforts?” In reality you should be asking “How does the new feature set in SharePoint 2010 mesh with the ways my users want to analyze data and improve their understanding of their business operations?”
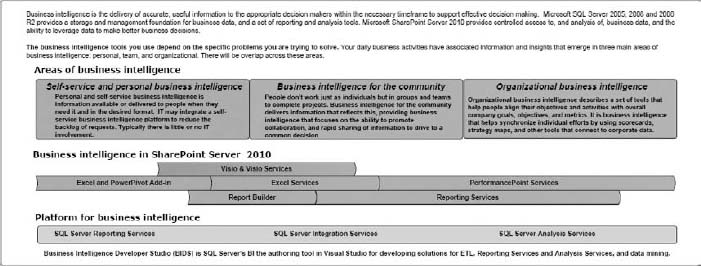
Let's examine that second question. SharePoint 2010 has a plethora of new features, as shown in Figure 1-1. The goal of this lesson is to introduce you to the areas of SharePoint that will catapult your Business Intelligence (BI) capabilities and give you a number of new ways for your users to analyze data, manage that analysis, and customize the delivery to internal and external customers. By helping you identify the questions to ask, and how best to think through the answers, this first lesson will help you recognize how SharePoint will complete your Business Intelligence solution.
Business Intelligence in an organization should be focused on the following:
- Increased insight into business processes
- Presenting data in a form the business users will understand and be able to apply
- Understanding of business performance based on consistent metrics
- Better communication between teams due to a single version of the truth
- Improved meeting efficiency because strong reporting and actionable intelligence drives better organizational focus
KICK START YOUR BUSINESS INTELLIGENCE
To deliver on these objectives you need to examine your organization and your environment and decide where a product like SharePoint would be a good fit. Then identify what area would be the best fit for a prototype. When evaluating a new BI (Business Intelligence) solution or component, it's best to develop a prototype based on a set of data and reports that the business can use to validate and see the improved functionality over what it already has.
If an internal solution is not a good fit, you can consider implementing a solution that solves an existing problem. Since your prototype is using new technology and new processes you want to make sure you assess the risk appropriately. That way you can maximize your ability to impress management and gain adoption of your ideas.
Begin this process by reviewing a list of questions to help you plan your next steps. Important questions to ask include:
- Why types of information do you need to analyze?
- What types of analysis would you like to perform that may be difficult to perform now?
- Are you stuck in summary land without the ability to get the detail data?
- Where does Business Intelligence fit in your industry?
Some good examples of types of analysis depend on the type of industry. Some key industries are analyzed here.
Financial
Financial data is often very structured and comes from a variety of homegrown and industry-leading systems. Much of this analysis is snapshot and transactional, meaning that both point-in-time situations and real-time trends in business demand are important. Many firms need internal financial analysis to tell them how different account bases and books of business are doing. PerformancePoint is great for this because it can provide functionality for the users to go get the information they want and to go in depth and look at the underlying detail.
This capability is really useful to financial staff because they often need to analyze detailed data and look at trends over time. This applies for internal financial staff as well as investment or bank staff. People are not interested in only the summary data but also in the details that make it up. PerformancePoint and Excel Services provide the functionality that power users demand in order to see both summary-level data and provide important powerful visualizations to the customers and internal users.
Retail
Retail data is both significant at summary level and detail level. This is even more so during seasonal fluctuations when detail data is not as important and major decisions can be made with summary level data alone due to volume.
Most retail analysts benefit not only from detailed reporting but also from quick and concise ways to summarize it for presentation and external consumption. This data is often targeted at demographics, product analysis, market basket combinations (who purchased what combinations of items), and sales performance.
This data drives support for hiring, expansion, and stock performance decisions. It also drives product placement and store layout features. Visio Services is a terrific feature to employ to be able to tie data to a floor plan and show success or improvement needed based on estimated goal numbers in the form of a Key Performance Indicator (KPI).
Manufacturing
Manufacturing data is often about performance of a process, down to the individual steps of the process, the outputs of those steps, and the quality of the artifacts being manufactured or produced. Sometimes the waste products of any manufacturing process are more important to analyze than the products themselves. Consumption rates and percentages are common metrics as well. These items all play nicely into both an Excel Services and PowerPivot Analysis because they are usually very detailed and contain large numbers of rows.
PowerPivot for SharePoint 2010 allows you to access and analyze large amounts of data (in the millions of rows), which was previously impossible due to limitations in Excel. You also get to do this right through Excel Services because the Excel Services engine is what renders the PowerPivot workbook in SharePoint. You still get the power of Analysis Services behind the scenes and the exciting new features in Excel 2010, such as slicers and spark lines.
Healthcare
Healthcare data is some of the most disorganized data because it is largely dependent on manual entry from providers' locations. These providers are often paying entry-level workers to enter the data or it is scanned in and given a cursory check. Much of this data is massaged significantly to get it to align and provide value and needs to be handled carefully.
The new security model in SharePoint 2010 and its service applications will deliver a new level of Claims Based Authentication securing data in the most flexible and powerful way yet.
Government
Government data is often very denormalized and comes from a variety of systems. This is largely due to the serious lack of standardization between government organizations. Many government entities spend a significant amount of time just processing the data from other agencies to make sure it is in a form that is useful. Then many of the agencies need to turn around and output it for public consumption. Check out www.data.gov for all the free government data you could wish for. This is a great site for beginning to prototype your own solutions after this book.
Many organizations struggle with analysis in several common areas:
- Be careful about getting stuck in the summary world — Many organizations struggle with being able to drill down into the detail data because they report primarily at the summary or aggregated level.
- Data from different systems does not match up — Many firms store data needed for analysis of a single process across multiple systems in different formats. Business intelligence architecture should bring this data together and set it up for the types of analyses you can do in SharePoint.
- Different groups writing their own versions of the same report — This is the most prolific issue seen out in the world of reporting and Business Intelligence today. Many groups are looking at the same data and calculating things like profitability, turnover, inventory, and other metrics based on their interpretation, leading to inaccurate analysis.
SHAREPOINT FEATURES THAT ENHANCE YOUR BUSINESS
The process of making your business intelligent is not always easy but it starts with a combination of tools and techniques. Some other great texts are available that focus on the techniques for building, loading, and analyzing your data warehouse, so this lesson focuses on how SharePoint 2010 will help you get from just accessing your data to taking action based on what you see.
There are lots of features to highlight but before that, take a look at the characteristics of SharePoint 2010's features that help make your analysis actionable:
- Change analysis on the fly.
- Switch chart types and report formatting in real time.
- Drill though and Decomposition tools.
- Extensive customization capabilities, and many more.
PerformancePoint Services provides much of this functionality through some great features. Some of the features in Figure 1-2 are described in the following list.

- Analytic charts and reports — PerformancePoint Charts and Reports are dynamic and designed to enable the users to change what data points they are analyzing in real time and remove the restriction of typical reports that tie the users to whatever the developer had originally placed in the report.
- Drill-through capabilities — Many BI suites struggle with drilling though to the underlying data. PerformancePoint Services in SharePoint 2010 simplifies this process by enabling this on all analytic content including charts and reports, and so on.
- Analysis Services actions support — Actions in SQL Server Analysis Services are a very powerful way to expand the functionality of analysis provided by a cube in Analysis Services. Many action types are supported in SharePoint 2010 through PerformancePoint and Excel Services.
- Extensive filters — PerformancePoint Dashboards cannot only be changed by contextual filters, but they themselves can be used as filters to drive changes to other items on a page. For example, if you have built a scorecard that trends sales by state and you click on Florida, the rest of the items on the page will now be filtered to show Florida, if you choose.
EXTENDING OFFICE INTO SHAREPOINT
SharePoint 2010 provides a new unparalleled set of methods to integrate Office into your analysis and Business Intelligence. Many of the reports created in a corporation are done in a reporting tool and then immediately exported to Excel. This can lead to delays and folks waiting on data because it needs to be in report format, when all they are going to do is export it directly to Excel.
To combat these delays, many organizations have moved to using Analysis Services to drive data analysis directly through Excel. SharePoint gives us the capability to extend that even further and share those workbooks through the browser with Excel Services. Excel Services is covered in depth later in the book, but this feature has been improved and extended in SharePoint 2010 to provide a new and greater user experience for working with and collaborating on Excel documents and reports. This functionality can be seen in Figure 1-3.

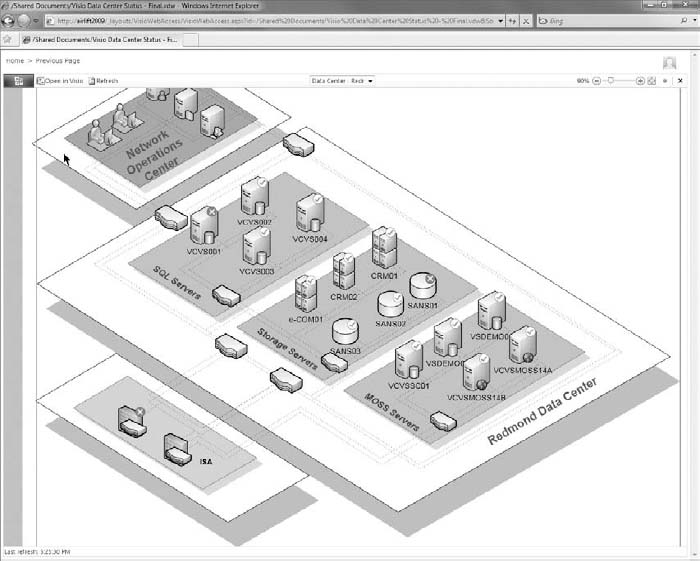
Visio Services is another exciting improvement in this new release of SharePoint. With this comes the ability to create strategy maps and data drive diagrams that combine visually impressive layouts along with KPIs and other performance indicators. These are created with Visio and PerformancePoint Services and can be deployed alone or in a dashboard. These maps can be quite powerful and used for process mapping to data center management, as shown in Figure 1-4.
CUSTOMIZING SHAREPOINT 2010 TO MATCH YOUR COMPANY
Customization options abound in SharePoint 2010 from the extensive options in PerformancePoint to customizing master pages and using CSS to standardize your portal to look just like the rest of an organization's portal. With new features such as improved Web Part pages and cascading style sheet (CSS) support, these environments are now customizable to the point of any other web intranet. The SharePoint pieces really plug in where you want them.
Security and Service Model
The new service model and the security changes to go with it can be a source of confusion for new SharePoint developers. This section will guide you through the ins and outs of how and why this architecture is in place and point you in the right direction to get acquainted with these new features.
New Architecture
SharePoint 2010 has some incredible new architectural features, which are discussed in administrative-level detail in Professional SharePoint 2010 Administration by Todd Klindt, et al (Wiley, 2010). This lesson focuses on the security aspects that will most affect your SharePoint BI experience. The new Secure Store Service is covered in this book along with the Unattended Service Account, but for this intro their primary purpose is to provide encrypted proxy account data access to your data sources without the need to create and manage many accounts for many users.
This new model provides the end users the ability to leverage one of these accounts or to use their own account if different permissions are needed. This works hand-in-hand with the new services architecture that provides for different accounts and application IDs (secured logins) to be used for each service or instance of a particular service. This is very powerful and replaces the less flexible Shared Service Provider functionality in SharePoint 2007. These new services are outlined in Figure 1-5.

TRY IT
In this Try It you review the new features in SharePoint Business Intelligence that were discussed and explore where they might be a great fit for your organization. When you finish this lesson, you should have a good understanding of what areas of your organization would benefit from which features in SharePoint 2010 Business Intelligence. This will put you on your way to delivering the most value in the shortest amount of time.
Lesson Requirements
In this lesson you will be going through the sections and making a list of what features will be the best fit for your organization. You will then list out which areas of your organization are the best fit for which features so you can begin targeting them for prototyping. You will need an installation of SharePoint to review. This could be either in a server environment or locally on a development machine. All the features required will be present in either solution.
Hints
- Focus on your business and how your users look at data. This will drive how you begin to design your environment.
- Review the questions posed earlier in the lesson. These are common starting grounds for this type of analysis.
Step-by-Step
- Think about the different user groups in your organization.
- Put their names in the header columns in an Excel worksheet.
- Make a list of each type of analysis they do underneath their names. Examples would be
- Detailed, Summary, Static Reports, Chart Heavy
- In the adjoining cells, place some notes about the current reports and analysis they are doing and any roadblocks that are slowing them down or causing this process not to work as desired.
- Underneath each analysis type list specific reports that would be good potential candidates for improving with SharePoint BI.
Select a report from your list to begin prototyping in SharePoint and make a list of where the data is. For this example selecting a report with a mature data source would be the best place to start. This would include an Analysis Services cube or data warehouse. These are typically the most straightforward to analyze for new users.
 Please select Lesson 1 on the DVD to view the video that accompanies this lesson.