
21
Developing and Deploying Reporting Services Reports to SharePoint
In previous lessons you have learned how to develop BI solutions, which can then be deployed to SharePoint to be consumed by end users. This lesson focuses on deploying a major piece of the SQL Server Business Intelligence stack, Reporting Services, to SharePoint. Giving end users the ability to view Reporting Services reports from SharePoint completes the SharePoint Business Intelligence puzzle.
Reporting Services without integrating and deploying to SharePoint means end users must go to multiple interfaces to find everything they need for making decisions. With this non-integrated setup it's more likely that the users will choose only one or none of the platforms to view reports.
CREATING A REPORT USING BIDS
Two tools are primarily used for developing Reporting Services reports. The more forward-facing lighter development application is called Report Builder. This tool is not typically used by developers but is instead meant more for power users. Power users are generally people who know the business more than they know the technology but are computer savvy enough to figure out how to design a simple report. With Report Builder a power user can either create a new report or modify an existing one, and simply by clicking Save the report is pushed back to SharePoint.
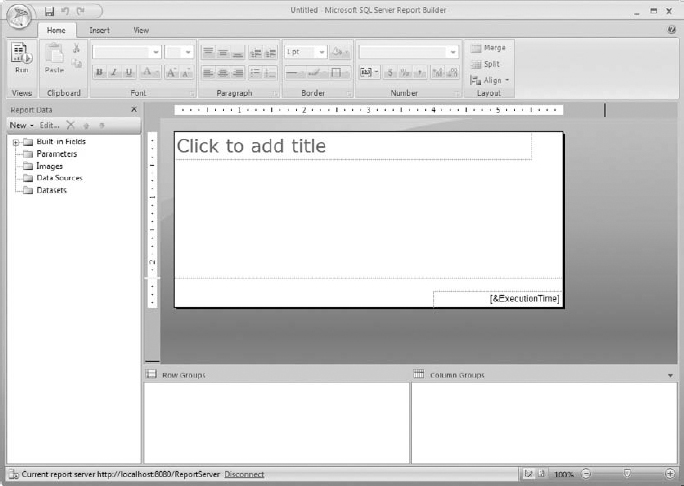
Report Builder was designed with the end user in mind, so much of what you see with this tool will be to get the report author up-and-running as fast as possible. For example, SQL Server 2008 R2 provides a tool called Report Parts, which enables a report developer to save portions of his report to the server. Power users using Report Builder can then consume those Report Parts in their own design without having to understand the original author's source query or layout design. You can open Report Builder from the SharePoint library that stores your reports. It is a client-side tool so if you have never used it before it will be automatically downloaded and installed after selecting the tool from SharePoint. The latest version of the tool is Report Builder 3.0, which has several other great features beyond the scope of this lesson. However, you will notice that Report Builder has the same look and feel as other Office products to make end users more comfortable using it, as shown in Figure 21-1.
The other tool for authoring reports is called Business Intelligence Development Studio (BIDS), which is considered to be a tool for developers because it uses a Visual Studio shell and is more about the details of creating a report rather than quickly getting one up-and-running. BIDS is part of the toolset that can be optionally installed during the installation of SQL Server. Once the program is installed you will find it by navigating to Start ![]() All Programs
All Programs ![]() Microsoft SQL Server 2008 R2
Microsoft SQL Server 2008 R2 ![]() SQL Server Business Intelligence Development Studio.
SQL Server Business Intelligence Development Studio.
To begin, you will need to create a solution and project by selecting File ![]() New
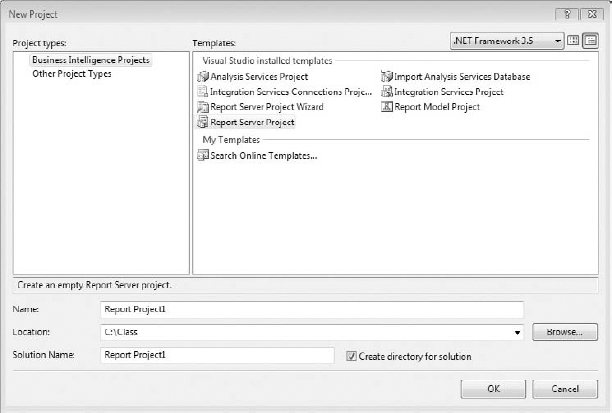
New ![]() Project. Figure 21-2 shows the New Project dialog box where you will define the project type, Report Server Project, for this lesson, and name both the solution and project. The solution organizes multiple projects together to make it easier to find all project-related items at once by opening a single file. Next, which was just mentioned, is a project. Projects are separated by the type of work you are doing. For example, if you are designing reports you will create a Report Server Project, whereas if you're developing a cube you would create an Analysis Services Project.
Project. Figure 21-2 shows the New Project dialog box where you will define the project type, Report Server Project, for this lesson, and name both the solution and project. The solution organizes multiple projects together to make it easier to find all project-related items at once by opening a single file. Next, which was just mentioned, is a project. Projects are separated by the type of work you are doing. For example, if you are designing reports you will create a Report Server Project, whereas if you're developing a cube you would create an Analysis Services Project.
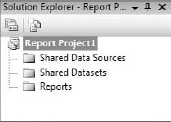
After the project and solution are created you are ready to focus on developing a report. To create a new report, open the Solution Explorer pane by pressing Ctrl+Alt+L. Figure 21-3 shows the Solution Explorer pane after it has been opened. Assuming you are using SQL Server 2008 R2, when you look at the contents of the Solution Explorer you will find the Project: Shared Data Sources, Shared Datasets, and Reports. We discuss each of these objects as we go through the creation of a report using the Report Wizard.
Start the Report Wizard by right-clicking the Reports folder in the Solution Explorer pane and selecting Add New Report. This lesson demonstrates the wizard, but you could optionally create a report without using a wizard by right-clicking the Reports folder and then selecting Add ![]() New Item. Creating a report without the wizard gives you more flexibility with the initial design of the report, but it starts you off with an empty design surface.
New Item. Creating a report without the wizard gives you more flexibility with the initial design of the report, but it starts you off with an empty design surface.
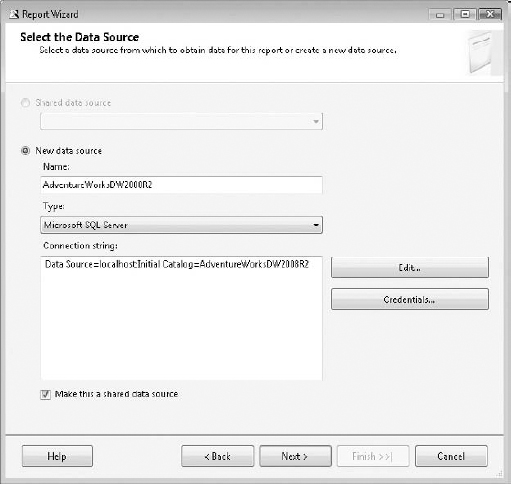
After opening the Report Wizard click Next on the welcome screen, which will bring you to the Select the Data Source screen. Here you will define the connection name, type, and connection string. The name is simply how you would like this connection to be referred to within Reporting Services. The type refers to the type of connection you need for the report data. For example, if your source data for this report is Oracle, you can select it from the Type drop-down box. A connection string is where you will define the how and where you will access the connection type. To define a connection string, click the Edit button and typically, depending on the type of connection, you will provide a server name and database. The last feature of a data source, which is helpful when you have multiple reports that will require the same data source, is the checkbox labeled Make This a Shared Data Source. If you check this box the connection definition is available for reuse in multiple reports and is deployed to the server. Figure 21-4 shows the available properties when defining the data source. After preparing the data source, click Next to define the data set.

On the Design the Query screen you write a query that will return results that will be used in the report design. You can either manually type the query in the Query String box or click the Query Builder button, which will have a mouse-driven way of building a query. The Query Builder is useful when you do not know your source data very well because it provides a graphical way of joining objects and returning fields. The query you provide here must be written in an acceptable language for your data source type. For example, if you have an Analysis Services source type your query language would be MDX, but if you have a SQL Server source type the query language would be TSQL. After writing your query, click Next.
Next you must provide a report type. The two possible report types are Tabular and Matrix as shown in Figure 21-5. A Tabular report is generally a detail-level report, meaning it shows a very low granularity of the data. For example, you would use a Tabular report type to generate a list of all your sales by order. Tabular reports can have groupings but it can only be done on rows. A Matrix report, on the other hand, is intended for aggregating data. It is also different in that it can do grouping on both rows and columns. So a Matrix report may be used to shows product sales by year. The years would be grouped on columns and the products would be grouped on rows. The intersecting point would display the total sales for a particular year for a specific product. The report type you choose will depend on the data that you want to display. Once you have decided on a report type, click Next.

Depending on your selection of the report type the next screen will either say Design a Matrix or Design a Table. This section allows you to place the fields in any section of the report you would like. As you place the fields in the desired locations you will notice that it will highlight that section in a generic report preview. If you have selected a Matrix report type you will see a property on this page called Enable Drilldown in the bottom left of the wizard. Enable Drilldown will be editable only if you have more than one row grouping. When this checkbox is selected your report will automatically have the lowest level of the row grouping collapsed into the higher level. For example, when using the fields Product and Category, you can collapse the Product field into Category so that it is only visible when a user clicks a plus sign (+) next to the Category field value. This gives you a much cleaner report when it is initially rendered by the user. After adding these fields to the desired locations, click Next.
The final screens vary slightly depending on whether you select a Tabular or Matrix report. If you selected a Matrix report type you will provide a style and name for the report to complete the wizard. If you selected Tabular you will have one extra screen called Choose the Table Layout, which allows you to change some minor visualizations as well as adding subtotals or drilldowns. Before clicking Finish to create the report, ensure you have named it appropriately for the report topic area, then check Preview Report in the bottom. This is not the last time you can name the report, so if you need to rename it later simply right-click the report name in the Solution Explorer and select Rename. A final completed report may look like Figure 21-6. Everything done in this section walks you through using the wizard to create a report but you can easily make modifications to what the wizard has produced by changing to the Design tab in the report editor window.

CONFIGURING BIDS FOR SHAREPOINT DEPLOYMENT
Once the report is designed to your satisfaction you are ready to deploy it to SharePoint. If you have ever deployed Reporting Services reports to the more traditional native mode installation, you will find the configuration from BIDS is slightly different.
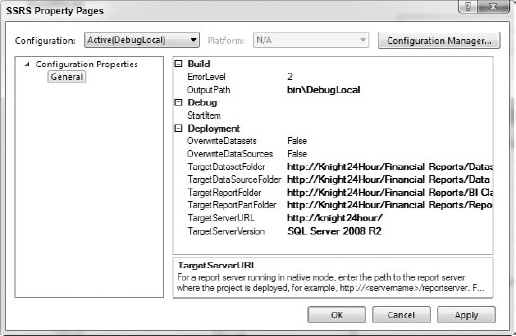
You can find the deployment configuration in the properties of the Report Server project. Open the Solution Explorer pane, right-click the Report Server Project, and select Properties. First, point the TargetServerURL property to the SharePoint URL. Then point the four properties labeled Target above this one to the appropriate library to which you wish to deploy as shown in Figure 21-7.
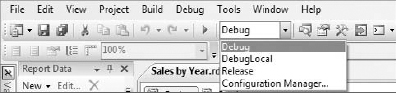
When you have the need to deploy to multiple instances, BIDS has some nice built-in functionality to make it easy to change which instance you are deploying to. As part of the Standard toolbar you will find a drop-down box that is set by default to Debug. You can create multiple settings here so that when you have it set to Debug it will deploy to your development environment, or when it is set to Release it deploys to production. The names of these settings can also be changed when you select Configuration Manager from the same drop-down box.
To use this functionality all you have to do is have the drop-down box set to Debug when you configure deployment to the development environment, then change it to Release and configure the project properties for production. After the configuration is done you can easily toggle back and forth on your deployment settings. Figure 21-8 shows the Debug toolbar.
DEPLOYING A REPORT FROM BIDS TO SHAREPOINT
After configuring the deployment in the Report Server project properties, you are ready to deploy. You can choose to deploy either the entire project or just individual reports. If you decide to deploy individual reports, be aware that the data source must also be deployed for the report to work. When you deploy for the first time, it is best to just deploy the entire project so all shared data sources and shared data sets get deployed to SharePoint. To deploy the project, right-click the project name in the Solution Explorer and select Deploy. If you just want to deploy individual reports, right-click the report name again in the Solution Explorer and select Deploy.
By default, in the properties of the project, the shared data sources and shared data sets will not be overwritten if deployed multiple times. This is important to be aware of because when you make changes to a shared data set the new changes will not overwrite what is on the server by default. If you need to overwrite what has already been deployed previously, right-click the project name in the Solution Explorer and select Properties. Then change either of the properties OverwriteDatasets or OverwriteDataSource to True, which will then allow you to overwrite those objects during deployment.
TRY IT
In this Try It you design a Reporting Services report and then deploy it to a SharePoint library on an existing site.
Lesson Requirements
To complete this lesson you will be required to have SharePoint 2010 and SQL Server 2008 R2 already installed and configured with the Reporting Services add-in for SharePoint. Lesson 10 walks you through this configuration if you have not already completed it. You will also need the AdventureWorksDW2008R2 sample database from www.codeplex.com to follow the report design.
Hints
- Use the Report Wizard to design a report that displays the number of sales made on the Internet by product subcategory and year.
- After creating the report deploy it to an existing SharePoint library you have created from any of the previous lessons.
Step-by-Step
- Open BIDS by navigating to Start
 All Programs Microsoft SQL Server 2008 R2 SQL Server Business Intelligence Development Studio.
 - Create a new Report Server project by selecting File New Project.
- Select Report Server Project, name it Lesson 21, and click OK.
- Open the Solution Explorer (Ctrl+Alt+L) and create a new report.
- Right-click the Reports folder and select Add New Report to open the Report Wizard.
- Click Next on the Welcome screen, which will take you to the Select the Data Source page.
- Create a new data source by providing the name AdventureWorksDW2008R2 and clicking Edit next to the Connection String box to define the connection. This will open the Connection Properties window.
- Type the server name on which you have installed the AdventureWorksDW2008R2 sample database and then select the database from the drop-down list labeled Select or Enter a Database Name. Click OK.
- Click the checkbox called Make This a Shared Data Source as shown in Figure 21-9. Click Next after these steps are completed.
- You are now in the Design the Query page. You could either build a query yourself by selecting Query Builder to graphically write the query or type the TSQL query in the Query String box. Because this lesson is not intended to teach you TSQL you can just write the following query in the Query String box and click Next:
SELECT    DimProductSubcategory.EnglishProductSubcategoryName,
          DimDate.CalendarYear,
          SUM(FactInternetSales.OrderQuantity) AS OrderQuantity
FROM      FactInternetSales INNER JOIN
          DimDate ON FactInternetSales.OrderDateKey = DimDate.DateKey INNER JOIN
          DimProduct ON FactInternetSales.ProductKey = DimProduct.ProductKey
          INNER JOIN
          DimProductSubcategory ON DimProduct.ProductSubcategoryKey =
          DimProductSubcategory.ProductSubcategoryKey
GROUP BY  DimProductSubcategory.EnglishProductSubcategoryName,
          DimDate.CalendarYear
- Select Matrix for the Report Type and click Next.
- On the Design the Matrix page select EnglishProductSubcategoryName and drag it to the Rows section. Also, drag CalendarYear to Columns and OrderQuantity to Details. Figure 21-10 shows this step completed. Once all the available fields are placed click Next.
- Leave the default of Slate for the Matrix Style and click Next again.
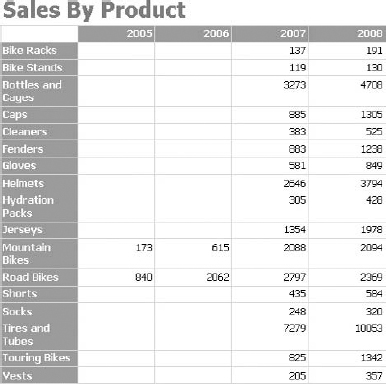
- Name the report Sales by Product and click the Preview Report checkbox to immediately see the report results. Click Finish. The completed report should look like Figure 21-11.
- You are now ready to deploy the completed solution to SharePoint. Right-click the project name Lesson 21 in the Solution Explorer pane and click Properties.
- Change the following information to deploy the reports to SharePoint and click OK:
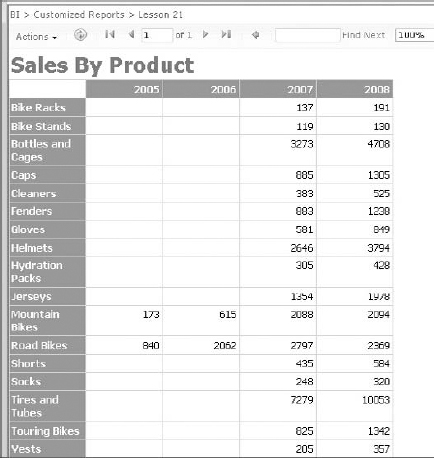
PROPERTY VALUE TargetDatasetFolder http://yourservername/sitename/libraryname/Datasets TargetDataSourceFolder http://yourservername/sitename/libraryname/Data Sources TargetReportFolder http://yourservername/sitename/libraryname/Reports TargetReportPartFolder http://yourservername/sitename/libraryname/Report Parts TargetServerURL http://yourservername/ - Your report should now be deployed. Navigate to the SharePoint site that you just deployed to and see the reports on the server. If you had any issues review step 16 and compare it to the actual URL of the site as it appears in your web browser. Another potential issue that can occur is that the items get deployed but are not connected. If you select a deployed report to SharePoint you can manage the data source and reconnect it. Figure 21-12 shows the report viewable from SharePoint.

Congratulations! You have successfully developed and deployed a Reporting Services report to SharePoint.
 Please select Lesson 21 on the DVD to view the video that accompanies this lesson.