
CHAPTER 3
NOZZLE THEORY AND THERMODYNAMIC RELATIONS
In rocket propulsion systems the mathematical tools needed to calculate performance and to determine several key design parameters involve the principles from gas dynamics and thermodynamics that describe processes inside a rocket nozzle and its chamber. These relations are also used for evaluating and comparing the performance between different rocket systems since with them we can predict operating parameters for any system that uses the thermodynamic gas expansion in a supersonic nozzle; they allow the determination of nozzle size and generic shape for any given performance requirement. This theory applies to chemical rocket propulsion systems (liquid and solid and hybrid propellant types), nuclear rockets, solar‐heated and resistance or arc‐heated electrical rocket systems, and all propulsion systems that use gas expansion as the mechanism for ejecting matter at high velocities.
Fundamental thermodynamic relations are introduced and explained in this chapter. By using these equations, the reader can gain a basic understanding of the thermodynamic processes involved in high‐temperature and/or pressure gas expansions. Some knowledge of both elementary thermodynamics and fluid mechanics on the part of the reader is assumed (see Refs. 3–1 to 3–3). This chapter also addresses different nozzle configurations, nonoptimum performance, energy losses, nozzle alignment, variable thrust, and four different alternate nozzle performance parameters.
3.1 IDEAL ROCKET PROPULSION SYSTEMS
The concept of an ideal rocket propulsion system is useful because the relevant basic thermodynamic principles can be expressed with relatively simple mathematical relationships, as shown in subsequent sections of this chapter. These equations describe quasi‐one‐dimensional nozzle flows, which represent an idealization and simplification of the full two‐ or three‐dimensional equations of real aerothermochemical behavior. However, within the assumptions stated below, these descriptions are very adequate for obtaining useful solutions to many rocket propulsion systems and for preliminary design tasks. In chemical rocket propulsion, measured actual performances turn out to be usually between 1 and 6% below the calculated ideal values. In designing new rocket propulsion systems, it has become accepted practice to use such ideal rocket parameters, which can then be modified by appropriate corrections, such as those discussed in Section 3.5. An ideal rocket propulsion unit is defined as one for which the following assumptions are valid:
- The working fluid (which usually consists of chemical reaction products) is homogeneous in composition.
- All the species of the working fluid are treated as gaseous. Any condensed phases (liquid or solid) add a negligible amount to the total mass.
- The working fluid obeys the perfect gas law.
- There is no heat transfer across any and all gas‐enclosure walls; therefore, the flow is adiabatic.
- There is no appreciable wall friction and all boundary layer effects may be neglected.
- There are no shock waves or other discontinuities within the nozzle flow.
- The propellant flow rate is steady and constant. The expansion of the working fluid is uniform and steady, without gas pulsations or significant turbulence.
- Transient effects (i.e., start‐up and shutdown) are of such short duration that may they be neglected.
- All exhaust gases leaving the rocket nozzles travel with a velocity parallel to the nozzle axis.
- The gas velocity, pressure, temperature, and density are all uniform across any section normal to the nozzle axis.
- Chemical equilibrium is established within the preceding combustion chamber and gas composition does not change in the nozzle (i.e., frozen composition flow).
- Ordinary propellants are stored at ambient temperatures. Cryogenic propellants are at their boiling points.
These assumptions permit the derivation of the relatively compact, quasi‐one‐dimensional set of equations shown in this chapter. Later in this book we present more sophisticated theories and/or introduce correction factors for several of the items on the above list, which then allow for more accurate determinations. The next paragraph explains why the above assumptions normally cause only small errors.
For liquid bipropellant rockets, the idealized situation postulates an injection system in which the fuel and oxidizer mix perfectly so that a homogeneous working medium results; a good rocket injector can closely approach this condition. For solid propellant rocket units, the propellant must essentially be homogeneous and uniform and the burning rate must be steady. For solar‐heated or arc‐heated propulsion systems, it must be assumed that the hot gases can attain a uniform temperature at any cross section and that the flow is steady. Because chamber temperatures are typically high (2500 to 3600 K for common propellants), all gases are well above their respective saturation conditions and do follow closely the perfect gas law. Assumptions 4, 5, and 6 above allow the use of isentropic expansion relations within the rocket nozzle, thereby describing the maximum conversion from heat and pressure to kinetic energy of the jet (this also implies that the nozzle flow is thermodynamically reversible). Wall friction losses are difficult to determine accurately, but they are usually negligible when the inside walls are smooth. Except for very small chambers, the heat losses to the walls of the rocket are usually less than 1% (occasionally up to 2%) of the total energy and can therefore be neglected. Short‐term fluctuations in propellant flow rates and pressures are typically less than 5% of their steady value, small enough to be neglected. In well‐designed supersonic nozzles, the conversion of thermal and/or pressure energy into directed kinetic energy of the exhaust gases may proceed smoothly and without normal shocks or discontinuities—thus, flow expansion losses are generally small.
Some rocket companies and/or some authors do not include all or the same 12 items listed above in their definition of an ideal rocket. For example, instead of assumption 9 (all nozzle exit velocity is axially directed), they use a conical exit nozzle with a 15° half‐angle as their base configuration for the ideal nozzle; this item accounts for the divergence losses, a topic later described in this chapter (using the correction factor λ).
3.2 SUMMARY OF THERMODYNAMIC RELATIONS
In this section we briefly review some of the basic relationships needed for the development of the nozzle flow equations. Rigorous derivations and discussions of these relations can be found in many thermodynamics or fluid dynamics texts, such as Refs. 3–1 to 3–3.
The principle of conservation of energy may be readily applied to the adiabatic, no shaft‐work processes inside the nozzle. Furthermore, in the absence of shocks or friction, flow entropy changes are zero. The concept of enthalpy is most useful in flow systems; the enthalpy h comprises the internal thermal energy plus the flow work (or work performed by the gas of velocity ![]() in crossing a boundary). For ideal gases the enthalpy can conveniently be expressed as the product of the specific heat cp times the absolute temperature T (cp is the specific heat at constant pressure, defined as the partial derivative of the enthalpy with respect to temperature at constant pressure). Under the above assumptions, the total or stagnation enthalpy per unit mass h0 remains constant in nozzle flows, that is,
in crossing a boundary). For ideal gases the enthalpy can conveniently be expressed as the product of the specific heat cp times the absolute temperature T (cp is the specific heat at constant pressure, defined as the partial derivative of the enthalpy with respect to temperature at constant pressure). Under the above assumptions, the total or stagnation enthalpy per unit mass h0 remains constant in nozzle flows, that is,
Other stagnation conditions are introduced later, below Eq. 3–7. The symbol J is the mechanical equivalent of heat which is utilized only when thermal units (i.e., the Btu and calorie) are mixed with mechanical units (i.e., the ft‐lbf and the joule). In SI units (kg, m, sec) the value of J is one. In the EE (English Engineering) system of units the value of the constant J is given in Appendix 1. Conservation of energy applied to isentropic flows between any two nozzle axial sections x and y shows that the decrease in static enthalpy (or thermodynamic content of the flow) appears as an increase of kinetic energy since any changes in potential energy may be neglected.
The principle of conservatism of mass in steady flow, for passages with a single inlet and single outlet, is expressed by equating the mass flow rate ![]() at any section x to that at any other section y; this is known as the mathematical form of the continuity equation. Written in terms of the cross‐sectional area A, the velocity
at any section x to that at any other section y; this is known as the mathematical form of the continuity equation. Written in terms of the cross‐sectional area A, the velocity ![]() , and the “specific volume” V (i.e., the volume divided by the mass within), at any section
, and the “specific volume” V (i.e., the volume divided by the mass within), at any section
The perfect gas law can be written as (at an arbitrary location x)
where the gas constant R is found from the universal gas constant R′ divided by the molecular mass ![]() of the flowing gas mixture. The molecular volume at standard conditions becomes
of the flowing gas mixture. The molecular volume at standard conditions becomes ![]() − mol and it relates to a value of
− mol and it relates to a value of ![]() . We often find Eq. 3–3 written in terms of density ρ which is the reciprocal of the specific volume V. The specific heat at constant pressure cp, the specific heat at constant volume
. We often find Eq. 3–3 written in terms of density ρ which is the reciprocal of the specific volume V. The specific heat at constant pressure cp, the specific heat at constant volume ![]() , and their ratio k are constant for perfect gases over a wide range of temperatures and are related as follows:
, and their ratio k are constant for perfect gases over a wide range of temperatures and are related as follows:
For any isentropic flow process, the following relations may be shown to hold between any two nozzle sections x and y:
During an isentropic expansion the pressure drops substantially, the absolute temperature drops somewhat less, and the specific volume increases. When flows are stopped isentropically the prevailing conditions are known as stagnation conditions which are designated by the subscript 0. Sometimes the word “total” is used instead of stagnation. As can be seen from Eq. 3–1 the stagnation enthalpy consists of the sum of the static or local enthalpy and the fluid kinetic energy. The absolute stagnation temperature T0 is found from this energy equation as
where T is the static absolute fluid temperature. In adiabatic flows, the stagnation temperature remains constant. A useful relationship between the stagnation pressure and the local pressure in isentropic flows can be found from the previous two equations:
When local velocities are close to zero, the corresponding local temperatures and pressures approach the stagnation pressure and stagnation temperature. Inside combustion chambers, where gas velocities are typically small, the local combustion pressure essentially equals the stagnation pressure. Now, the velocity of sound a also known as the acoustic velocity in perfect gases is independent of pressure. It is defined as
In the EE system the units of R must be corrected and a conversion constant gc ≡ g0 must be added – Equation 3–10 becomes ![]() . This correction factor allows for the proper velocity units. The Mach number M is a dimensionless flow parameter and is used to locally define the ratio of the flow velocity
. This correction factor allows for the proper velocity units. The Mach number M is a dimensionless flow parameter and is used to locally define the ratio of the flow velocity ![]() to the local acoustic velocity a:
to the local acoustic velocity a:
Hence, Mach numbers less than one correspond to subsonic flows and greater than one to supersonic flows. Flows moving at precisely the velocity of sound would have Mach numbers equal to one. It is shown later that at the throat of all one‐dimensional supersonic nozzles the Mach number must be equal to one. The relation between stagnation temperature and Mach number may now be written from Eqs. 3–7, and 3–10 as
or

T0 and p0 designate the temperature and pressure stagnation values. Unlike the temperature, the stagnation pressure during an adiabatic nozzle expansion only remains constant for totally isentropic flows (i.e., no losses of any kind). It may be computed from
The nozzle area ratio for isentropic flow may now be expressed in terms of Mach numbers for two arbitrary locations x and y within the nozzle. Such a relationship is plotted in Fig. 3–1 for ![]() , where
, where ![]() the throat or minimum area, along with corresponding ratios for T/T0 and p/p0. In general,
the throat or minimum area, along with corresponding ratios for T/T0 and p/p0. In general,


Figure 3–1 Relationship of area ratio, pressure ratio, and temperature ratio as functions of Mach number in a converging/diverging nozzle depicted for the subsonic and supersonic nozzle regions.
As can be seen from Fig. 3–1, for subsonic flows any chamber contraction (from station ![]() ) or nozzle entrance ratio A1/At can remain small, with values approaching 3 to 6 depending on flow Mach number, and the passage is convergent. There are no noticeable effects from variations of k. In solid rocket motors the chamber area A1 refers to the flow passage or port cavity in the virgin grain. With supersonic flow the nozzle section diverges and the area ratio enlarges rather quickly; area ratios are significantly influenced by the value of k. At
) or nozzle entrance ratio A1/At can remain small, with values approaching 3 to 6 depending on flow Mach number, and the passage is convergent. There are no noticeable effects from variations of k. In solid rocket motors the chamber area A1 refers to the flow passage or port cavity in the virgin grain. With supersonic flow the nozzle section diverges and the area ratio enlarges rather quickly; area ratios are significantly influenced by the value of k. At ![]() the exit area ratio A2/At ranges between 15 and 30, depending on the value of k indicated. On the other hand, pressure ratios are less sensitive to k but temperature ratios show more variation.
the exit area ratio A2/At ranges between 15 and 30, depending on the value of k indicated. On the other hand, pressure ratios are less sensitive to k but temperature ratios show more variation.
The average molecular mass ![]() of a mixture of gases is the sum of all chemical species' ni in kg‐mols multiplied by their molecular mass
of a mixture of gases is the sum of all chemical species' ni in kg‐mols multiplied by their molecular mass ![]() and then divided by the sum of all molar masses. This is further discussed in Chapter 5, Eq. 5–5. The symbol
and then divided by the sum of all molar masses. This is further discussed in Chapter 5, Eq. 5–5. The symbol ![]() has been used to avoid confusion with M for the Mach number. In the older literature
has been used to avoid confusion with M for the Mach number. In the older literature ![]() is called the molecular weight.
is called the molecular weight.
3.3 ISENTROPIC FLOW THROUGH NOZZLES
Within converging–diverging nozzles a large fraction of the thermal energy of the gases flowing from the chamber is converted into kinetic energy. As will be shown, gas pressures and temperatures may drop dramatically and gas velocities can reach values in excess of 2 miles per second. This expansion is taken as a reversible or isentropic flow process in the analyses described here. When a nozzle's inner wall has a flow obstruction or a wall protrusion (a piece of weld splatter or slag), then the gas kinetic energy is locally converted back into thermal energy essentially recovering the stagnation temperature and stagnation pressure in the chamber. Since this would quickly lead to local material overheating and wall failure, all nozzle inner walls must be smooth without any protrusions. Stagnation conditions can also occur at the leading edge of a jet vane (described in Chapter 18) or at the tip of a gas sampling tube inserted into the flow.
Velocity
The nozzle exit velocity (at ![]() )
) ![]() can be solved for from Eq. 3–2:
can be solved for from Eq. 3–2:
As stated, this relation strictly applies when there are no heat losses. This equation also holds between any two locations within the nozzle, but hereafter subscripts 1 and 2 will only designate nozzle inlet and exit conditions. For constant k the above expression may be rewritten with the aid of Eqs. 3–6 and 3–7:

When the chamber cross section is large compared the nozzle throat, the chamber velocity or nozzle entrance velocity is comparatively small and the term ![]() may be neglected above. The chamber temperature T1, which is located at the nozzle inlet, under isentropic conditions differs little from the stagnation temperature or (for chemical rocket propulsion) from the combustion temperature T0. Hence we arrive at important equivalent simplified expressions of the velocity
may be neglected above. The chamber temperature T1, which is located at the nozzle inlet, under isentropic conditions differs little from the stagnation temperature or (for chemical rocket propulsion) from the combustion temperature T0. Hence we arrive at important equivalent simplified expressions of the velocity ![]() , ones commonly used for analysis:
, ones commonly used for analysis:

As can be seen above, the gas velocity exhausting from an ideal nozzle is a function of the prevailing pressure ratio p1/p2, the ratio of specific heats k, and the absolute temperature at the nozzle inlet T1, as well as of the gas constant R. Because the gas constant for any particular gas is inversely proportional to the molecular mass ![]() , exhaust velocities or their corresponding specific impulses strongly depend on the ratio of the absolute nozzle entrance temperature (which is close to T0) divided by the average molecular mass of the exhaust gases, as is shown in Fig. 3–2. The fraction T0/
, exhaust velocities or their corresponding specific impulses strongly depend on the ratio of the absolute nozzle entrance temperature (which is close to T0) divided by the average molecular mass of the exhaust gases, as is shown in Fig. 3–2. The fraction T0/![]() plays an important role in optimizing the mixture ratio (oxidizer to fuel flow) in chemical rocket propulsion defined in Eq. 6–1.
plays an important role in optimizing the mixture ratio (oxidizer to fuel flow) in chemical rocket propulsion defined in Eq. 6–1.

Figure 3–2 Specific impulse and exhaust velocity of an ideal rocket propulsion unit at optimum nozzle expansion as functions of the absolute chamber gas temperature T1 and the molecular mass  for several values of k and p1/p2.
Equations 2–13 and 2–16 give relations between the thrust F and the velocities ![]() and c, and the corresponding specific impulse Is which is plotted in Fig. 3–2 for two pressure ratios and three values of k. Equation 3–16 clearly shows that any increase in entrance gas temperatures (arising from increases in chamber energy releases) and/or any decrease of propellant molecular mass (commonly achieved from using low molecular mass gas mixtures rich in hydrogen) will enhance the ratio T0/
and c, and the corresponding specific impulse Is which is plotted in Fig. 3–2 for two pressure ratios and three values of k. Equation 3–16 clearly shows that any increase in entrance gas temperatures (arising from increases in chamber energy releases) and/or any decrease of propellant molecular mass (commonly achieved from using low molecular mass gas mixtures rich in hydrogen) will enhance the ratio T0/![]() ; that is, they will increase the specific impulse Is through increases in the exhaust velocity
; that is, they will increase the specific impulse Is through increases in the exhaust velocity ![]() and, thus, the performance of the rocket vehicle. Influences of pressure ratio across the nozzle p1/p2 and of specific heat ratio k are less pronounced. As can be seen from Fig. 3–2, performance does increase with an increase of the pressure ratio; this ratio increases when the value of the chamber pressure p1 rises and/or when the exit pressure p2 decreases, corresponding to high altitude designs. The small influence of k values is fortuitous because low molecular masses, found in many diatomic and monatomic gases, correspond to the higher values of k.
and, thus, the performance of the rocket vehicle. Influences of pressure ratio across the nozzle p1/p2 and of specific heat ratio k are less pronounced. As can be seen from Fig. 3–2, performance does increase with an increase of the pressure ratio; this ratio increases when the value of the chamber pressure p1 rises and/or when the exit pressure p2 decreases, corresponding to high altitude designs. The small influence of k values is fortuitous because low molecular masses, found in many diatomic and monatomic gases, correspond to the higher values of k.
Values of the pressure ratio must be standardized when comparing specific impulses from one rocket propulsion system to another or for evaluating the influence of various design parameters. Presently, a chamber pressure of 1000 psia (6.894 MPa) and an exit pressure of 1 atm (0.1013 MPa) are used as standard reference for such comparisons, or ![]() .
.
For optimum expansion ![]() and the effective exhaust velocity c (Eq. 2–15) and the ideal rocket exhaust velocity
and the effective exhaust velocity c (Eq. 2–15) and the ideal rocket exhaust velocity ![]() become equal, namely,
become equal, namely,
Thus, here c can be substituted for ![]() in Eqs. 3.–15 and 3–16. For a fixed nozzle exit area ratio, and constant chamber pressure, this optimum condition occurs only at the particular altitude where the ambient pressure p3 just equals the nozzle exhaust pressure p2. At all other altitudes
in Eqs. 3.–15 and 3–16. For a fixed nozzle exit area ratio, and constant chamber pressure, this optimum condition occurs only at the particular altitude where the ambient pressure p3 just equals the nozzle exhaust pressure p2. At all other altitudes ![]() .
.
The maximum theoretical value of nozzle outlet velocity is reached with an infinite nozzle expansion (when exhausting into a vacuum):
This maximum theoretical exhaust velocity is finite, even though the pressure ratio is not, because it corresponds to finite thermal energy contents in the fluid. In reality, such an expansion cannot occur because, among other things, the temperature of most gas species will eventually fall below their liquefaction or their freezing points; thus, they cease to be a gas and can no longer contribute to the expansion or to any further velocity increases.
A number of interesting deductions can be made from this example. Very high gas velocities (over 1 km/sec) can be obtained in rocket nozzles. The temperature drop of the combustion gases flowing through a rocket nozzle can be appreciable. In the example above the temperature changed 1115 °C in a relatively short distance. This should not be surprising, for the increase in the kinetic energy of the gases comes from a decrease of the enthalpy, which in turn is roughly proportional to the decrease in temperature. Because the exhaust gases are still relatively hot (1107 K) when leaving the nozzle, they contain considerable thermal energy which is not available for conversion because it is seldom realistic to match exit and ambient temperatures, (see Fig. 2–2).
Nozzle Flow and Throat Condition
Supersonic nozzles (often called De Laval nozzles after their inventor) always consist of a convergent section leading to a minimum area followed by a divergent section. From the continuity equation, this area is inversely proportional to the ratio ![]() /V. This quantity has also been shown in Fig. 3–3, where there is a maximum in the curve of
/V. This quantity has also been shown in Fig. 3–3, where there is a maximum in the curve of ![]() /V because at first the velocity increases at a greater rate than the specific volume; however, in the divergent section, the specific volume increases faster.
/V because at first the velocity increases at a greater rate than the specific volume; however, in the divergent section, the specific volume increases faster.
The minimum nozzle cross‐sectional area is commonly referred to as the throat area At. The ratio of the nozzle exit area A2 to the throat area At is called the nozzle expansion area ratio and is designated here by the Greek letter ε. It represents an important nozzle parameter:
The maximum gas flow rate per unit area occurs at the throat where a unique gas pressure ratio exists, which is only a function of the ratio of specific heats k. This pressure ratio is found by setting ![]() in Eq. 3–13:
in Eq. 3–13:
The throat pressure pt for which an isentropic mass flow rate attains its maximum is called the critical pressure. Typical values of the above critical pressure ratio range between 0.53 and 0.57 of the nozzle inlet pressure. The flow through a specified rocket nozzle with a given inlet condition is less than the maximum if the pressure ratio is larger than that given by Eq. 3–20. However, note that this ratio is not the value across the entire nozzle and that the maximum flow or choking condition (explained below) is always established internally at the throat and not at the exit plane. The nozzle inlet pressure is usually very close to the chamber stagnation pressure, except in narrow combustion chambers where there is an appreciable drop in pressure from the injector region to the nozzle entrance region. This is discussed in Section 3.5. At the location of critical pressure, namely the throat, the Mach number is always one and the values of the specific volume and temperature can be obtained from Eqs. 3–7 and 3–12:
In Eq. 3–22 the nozzle inlet temperature T1 is typically very close to the combustion chamber temperature and hence close to the nozzle flow stagnation temperature T0. At the throat there can only be a small variation for these properties. Take, for example, a gas with ![]() ; the critical pressure ratio is about 0.56 (which means that pt is a little more than half of the chamber pressure p1; the temperature drops only slightly (
; the critical pressure ratio is about 0.56 (which means that pt is a little more than half of the chamber pressure p1; the temperature drops only slightly (![]() ), and the specific volume expands by over 60% (
), and the specific volume expands by over 60% (![]() ). Now, from Eqs. 3–15, 3–20, and 3–32, the critical or throat velocity
). Now, from Eqs. 3–15, 3–20, and 3–32, the critical or throat velocity ![]() is obtained:
is obtained:
The first version of this equation permits the critical velocity to be calculated directly from the nozzle inlet conditions and the second one gives ![]() when throat temperature is known. The throat is the only nozzle section where the flow velocity is also the local sonic velocity (
when throat temperature is known. The throat is the only nozzle section where the flow velocity is also the local sonic velocity (![]() because
because ![]() ). The inlet flow from the chamber is subsonic and downstream of the nozzle throat it is supersonic. The divergent portion of the nozzle provides for further decreases in pressure and increases in velocity under supersonic conditions. If the nozzle is cut off at the throat section, the exit gas velocity is sonic and the flow rate per unit area will remain its maximum. Sonic and supersonic flow conditions can only be attained when the critical pressure prevails at the throat, that is, when p2/p1 is equal to or less than the quantity defined by Eq. 3–20. There are, therefore, three basically different types of nozzles: subsonic, sonic, and supersonic, and these are described in Table 3–1.
). The inlet flow from the chamber is subsonic and downstream of the nozzle throat it is supersonic. The divergent portion of the nozzle provides for further decreases in pressure and increases in velocity under supersonic conditions. If the nozzle is cut off at the throat section, the exit gas velocity is sonic and the flow rate per unit area will remain its maximum. Sonic and supersonic flow conditions can only be attained when the critical pressure prevails at the throat, that is, when p2/p1 is equal to or less than the quantity defined by Eq. 3–20. There are, therefore, three basically different types of nozzles: subsonic, sonic, and supersonic, and these are described in Table 3–1.
Table 3–1 Nozzle Types
| Subsonic | Sonic | Supersonic | |
| Throat velocity | |||
| Exit velocity | |||
| Mach number | M2 < 1 | M2 > 1 | |
| Pressure ratio | |||
| Shape |  |
 |
 |
The supersonic nozzle is the only one of interest for rocket propulsion systems. It achieves a high degree of conversion of enthalpy to kinetic energy. The ratio between the inlet and exit pressures in all rocket propulsion systems must be designed sufficiently large to induce supersonic flow. Only when the absolute chamber pressure drops below approximately 1.78 atm will there be subsonic flow in the divergent portion of any nozzle during sea‐level operation. This pressure condition actually occurs for very short times during start and stop transients.
The velocity of sound, a, is the propagation speed of an elastic pressure wave within the medium, sound being an infinitesimal pressure wave. If, therefore, sonic velocity is reached at any location within a steady flow system, it is impossible for pressure disturbances to travel upstream past that location. Thus, any partial obstruction or disturbance of the flow downstream of a nozzle throat running critical has no influence on the throat or upstream of it, provided that the disturbance does not raise the downstream pressure above its critical value. It is not possible to increase the sonic velocity at the throat or the flow rate in a fixed configuration nozzle by further lowering the exit pressure or even evacuating the exhaust section. This important condition has been described as choking the flow, which is always established at the throat (and not at the nozzle exit or any other plane). Choked mass flow rates through the critical section of a supersonic nozzle may be derived from Eqs. 3–3, 3–21, and 3–23. From continuity, ![]() always equals to the mass flow at any other cross section within the nozzle for steady flow.
always equals to the mass flow at any other cross section within the nozzle for steady flow.

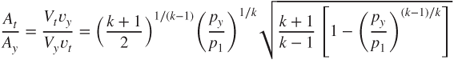
The (chocked) mass flow through a rocket nozzle is therefore proportional to the throat area At and the chamber (stagnation) pressure p1; it is also inversely proportional to the square root of ![]() as well as a function of other gas properties. For supersonic nozzles the ratio between the throat and any downstream area at which a pressure py prevails can be expressed as a function of pressure ratios and the ratio of specific heats, by using Eqs. 3–4, 3–16, 3–21, and 3–23, as follows:
as well as a function of other gas properties. For supersonic nozzles the ratio between the throat and any downstream area at which a pressure py prevails can be expressed as a function of pressure ratios and the ratio of specific heats, by using Eqs. 3–4, 3–16, 3–21, and 3–23, as follows:
When ![]() , then
, then ![]() and Eq. 3–25 shows the inverse nozzle exit area expansion ratio. For low‐altitude operation (sea level to about 10,000 m) nozzle area ratios are typically between 3 and 30, depending on chamber pressure, propellant combinations, and vehicle envelope constraints. For high altitudes (100 km or higher) area ratios are typically between 40 and 200, but there have been some as high as 400. Similarly, an expression for the ratio of the velocity at any point downstream of the throat with a pressure py to the throat velocity may be written from Eqs. 3–15 and 3–23 as:
and Eq. 3–25 shows the inverse nozzle exit area expansion ratio. For low‐altitude operation (sea level to about 10,000 m) nozzle area ratios are typically between 3 and 30, depending on chamber pressure, propellant combinations, and vehicle envelope constraints. For high altitudes (100 km or higher) area ratios are typically between 40 and 200, but there have been some as high as 400. Similarly, an expression for the ratio of the velocity at any point downstream of the throat with a pressure py to the throat velocity may be written from Eqs. 3–15 and 3–23 as:

Note that Eq. 3–26 is dimensionless but does not represent a Mach number. Equations 3–25 and 3–26 permit direct determination of the velocity ratio or the area ratio for any given pressure ratio, and vice versa, in ideal rocket nozzles. They both are plotted in Fig. 3–4. When ![]() , Eq. 3–26 describes the velocity ratio between the nozzle exit area and the throat section. When the exit pressure coincides with the atmospheric pressure (
, Eq. 3–26 describes the velocity ratio between the nozzle exit area and the throat section. When the exit pressure coincides with the atmospheric pressure (![]() , see Fig. 2–1), these equations apply to optimum nozzle expansions. For rockets that operate at high altitudes, it can be shown that not much additional exhaust velocity may be gained by increasing the area ratio above 1000. In addition, design difficulties and a heavy inert nozzle mass have made applications above area ratios of about 350 marginal.
, see Fig. 2–1), these equations apply to optimum nozzle expansions. For rockets that operate at high altitudes, it can be shown that not much additional exhaust velocity may be gained by increasing the area ratio above 1000. In addition, design difficulties and a heavy inert nozzle mass have made applications above area ratios of about 350 marginal.

Figure 3–4 Area and velocity ratios as function of pressure ratio for the diverging section of a supersonic nozzle.
Appendix 2 is a table of several properties of the Earth's atmosphere with established standard values. It gives ambient pressure for different altitudes. These properties do vary somewhat from day to day (primarily because of solar activity) and between hemispheres. For example, the density of the atmosphere at altitudes between 200 and 3000 km can change by more than an order of magnitude, affecting satellite drag estimates.
Thrust and Thrust Coefficient
As already stated, the efflux of propellant gases (i.e., their momentum flowing out) causes thrust—a reaction force on the rocket structure. Because this flow is supersonic, the pressure at the exit plane of the nozzle may differ from the ambient pressure, and a pressure component in the thrust equation adds (or subtracts) to the momentum thrust as given by Eq. 2–13, which is repeated here:
Maximum thrust for any given nozzle operation is found in a vacuum where ![]() . Between sea level and the vacuum of space, Eq. 2–13 gives the variation of thrust with altitude, applying the properties of the atmosphere as listed in Appendix 2. A typical variation of thrust with altitude from a chocked nozzle would be represented by a smooth increase curving to an asymptotic value (see Example 2–2). To modify values calculated for the optimum operating condition (
. Between sea level and the vacuum of space, Eq. 2–13 gives the variation of thrust with altitude, applying the properties of the atmosphere as listed in Appendix 2. A typical variation of thrust with altitude from a chocked nozzle would be represented by a smooth increase curving to an asymptotic value (see Example 2–2). To modify values calculated for the optimum operating condition (![]() ), for other conditions of p1, k, and
), for other conditions of p1, k, and ![]() , the following expressions may be used. For the thrust,
, the following expressions may be used. For the thrust,
For the specific impulse, using Eqs. 2–5, 2–17, and 2–13,
When, for example, the specific impulse at a new exit pressure p2 corresponding to a new area ratio A2/At is to be calculated, the above relations may be used.
Equation 2–13 can be modified by substituting ![]() ,
, ![]() , and Vt from Eqs. 3–16, 3–21, and 3–23:
, and Vt from Eqs. 3–16, 3–21, and 3–23:

The first version of this equation is general and applies to the gas expansion of all rocket propulsion systems, the second form applies to an ideal rocket propulsion system with k being constant throughout the expansion process. This equation shows that thrust is proportional to the throat area At and the chamber pressure (or the nozzle inlet pressure) p1 and is a function of the pressure ratio across the nozzle p1/p2, the specific heat ratio k, and of the pressure thrust. Equation 3–29 is called the ideal thrust equation. A thrust coefficient CF may now defined as the thrust divided by the chamber pressure p1 and the throat area At. Equation 3–30 then results:

The thrust coefficient CF is dimensionless. It is a key parameter for analysis and depends on the gas property k, the nozzle area ratio ε, and the pressure ratio across the nozzle p1/p2, but is not directly dependent on chamber temperature. For any fixed ratio p1/p3, the thrust coefficient CF and the thrust F have a peak when ![]() as area ratio
as area ratio ![]() varies. This peak value is known as the optimum thrust coefficient and is an important criterion in nozzle designs. The introduction of the thrust coefficient permits the following form of Eq. 3–29:
varies. This peak value is known as the optimum thrust coefficient and is an important criterion in nozzle designs. The introduction of the thrust coefficient permits the following form of Eq. 3–29:
Equation 3–31 may be solved for CF to experimentally determine thrust coefficient from measured values of chamber pressure, throat diameter, and thrust. Even though the thrust coefficient is a function of chamber pressure, it is not simply proportional to p1, as can be seen from Eq. 3–30. However, it is directly proportional to throat area. Thrust coefficient has values ranging from just under 1.0 to roughly 2.0. Thrust coefficient may be thought of as representing the amplification of thrust due to the gas expansion in the supersonic nozzle as compared to the thrust that would be exerted if the chamber pressure acted over the throat area only. It is a convenient parameter for visualizing effects of chamber pressure and/or altitude variations in a given nozzle configuration, or for modifying sea‐level results to flight altitude conditions.
Figure 3–5 shows variations of the optimum expansion thrust coefficient (![]() ) with pressure ratio p1/p2, for different values of k and area ratio ε. Complete thrust coefficient variations for
) with pressure ratio p1/p2, for different values of k and area ratio ε. Complete thrust coefficient variations for ![]() and 1.30 are plotted in Figs. 3–6 and 3–7 as a function of pressure ratio p1/p3 and area ratio ε. These sets of curves are very useful in examining various nozzle problems for they permit the evaluation of under‐ and overexpanded nozzle operation, as explained below. The values given in these figures are ideal and do not consider such losses as divergence, friction, or internal expansion waves.
and 1.30 are plotted in Figs. 3–6 and 3–7 as a function of pressure ratio p1/p3 and area ratio ε. These sets of curves are very useful in examining various nozzle problems for they permit the evaluation of under‐ and overexpanded nozzle operation, as explained below. The values given in these figures are ideal and do not consider such losses as divergence, friction, or internal expansion waves.

Figure 3–5 Thrust coefficient CF as a function of pressure ratio, nozzle area ratio, and specific heat ratio for optimum expansion conditions ( ).
).

Figure 3–6 Thrust coefficient CF versus nozzle area ratio for  .
.
When p1/p3 becomes very large (e.g., expansions into near vacuum), the thrust coefficient approaches an asymptotic maximum as shown for ![]() and 1.30 in Figs. 3–6 and 3–7. These figures also give values of CF for some mismatched nozzle conditions (
and 1.30 in Figs. 3–6 and 3–7. These figures also give values of CF for some mismatched nozzle conditions (![]() ), provided the nozzle is flowing full at all times (the working fluid does not separate or break away from the nozzle walls). Flow separation is discussed later in this section.
), provided the nozzle is flowing full at all times (the working fluid does not separate or break away from the nozzle walls). Flow separation is discussed later in this section.

Figure 3–7 Thrust coefficient CF versus nozzle area ratio for  .
.
Characteristic Velocity and Specific Impulse
The characteristic velocity ![]() was defined by Eq. 2–17. From Eqs. 3–24 and 3–31, it can be shown that
was defined by Eq. 2–17. From Eqs. 3–24 and 3–31, it can be shown that

This velocity is only a function of propellant characteristics and combustion chamber properties, independent of nozzle characteristics. Thus, it can be used as a figure of merit when comparing different propellant combinations for combustion chamber performance. The first version of this equation applies in general and allows determination of ![]() from experimental values of
from experimental values of ![]() , and At. The last version gives the ideal value of
, and At. The last version gives the ideal value of ![]() as a function of working gas properties, namely k, chamber temperature, and effective molecular mass
as a function of working gas properties, namely k, chamber temperature, and effective molecular mass ![]() , determined from theory as presented in Chapter 5; some values of
, determined from theory as presented in Chapter 5; some values of ![]() are shown in Tables 5–5 and 5–6.
are shown in Tables 5–5 and 5–6.
The term ![]() ‐efficiency can be used to express the degree of completion of chemical energy releases in the generation of high‐temperature, high‐pressure gases in combustion chambers. It is the ratio of the actual value of
‐efficiency can be used to express the degree of completion of chemical energy releases in the generation of high‐temperature, high‐pressure gases in combustion chambers. It is the ratio of the actual value of ![]() , as determined from measurements (the first part of Eq. 3–32), to the theoretical value (last part of Eq. 3–32) and has typical values between 92 and 99.5%.
, as determined from measurements (the first part of Eq. 3–32), to the theoretical value (last part of Eq. 3–32) and has typical values between 92 and 99.5%.
Combining now Eqs. 3–31 and 3–32 allows to express the thrust itself as the mass flow rate (![]() ) times a function of combustion chamber parameters (
) times a function of combustion chamber parameters (![]() ) times a function of nozzle expansion parameters (CF), namely,
) times a function of nozzle expansion parameters (CF), namely,
Some authors use a term called the discharge coefficient CD, which is merely the reciprocal of ![]() . Both CD and the characteristic exhaust velocity
. Both CD and the characteristic exhaust velocity ![]() can be used only with chemical rocket propulsion systems.
can be used only with chemical rocket propulsion systems.
The influence of variations in the specific heat ratio k on various quantities (such as c, ![]() A2/At,
A2/At, ![]() /
/![]() , or Is) is not as large as those from changes in chamber temperature, pressure ratio, or molecular mass. Nevertheless, they are a noticeable factor, as can be seen by examining Figs. 3–2 and 3–4 to 3–7. The value of k is 1.67 for monatomic gases such as helium and argon, 1.4 for cold diatomic gases such as hydrogen, oxygen, and nitrogen, and for triatomic and beyond it varies between 1.1 and 1.3 (methane is 1.11 and ammonia and carbon dioxide 1.33), see Table 7–3. In general, the more complex the molecule the lower the value of k; this is also true for molecules at high temperatures when their vibrational modes have been activated. Average values of k and
, or Is) is not as large as those from changes in chamber temperature, pressure ratio, or molecular mass. Nevertheless, they are a noticeable factor, as can be seen by examining Figs. 3–2 and 3–4 to 3–7. The value of k is 1.67 for monatomic gases such as helium and argon, 1.4 for cold diatomic gases such as hydrogen, oxygen, and nitrogen, and for triatomic and beyond it varies between 1.1 and 1.3 (methane is 1.11 and ammonia and carbon dioxide 1.33), see Table 7–3. In general, the more complex the molecule the lower the value of k; this is also true for molecules at high temperatures when their vibrational modes have been activated. Average values of k and ![]() for typical rocket exhaust gases with several constituents depend strongly on the composition of the products of combustion (chemical constituents and concentrations), as explained in Chapter 5. Values of k and
for typical rocket exhaust gases with several constituents depend strongly on the composition of the products of combustion (chemical constituents and concentrations), as explained in Chapter 5. Values of k and ![]() are given in Tables 5–4, 5–5, and 5–6.
are given in Tables 5–4, 5–5, and 5–6.
Under‐ and Overexpanded Nozzles
An underexpanded nozzle discharges the gases at an exit pressure greater than the external pressure because its exit area is too small for an optimum expansion. Gas expansion is therefore incomplete within the nozzle, and further expansion will take place outside of the nozzle exit because the nozzle exit pressure is higher than the local atmospheric pressure.
In an overexpanded nozzle the gas exits at lower pressure than the atmosphere as it has a discharge area too large for optimum. The phenomenon of overexpansion inside a supersonic nozzle is indicated schematically in Fig. 3–8, from typical early pressure measurements of superheated steam along the nozzle axis and different back pressures or pressure ratios. Curve AB shows the variation of pressure with optimum back pressure fully corresponding to the nozzle area ratio. Curves AC to AH show pressure variations along the axis for increasingly higher external pressures. The expansion within the nozzle proceeds normally along its initial portion but, for example, at any location after I on curve AD the pressure is lower than the exit pressure and a sudden rise in pressure takes place that is accompanied by separation of the flow from the walls (separation is described later in this chapter).

Figure 3–8 Distribution of pressures in a converging–diverging nozzle for different flow conditions. Inlet pressure is the same, but exit pressure changes. Based on early experimental data.
Separation behavior in nozzles is deeply influenced by the presence of compression waves or shock waves inside the diverging nozzle section, which are strong discontinuities and exist only in supersonic flow. The sudden pressure rise in curve ID represents such a compression wave. Expansion waves (below point B), also strictly supersonic phenomena, act to match flows from the nozzle exit to lower ambient pressures. Compression and expansion waves are further described in Chapter 20.
These different possible flow conditions in supersonic nozzles may be stated as follows:
- When the external pressure p3 is below the nozzle exit pressure p2, the nozzle will flow full but there will form external expansion waves at its exit (i.e., underexpansion). The expansion of the gas inside the nozzle is incomplete and the values of CF and Is will be less than at optimum expansion.
- For external pressures p3 somewhat higher than the nozzle exit pressure p2, the nozzle will continue to flow full. This will occur until p2 drops to a value between about 10 and 40% of p3. The expansion is somewhat inefficient and CF and Is will have lower values than an optimum nozzle would have. Weak oblique shock waves will develop outside the nozzle exit section.
- At higher external pressures, flow separation will begin to take place inside the divergent portion of the nozzle. The diameter of the exiting supersonic jet will be smaller than the nozzle exit diameter (with steady flow, separation remains typically axially symmetric). Figures 3–9 and 3–10 show diagrams for separated flows. The axial location of the separation plane depends on both the local pressure and the wall contour. The separation point travels upstream with increasing external pressure. At the nozzle exit, separated flow remains supersonic in the center portion but is surrounded by an annular‐shaped section of subsonic flow. There is a discontinuity at the separation location and the thrust is reduced compared to an optimum expansion nozzle at the available area ratio. Shock waves may exist outside the nozzle in the plume.

Figure 3–9 Thrust coefficient CF for two nozzles of different area ratios. One has jet separation below about 7000 m altitude. The fully expanded exhaust plume at higher altitudes is not shown in the sketch.
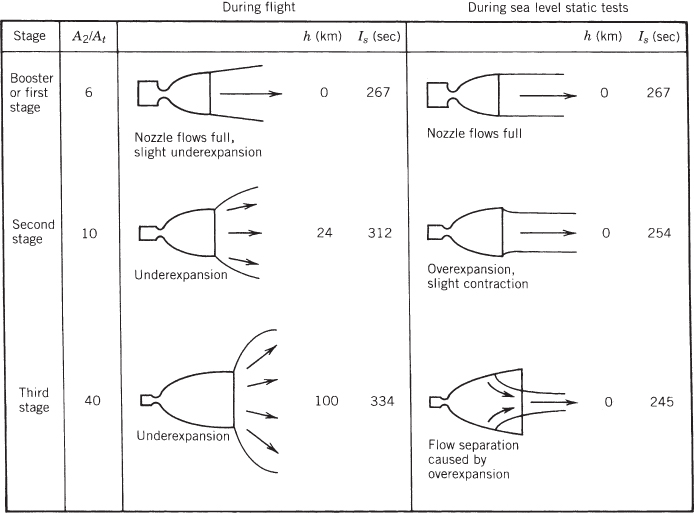
Figure 3–10 Sketches of exhaust gas behavior of three typical rocket nozzles of a three‐stage launch vehicle. The first vehicle stage has the biggest chamber and the highest thrust but the lowest nozzle exit area ratio, and the top or third stage usually has the lowest thrust but the highest nozzle exit area ratio.
- For nozzles in which the exit pressure is just below the value of the inlet pressure (i.e., curve AH in Fig. 3–8), the pressure ratio is below the critical pressure ratio (as defined by Eq. 3–20) and subsonic flow would prevail throughout the entire nozzle. This condition normally occurs in rocket nozzles for a short time during the start and stop transients.
Methods for estimating pressure at the location of the separation plane inside the diverging section of a supersonic nozzle have traditionally been empirical (see Ref. 3–4). Reference 3–5 describes a variety of nozzles, their behavior, and methods used to estimate the location and pressure at separation. Actual values of pressure for the overexpanded and underexpanded regimes described above are functions of the specific heat ratio and the area ratio (see Ref. 3–1).
The axial thrust direction is not usually altered by separation because steady flows tend to separate uniformly over the divergent portion of a nozzle, but during start and stop transients this separation may not be axially symmetric and may momentarily produce large side forces at the nozzle walls. During normal sea‐level transients in large rocket nozzles (before the chamber pressure reaches its full value), some momentary flow oscillations and nonsymmetric separation of the jet may occur while in overexpanded flow operation. The magnitude and direction of these transient side forces may change rapidly and erratically. Because these resulting side forces can be large, they have caused failures of nozzle exit cone structures and thrust vector control gimbal actuators. References , and 14 discuss techniques for estimating these side forces.
When flow separates, as it does in a highly overexpanded nozzle, the thrust coefficient CF can be estimated only when the location of separation in the nozzle is known. The CF thus determined relates to an equivalent smaller nozzle with an exit area equal to that at the separation plane. The effect of separation is move the effective value of ε in Figs. 3–6 and 3–7 to the left of the physical or design value. Thus, with separated gas flows, a nozzle designed for high altitude (large value of ε) could have a larger thrust at sea level than expected; in this case, separation may actually be desirable. But with continuous separated flow operation a large and usually heavy portion of the nozzle is not utilized making it bulkier and longer than necessary. Such added engine mass and size decrease flight performance. Designers therefore usually select an area ratio that will not cause separation.
Because of potentially uneven flow separation and its destructive side loads, sea‐level static tests of an upper stage or of a space propulsion system with high area ratios are usually avoided because they result in overexpanded nozzle operation; instead, tests are done with a sea‐level substitute nozzle (of a much smaller area ratio) often called a “stub nozzle.” However, actual or simulated altitude testing (in an altitude test facility, see Chapter 21) is done with nozzles having the correct area ratio. One solution that avoids separation at low altitudes and has high values of CF at high altitudes would consist of a nozzle that changes area ratio in flight. This is discussed at the end of this section.
For most atmospheric flights, rocket systems have to operate over a range of altitudes; for a fixed chamber pressure this implies a range of nozzle pressure ratios. The most desirable nozzle for such an application is not necessarily one that gives optimum nozzle gas expansion, but one that gives the best vehicle overall flight performance (say, total impulse, or range, or payload); this can often be related to a time average over the powered flight trajectory.
Figure 3–10 shows behavior comparisons of altitude and sea‐level ground‐tests of three nozzles and their plumes at different area ratios for a typical three‐stage satellite launch vehicle. When fired at sea‐level conditions, the nozzle of the third stage with the highest area ratio will experience flow separation and suffer a major performance loss; the second stage will flow full but the external plume will contract; since ![]() , there is a loss in Is and F. There is no effect on the first stage nozzle. When the second and third stages actually operate at their proper altitude, they would experience no separation.
, there is a loss in Is and F. There is no effect on the first stage nozzle. When the second and third stages actually operate at their proper altitude, they would experience no separation.
Figures 3–9 and 3–10 suggest that a continuous optimum performance for an ascending (e.g., launch) rocket vehicle would require a “rubber‐like” diverging section that would lengthen and enlarge so that the nozzle exit area would increase as the ambient pressure is reduced. Such design would then allow the rocket vehicle to attain its best performance at all altitudes as it ascends. As yet we have not achieved such flexible, stretchable mechanical nozzle designs with full altitude compensation similar to “stretching rubber.” However, there are a number of practical nozzle configurations that can be used to alter nozzle shape with altitude and obtain peak performance at different altitudes. These are discussed in the next section.
Influence of Chamber Geometry
When the chamber has a cross section that is about four times larger than the throat area ![]() , the chamber velocity
, the chamber velocity ![]() , may be neglected, as was mentioned in introducing Eqs. 3–15 and 3–16. However, some vehicle space‐ or weight‐constraints for liquid propellant engines often require smaller thrust chamber areas, and for solid propellant motors grain design considerations may lead to small void volumes or small perforations or port areas. In these cases,
, may be neglected, as was mentioned in introducing Eqs. 3–15 and 3–16. However, some vehicle space‐ or weight‐constraints for liquid propellant engines often require smaller thrust chamber areas, and for solid propellant motors grain design considerations may lead to small void volumes or small perforations or port areas. In these cases, ![]() 's contribution to performance can no longer be neglected. Gases in the chamber expand as heat is being added. The energy expended in accelerating these expanding gases within the chamber will also cause a pressure drop, and processes in the chamber can be adiabatic (no heat transfer) but not isentropic. Losses are a maximum when the chamber diameter equals the nozzle throat diameter, which means that there is no converging nozzle section. This condition is called a throatless rocket motor and is found in a few tactical missile booster applications, where there is a premium on minimum inert mass and length. Here, flight performance improvements due to inert mass savings have supposedly outweighed the nozzle performance loss of a throatless motor.
's contribution to performance can no longer be neglected. Gases in the chamber expand as heat is being added. The energy expended in accelerating these expanding gases within the chamber will also cause a pressure drop, and processes in the chamber can be adiabatic (no heat transfer) but not isentropic. Losses are a maximum when the chamber diameter equals the nozzle throat diameter, which means that there is no converging nozzle section. This condition is called a throatless rocket motor and is found in a few tactical missile booster applications, where there is a premium on minimum inert mass and length. Here, flight performance improvements due to inert mass savings have supposedly outweighed the nozzle performance loss of a throatless motor.
Because of the significant pressure drops within narrow chambers, chamber pressures are lower at the nozzle entrance than they would be with a larger A1/At. This causes a small loss in thrust and specific impulse. The theory of such losses is given in the Second and Third Editions of this book, and some results are listed in Table 3–2.
Table 3–2 Estimated Losses for Small‐Diameter Chambers
| Chamber‐to‐Throat | Throat | Thrust | Specific Impulse |
| Area Ratio | Pressure (%) | Reduction (%) | Reduction (%) |
| ∞ | 100 | 0 | 0 |
| 3.5 | 99 | 1.5 | 0.31 |
| 2.0 | 96 | 5.0 | 0.55 |
| 1.0 | 81 | 19.5 | 1.34 |
![]() .
.
3.4 NOZZLE CONFIGURATIONS
Several different proven nozzle configurations are available today. This section describes their geometries and performance. Other chapters in this book (6, 8, 12, 15, and 18) discuss nozzle materials, heat transfer, and their applications with mention of certain requirements, design, construction, and thrust vector control. Nozzles and chambers are typically circular in cross section and must have a converging section, a throat or minimum cross section, and a diverging section. Nozzles are apparent in Figs. 1–4, 1–5, 1–8, 2–1, 3–10, as well as in Figs. 3–11, 3–13, 11–1, 12–1 to 12–4, and 15–6 and 15–8. Refs. 3–4 and 3–8 describe several other nozzle configurations.

Figure 3–11 Simplified diagrams of different generic nozzle configurations and their flow effects.
The converging nozzle section shape between the chamber and the throat does not significantly affect nozzle performance. Its subsonic flow can easily be turned with very low pressure drops and almost any given radius, cone angle, wall contour curve, or nozzle inlet shape is satisfactory. A few small attitude control thrust chambers have had their nozzle turn at 90° from the combustion chamber axis without measurable performance loss. The throat contour itself is also not very critical to performance, and any smooth curved shape is usually acceptable. Since pressure gradients are high in these two regions, the flow will always adhere to the walls. Principal differences in nozzle configurations are found in the diverging supersonic‐flow section, as described below. In general, internal wall surfaces throughout the nozzle should be smooth and reflective to minimize friction, radiation absorption, and convective heat transfer, which is enhanced by surface roughness. Gaps, holes, sharp edges, and/or protrusions must be avoided.
Six different nozzle configuration types have been considered and they are depicted in Fig. 3–11. The first three sketches show the more common conical and bell‐shaped nozzles and they are further described in this chapter. The last three have a center body inside the nozzle in order to provide altitude compensation (this means that outside the nozzle the hot‐gas boundaries can grow as the outside pressure decreases allowing a more optimum expansion with altitude). Although these last three have been thoroughly ground tested, to date none of them has flown in a production space launch vehicle (see Eighth edition). The lengths of several nozzle types are compared in Fig. 3–12. The objectives for a good nozzle configuration are to obtain the highest practical Is minimizing inert nozzle mass and conserving length (shorter nozzles can reduce vehicle length, vehicle structure, and vehicle inert mass).
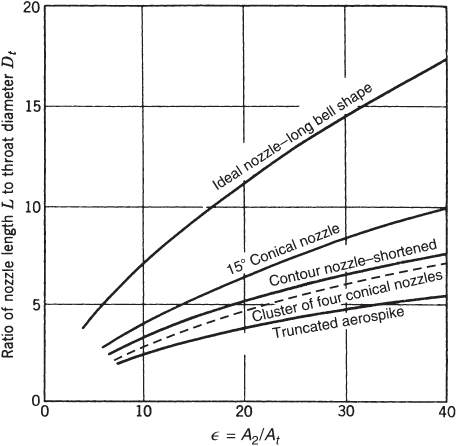
Figure 3–12 Length comparison of several types of nozzles.
Taken in part from Ref. 3–9.
Cone‐ and Bell‐Shaped Nozzles
The conical nozzle is the oldest and perhaps the simplest configuration. It is relatively easy to fabricate and is still used today in many small nozzles. A theoretical correction factor λ must be applied to the nozzle exit momentum in any ideal rocket propulsion system using a conical nozzle. This factor is the ratio between the momentum of the gases exhausting with a finite nozzle angle 2α and the momentum of an ideal nozzle with all gases flowing in the axial direction:
For ideal rockets ![]() . For a rocket nozzle with a divergence cone angle of 30° (half angle α = 15°), the exit momentum and therefore the axial exhaust velocity will be 98.3% of the velocity calculated by Eq. 3–15b. Note that the correction factor λ only applies to the first term (momentum thrust) in Eqs. 2–13, 3–29, and 3–30 and not to the second term (pressure thrust).
. For a rocket nozzle with a divergence cone angle of 30° (half angle α = 15°), the exit momentum and therefore the axial exhaust velocity will be 98.3% of the velocity calculated by Eq. 3–15b. Note that the correction factor λ only applies to the first term (momentum thrust) in Eqs. 2–13, 3–29, and 3–30 and not to the second term (pressure thrust).
A half angle value of 15° has become the unofficial standard of reference for comparing correction factors or energy losses or lengths from different diverging conical nozzle contours.
Small nozzle divergence angles may allow most of the momentum to remain axial and thus produce high specific impulses, but they result long nozzles introducing performance penalties in the rocket propulsion system and the vehicle mass, amounting to small losses. Larger divergence angles give shorter, lightweight designs, but their performance may become unacceptably low. Depending on the specific application and flight path, there is an optimum conical nozzle divergence (typically between 12 and 18° half angle).
Bell‐shaped or contour nozzles (see Figs. 3–11 and 3–13) are possibly the most common nozzle shapes used today. They have a high angle expansion section (20 to 50°) immediately downstream of the nozzle throat followed by a gradual reversal of nozzle contour slope so that at the nozzle exit the divergence angle is small, usually less than a 10° half angle. It is possible to have large divergence angles immediately behind the throat (of 20 to 50°) because high relative local pressures, large pressure gradients, and rapid expansions of the working fluid do not allow separation in this region (unless there are discontinuities in the nozzle contour). Gas expansion in supersonic bell nozzles is more efficient than in simple straight cones of similar area ratio and length because wall contours can be designed to minimize losses, as explained later in this section.

Figure 3–13 Top sketch shows comparison of nozzle inner diverging wall surfaces for a 15° conical nozzle, an 80% length bell nozzle, a 60% length bell nozzle, all at an area ratio of 25. The lengths are expressed in multiples of the throat radius rt. The middle set of curves shows the initial angle θi and the exit angle θe for bell nozzles as functions of the nozzle area ratio and percent length. The bottom curves show the nozzle losses in terms of a correction factor.
Changing the direction of supersonic flows with an expanding wall geometry requires expansion waves. These occur at thin regions within the flow, where the flow velocity increases as it slightly changes its direction, and where the pressure and temperature drop. These wave surfaces are at oblique angles to the flow. Beyond the throat, the gas crosses a series of expansion waves with essentially no loss of energy. In the bell‐shaped configuration shown in Fig. 3–13 these expansions occur internally in the flow between the throat and the inflection location I; here the area is steadily increasing (like a flare on a trumpet). The contour angle θi is a maximum at this inflection location. Between the inflection point I and the nozzle exit E the flow area increases at a diminishing rate. Here, the nozzle wall contour is different and the rate of change in cross‐sectional area per unit length is decreasing. One purpose of this last nozzle segment is to reduce the nozzle exit angle θe and thus to reduce flow divergence losses as the gas leaves the nozzle exit plane. The angle at the exit θe is small, usually less than 10°. The difference between θi and θe is called the turn‐back angle. As the gas flow is turned in the opposite direction (between points I and E) oblique compression waves occur. These compression waves are thin surfaces where the flow undergoes a mild shock as it is turned back and its velocity slightly reduced. Each of these multiple compression waves causes a small energy loss. By carefully determining the wall contour (through an analysis termed “method of characteristics”), it is possible to balance the oblique expansion waves with the oblique compression waves and minimize these energy losses. Analyses leading to bell‐shaped nozzle contours are presented in Chapter 20.33 of Ref. 3–3 and also in Refs. 3–8 to 3–11. Most rocket organizations have developed their own computer codes for such work. It has been found that the radius of curvature or contour shape at the throat region noticeably influences the contours in diverging bell‐shaped nozzle sections.
The length of a bell nozzle is usually given as fractions of the length of a reference conical nozzle with a 15° half angle. An 80% bell nozzle has a length (distance between throat plane and exit plane) that is 20% shorter than a comparable 15° cone of the same area ratio. Reference 3–9 shows the original method of characteristics as initially applied to determine bell nozzle contours and later to shortened bell nozzles; a parabola has been used as a good approximation for the bell‐shaped contour curve (Ref. 3–3, Section 20.33), and actual parabolas have been used in some nozzle designs. The top part of Fig. 3–13 shows a parabolic contour that is tangent (θi) at the inflection point I and has an exit angle (θe) at point E, and that its length L that has to be corrected for the curve TI. These conditions allow the parabola to be determined either from simple geometric analysis or from a drawing. A throat approach radius of 1.5rt and a throat expansion radius of 0.4rt were used here. If somewhat different radii had been used, the results would have been only slightly different. The middle set of curves gives the relation between length, area ratio, and the two angles of the bell contour. The bottom set of curves gives the correction factors, equivalent to the λ‐factor for conical nozzles, which are to be applied to the thrust coefficient or the exhaust velocity, provided the nozzles operate at optimum expansion, that is, ![]() .
.
Table 3–3 shows data for parabolas developed from Fig. 3–13 in order to allow the reader to apply this method and check results. The table shows two shortened bell nozzles and a conical nozzle, each for three area ratios. A 15° half angle cone is given as reference. It can be seen that as the length decreases, the losses are higher for the shorter length and slightly higher for the smaller nozzle area ratios. A 1% improvement in the correction factor gives about 1% greater specific impulse (or thrust), and this difference can be significant in many applications. A reduced length is an important benefit usually reflected in improvements of the vehicle mass ratio. Table 3–3 and Fig. 3–13 show that bell nozzles (75 to 85% the length of cones) can be slightly more efficient than a longer 15° conical nozzle (100% length) at the same area ratio. For shorter nozzles (below 70% equivalent length), the energy losses due to internal oblique shock waves can become substantial so that such short nozzles are not commonly used today.
Table 3–3 Data on Several Bell‐Shaped Nozzles
| Nozzle Exit Area Ratio | 10 | 25 | 50 |
| Cone (15° Half Angle) | |||
| Length (100%)a | 8.07 | 14.93 | 22.66 |
| Correction factor λ | 0.9829 | 0.9829 | 0.9829 |
| 80% Bell Contour | |||
| Lengtha | 6.45 | 11.94 | 18.12 |
| Correction factor λ | 0.985 | 0.987 | 0.988 |
| Approximate half angle at inflection point and exit (degrees) | 25/10 | 30/8 | 32/7.5 |
| 60% Bell Contour | |||
| Lengtha | 4.84 | 9.96 | 13.59 |
| Correction factor λ | 0.961 | 0.968 | 0.974 |
| Approximate half angle at inflection point and exit (degrees) | 32.5/14 | 36/17 | 39/18 |
The length is given in dimensionless form as a multiple of the throat radius.
For solid propellant rocket motor exhausts containing small solid particles in the gas (usually aluminum oxide), and for the exhaust of certain gelled liquid propellants, solid particles impinge against the nozzle wall in the reversing curvature section between I and E in Fig. 3–13. While the gas can be turned by oblique waves to have less divergence, any particles (particularly the larger particles) will tend to move in straight lines and hit the walls at high velocities. The resulting abrasion and erosion of the nozzle wall can be severe, especially with commonly used ablative and graphite materials. This abrasion by hot particles increases with turn‐back angle. Only when the turn‐back angle and thus also the inflection angle θi are reduced such erosion can become acceptable. Typical solid rocket motors flying today have values of inflection angles between 20 and 26° and turn‐back angles of 10 to 15° with different wall contours in their divergent section. In comparison, current liquid rocket engines without entrained particles have inflection angles between 27 and 50° and turn‐back angles of between 15 and 30°. Therefore, performance enhancements resulting from the use of bell‐shaped nozzles (with high correction factor values) are somewhat lower in solid rocket motors with solid particles in the exhaust.
An ideal (minimum loss through oblique waves) bell‐shaped nozzle is relatively long, equivalent to a conical nozzle of perhaps 10 to 12°, as seen in Fig. 3–11. Because long nozzles are heavy, in applications where vehicle mass is critical, somewhat shortened bell nozzles are preferred.
Two‐Step Nozzles
Two‐position nozzles (with different expansion area ratio sections) can give better performance than conventional nozzles with a fixed single area ratio. This is evident in Fig. 3–9; the lower area ratio nozzle (![]() ) performs best at low altitudes and the higher area ratio nozzle performs best at higher altitudes. If these two nozzles could somehow be mechanically combined, the resulting two‐position nozzle would perform closer to a nozzle that adjusts continuously to the optimum area ratio, as shown by the thin dashed curve. When integrated over flight time, the extra performance has a noticeable payoff for high‐velocity missions, such as Earth‐orbit injection and deep space missions. Several bell‐shaped nozzle concepts have evolved that achieve maximum performance at more than a single altitude. Figure 3–14 shows three different two‐step nozzle concepts, having an initial low area ratio A2/At for operation at or near the Earth's surface and a larger second area ratio that improves performance at high altitudes. See Ref. 3–4.
) performs best at low altitudes and the higher area ratio nozzle performs best at higher altitudes. If these two nozzles could somehow be mechanically combined, the resulting two‐position nozzle would perform closer to a nozzle that adjusts continuously to the optimum area ratio, as shown by the thin dashed curve. When integrated over flight time, the extra performance has a noticeable payoff for high‐velocity missions, such as Earth‐orbit injection and deep space missions. Several bell‐shaped nozzle concepts have evolved that achieve maximum performance at more than a single altitude. Figure 3–14 shows three different two‐step nozzle concepts, having an initial low area ratio A2/At for operation at or near the Earth's surface and a larger second area ratio that improves performance at high altitudes. See Ref. 3–4.

Figure 3–14 Simplified diagrams of three altitude‐compensating two‐step nozzle concepts. See Ref. 3–4.
Extendible Nozzles
The extendible nozzle is now relatively common for top stages of multistage vehicles. Its nozzle extension is moved into operating position after a lower stage has finished working and has dropped off. These propulsion systems only operate in space with the nozzle extended. Extendible nozzles require actuators, a power supply, mechanisms for moving the extension into position during flight, and fastening and sealing devices. They have successfully flown in several solid rocket motor nozzles and liquid engine applications, where they were deployed prior to ignition. See Fig. 8–17. Key concerns here are reliable, rugged mechanisms to move the extension into position, the hot gas seal between the nozzle sections, and the extra weights involved. Its principal merit is the short nozzle length while stored during operation of the lower stages, which reduces vehicle length and inert mass. There have been versions of this concept with three nozzle segments; one is shown in Fig. 12–3.
The droppable insert concept shown in Fig. 3–14 avoids any moving mechanisms and gas seals but has a potential stagnation temperature problem at the joint of the two segments. To date, it has not flown in U.S. production vehicles. See Refs. 3–4 and 3–12.
The dual‐bell nozzle concept uses two shortened bell nozzles combined into one with a “ring‐shaped bump” or inflection point between them, as shown in Fig. 3–14. During ascent, it functions first with the lower area ratio, with flow separation occurring at the bump. As altitude increases, the flow expands further and attaches itself downstream of this inflection point, filling the full nozzle exit section and operating with the higher area ratio for higher performance. There is a small performance penalty for a contour with a circular bump and some concerns about heat transfer. To date, there has been little flight experience with this concept.
Multiple Nozzles
Whenever possible, reducing nozzle length by replacing a single large nozzle with a cluster of smaller nozzles on liquid engines or solid motor units (with the same total thrust) will reduce vehicle length and often vehicle structure and inert mass. Quadruple thrust chamber arrangements have been used effectively in several U.S. and many large Russian space launch vehicles and missiles. Multiple nozzles can be designed to provide thrust vector control (see Figure 18–9). As indicated in Fig. 3–12, the nozzle length of such a cluster can be about 30% shorter than a single nozzle of an equivalent larger thrust chamber. But vehicle diameter at the cluster nozzle exit location needs to be somewhat larger, vehicle drag can be somewhat higher, and there is additional engine complexity often with more engine mass.
3.5 REAL NOZZLES
The assumptions listed in Section 3–1 are approximations that allow relatively simple mathematical relations for the analysis of real rocket nozzles. With most of these assumptions it is possible either (1) to use an empirical correction factor (based on experimental data) or (2) to develop or use more accurate algorithms, which represent a better simulation of energy losses, physical or chemical phenomena, and contain more complex theoretical descriptions. Some of these more accurate approaches are briefly covered in this section.
Compared to an ideal nozzle, real nozzles have losses and some of the flow internal energy is unavailable for conversion into kinetic energy of the exhaust. Principal losses are listed below and several of these are then discussed in more detail.
- The divergence of the flow in the nozzle exit sections is a loss that varies as a function of the cosine of the divergence angle, as shown by Eq. 3–34 for conical nozzles. These losses can be reduced with bell‐shaped nozzle contours.
- Small chamber or port area cross sections relative to the throat area or low nozzle contraction ratios A1/At cause pressure losses in the chamber and slightly reduce the thrust and exhaust velocity. See Table 3–2.
- The lower velocities at the wall boundarylayers reduce the effective average exhaust velocity by 0.5 to 1.5%.
- Solid particles and/or liquid droplets in the gas may cause losses of perhaps up to 5% (depending on particle size, shape and percent solids), as described below.
- Unsteady combustion and/or flow oscillations may result in small losses.
- Chemical reactions within nozzle flows change gas composition and gas properties and gas temperatures, amounting to typically a 0.5% loss. See Chapter 5.
- Chamber pressures and overall performance are lower during transient operations, for example, during start, stop, or pulsing.
- Any gradual erosion of the throat region increases its diameter by perhaps 1 to 6% during operation with uncooled nozzle materials (such as fiber‐reinforced plastics or carbon). In turn, this will reduce the chamber pressure and thrust by about 1 to 6%. Such throat area enlargements cause a slight reduction in specific impulse, usually less than 0.7%.
- Nonuniform gas compositions may reduce performance (due to incomplete mixing or incomplete combustion).
- Real gas properties may noticeably modify gas composition, that is, actual values of k and
 cause a small loss in performance, about 0.2 to 0.7%.
 - Operation at nonoptimum altitudes reduces thrust and specific impulse for nozzles of fixed area ratios. There is no loss if the vehicle flies only at the altitude designed for optimum nozzle expansion (
 ). If it flies at higher or lower altitudes, then the losses (during those portions of the flight) can amount up to 10% of thrust compared to a nozzle with altitude compensation, as can be seen in Figs. 3–6 and 3–7. These conditions may also reduce overall vehicle flight performance between 1 and 5%.
Boundary Layers
Real nozzles always develop thin viscous boundary layers adjacent to their inner walls, where gas velocities are much lower than in the free‐stream region. An enlarged depiction of a boundary layer is shown in Fig. 3–15. Immediately next to the wall the flow velocity is zero; beyond the wall the boundary layer may be considered as being built up of successive annular‐shaped thin layers of increasing velocity until the free‐stream value is reached. The low‐velocity flow region closest to the wall is always laminar and subsonic, but at the higher‐velocity regions of the boundary layer the flow becomes supersonic and can be turbulent. Local temperatures at some locations in the boundary layer can be noticeably higher than the free‐stream temperature because of the conversion of kinetic energy into thermal energy that occurs as the velocity is locally slowed down and by heat created by viscous effects. The flow layer immediately next to the wall will be cooler because of heat transfer to the wall. These gaseous boundary layers have a profound effect on the overall heat transfer to nozzle and chamber walls. They also affect rocket performance, particularly in applications with very small nozzles and also with relatively long nozzles with high nozzle area ratios, where a comparatively high proportion of the total mass flow (2 to 25%) can be in the lower‐velocity region of the boundary layer. High gradients in pressure, temperature, or density and changes in local velocity (direction and magnitude) also influence boundary layers. Flow separation in nozzles always originates inside the boundary layers. Scaling laws for boundary layer phenomena have not been reliable to date.

Figure 3–15 Flow conditions at a nozzle exit lip at high altitudes, showing streamline, boundary layer, velocity, and temperature profiles.
Theoretical approaches to boundary layer effects can be found in Chapters 26 to 28 of Ref. 3–1 and in Ref. 3–18. Even though theoretical descriptions of boundary layers in rocket nozzles are yet unsatisfactory, their overall effects on performance can be small—for most rocket nozzles with unseparated flow, boundary layer derived losses of specific impulse seldom exceeds 1%.
Multiphase Flow
In some propulsion systems, the gaseous working fluid contains small liquid droplets and/or solid particles entrained in the flow. They may heat the gas during nozzle expansion. This heating, for example, occurs with solid propellants (see Section 13–4) or in some gelled liquid propellants, which contain aluminum powder because small oxide particles form in the exhaust. This can also occur with iron oxide catalysts, or solid propellants containing aluminum, boron, or zirconium.
In general, if the particles are relatively small (typically with diameters of 0.005 mm or less), they will have almost the same velocity as the gas and will be in thermal equilibrium with the nozzle gas flow. Thus, even if some kinetic energy is transferred to accelerate the embedded particles, the flow gains thermal energy from them. As particle diameters become larger, the mass (and thus the inertia) of each particle increases as the cube of its diameter; however, the drag or entrainment force increases only as the square of the diameter. Larger particles therefore lag the gas movement and do not transfer heat to the gas as readily as do smaller particles. Larger particles have a lower momentum than an equivalent mass agglomeration of smaller particles and reach the nozzle exit at higher temperatures because they give up less of their thermal energy.
It is possible to derive simple equations for correcting performance (Is, c, or ![]() ) as shown below and as given in Refs. 3–13 and 3–14. These formulas are based on the following assumptions: specific heats of the gases and the particles are constant throughout the nozzle flow, particles are small enough to move at essentially the same velocity as the gas and are in thermal equilibrium with it, and that particles do not exchange mass with the gas (no vaporization or condensation). Expansion and acceleration occur only in the gas, and the volume occupied by the particles is negligibly small compared to the overall gas volume. When the amount of particles is small, the energy needed to accelerate these particles may also be neglected. There are also no chemical reactions.
) as shown below and as given in Refs. 3–13 and 3–14. These formulas are based on the following assumptions: specific heats of the gases and the particles are constant throughout the nozzle flow, particles are small enough to move at essentially the same velocity as the gas and are in thermal equilibrium with it, and that particles do not exchange mass with the gas (no vaporization or condensation). Expansion and acceleration occur only in the gas, and the volume occupied by the particles is negligibly small compared to the overall gas volume. When the amount of particles is small, the energy needed to accelerate these particles may also be neglected. There are also no chemical reactions.
The enthalpy h, the specific volume V, the specific heat ratio k, and the gas constant R can be expressed as functions of a particle fraction β, which represents the mass of particles (liquid and/or solid) divided by the total mass. The specific heats at constant pressure and volume are denoted as cp and ![]() . Using the subscripts g and s to refer to gaseous or solid states, the following relationships then apply:
. Using the subscripts g and s to refer to gaseous or solid states, the following relationships then apply:
Performance parameters for nozzle flows from solid‐propellant combustion products that contain small particles or small droplets in the exhaust gas are briefly discussed at the end of this section.
Equations 3–35 to 3–39 are then used with the formulas for simple one‐dimensional nozzle flow, such as Eq. 2–15, 3–15, or 3–32. Values for specific impulse or characteristic velocity will decrease with β, while the particle percent increases. For very small particles (less than 0.01 mm in diameter) and small values of β (less than 6%) losses in specific impulse are often below 2%. For larger particles (over 0.015 mm diameter) and larger values of β this theory does not apply—the specific impulse can become 10 to 20% less than the value without any flow lag. Actual particle sizes and their distribution depend on the particular propellant combustion products, the actual particle composition, and the specific rocket propulsion system; these parameters usually have to be measured (see Chapters 13 and 20). Thus, adding a metal, such as aluminum, to a solid propellant will increase performance only when the additional heat release can sufficiently increase the combustion temperature T0 so that it more than offsets any decrease caused by the nonexpanding mass portion of the particles in the exhaust.
With very high area ratio nozzles and low nozzle exit pressures (at high altitudes or the vacuum of space) some gaseous propellant ingredients may condense; when temperatures drop sharply in the nozzle, condensation of H2O, CO2, or NH3 are known to occur. This causes a decrease in the gas flow per unit area while transfer of the latent heat of particle vaporization to the remaining gas takes place. It is also possible to form a solid phase and precipitate fine particles of snow (H2O) or frozen fogs of other species. Overall effect on performance is small only if the particle sizes are small and the percent of precipitate mass is moderate.
Other Phenomena and Losses
The combustion process can never be totally steady. Low‐ and high‐frequency oscillations in chamber pressure of up to perhaps 5% of rated values are considered to be smooth‐burning and sufficiently steady flow. Gas properties (![]() ) and flow properties (
) and flow properties (![]() , V, T, p, etc.) will also oscillate with time and will not necessarily be uniform across the flow channel. We therefore deal with “average” values of these properties only, but it is not always clear what kind of time averages are appropriate. Energy losses due to nonuniform unsteady burning are difficult to assess theoretically; for smooth‐burning rocket systems these losses are neglected, but they may become significant for the larger‐amplitude oscillations.
, V, T, p, etc.) will also oscillate with time and will not necessarily be uniform across the flow channel. We therefore deal with “average” values of these properties only, but it is not always clear what kind of time averages are appropriate. Energy losses due to nonuniform unsteady burning are difficult to assess theoretically; for smooth‐burning rocket systems these losses are neglected, but they may become significant for the larger‐amplitude oscillations.
Gas composition may change somewhat in the nozzle when chemical reactions are occurring in the flowing gas, and the assumption of a uniform or “chemically‐frozen‐composition” gas flow may not be fully valid for all chemical systems. A more sophisticated approach for determining performance with changing composition and changing gas properties is described in Chapter 5. Also, any thermal energy that exits the nozzle (![]() ) is unavailable for conversion to useful propulsive (kinetic) energy, as shown in Fig. 2–2. The only way to decrease this loss is to reduce the nozzle exit temperature T2 (with a larger nozzle area ratio), but most often this amounts to other sizable losses.
) is unavailable for conversion to useful propulsive (kinetic) energy, as shown in Fig. 2–2. The only way to decrease this loss is to reduce the nozzle exit temperature T2 (with a larger nozzle area ratio), but most often this amounts to other sizable losses.
When operating durations are multiple and short (as with antitank rockets or pulsed attitude control rockets which start and stop repeatedly), start and stop transients become a significant fraction of total operating time. During these transient periods the average thrust, chamber pressure, and specific impulse will be lower than during steady operating conditions. This situation may be analyzed with a step‐by‐step process; for example, during start‐up the amount of propellant flowing in the chamber has to equal the flow of gas through the nozzle plus the amount of gas needed to fill the chamber to a higher pressure; alternatively, an empirical curve of chamber pressure versus time, if available, could be used as the basis of such calculations. Transition times can be negligibly short in small, low‐thrust propulsion systems, perhaps a few milliseconds, but they become longer (several seconds) for large propulsion systems.
Performance Correction Factors
In addition to the theoretical cone‐ and bell‐shaped nozzle correction factors discussed in Section 3–4, we discuss here another set of empirical correction factors. These factors represent a variety of nonideal phenomena (such as friction, imperfect mixing and/or combustion, heat transfer, chemical nonequilibrium, and two‐ and three‐dimensional effects) that are unavoidably present; refer to Fig. 2–2 and Ref. 3–4. Correction factors are arbitrarily defined in rocket analysis and may differ from the more conventional efficiencies—there are no “universal performance correction factors.” For specific propulsion systems, where accurately measured data are available, they allow for simple predictions of actual performance. For example, a velocity correction factor of 0.942 means that the velocity or the actual specific impulse is about 94% of theoretical (a commonly used value might be closer to 0.92).
Corrections factors are used by engineers to determine performance ahead of testing and for preliminary designs, informal proposals, and health monitoring systems. In all these, a set of accepted or nominal values is needed to estimate performance together with some useful formula recipes. For accurate calculations, the industry relies extensively on computer programs which are largely proprietary.
Correction factors are ratios of measured or actual (subscript “a”) to formulated or ideal (subscript “i”) values. In the ordinary testing of rocket propulsion systems, the combustion chamber pressure, the propellant mass flow rates, the thrust force, and the throat and exit areas are typically measured. These measurements yield two direct ratios, namely, the thrust correction factor (![]() ) and the discharge correction factor
) and the discharge correction factor ![]() and, using measured chamber pressures, the product [(p1)a(At)a] that has units of force. This product enters into the formulation of two other correction factors discussed below. The nozzle area ratio [
and, using measured chamber pressures, the product [(p1)a(At)a] that has units of force. This product enters into the formulation of two other correction factors discussed below. The nozzle area ratio [![]() ] in real nozzles is found from measurements and this ratio may differ from the ideal or calculated value as will be shown in Example 3–7. In liquid propellant rocket engines, the propellant mass flow rate
] in real nozzles is found from measurements and this ratio may differ from the ideal or calculated value as will be shown in Example 3–7. In liquid propellant rocket engines, the propellant mass flow rate ![]() is measured during ground tests using calibrated flowmeters, but it is practically impossible to directly measure mass flow rates in solid propellant motors. Only an effective
is measured during ground tests using calibrated flowmeters, but it is practically impossible to directly measure mass flow rates in solid propellant motors. Only an effective ![]() is determined from the initial and final weights at ground testing. Therefore, the discharge correction factor
is determined from the initial and final weights at ground testing. Therefore, the discharge correction factor ![]() for solid propellant rocket motors represents only an averaged value.
for solid propellant rocket motors represents only an averaged value.
The thrust correction factor (ζF) is found from the ratio of thrust measurements with the corresponding ideal values given by Eq. 3–29. The discharge correction factor (ζd) can be determined from the ratio of mass‐flow‐rate measurements with the corresponding theoretical values of Eq. 3–24. Unlike incompressible flows, in rocket propulsion systems the value of ζd is always somewhat larger than 1.0 (up to 1.15) because actual flow rates may exceed ideal flow rates for the following reasons:
- Incomplete combustion (a lower combustion temperature), which results in increases of the exhaust gas densities.
- Cooling at the walls that reduces boundary layer temperatures and thus the average gas temperature, especially in small thrust chambers.
- Changes in the specific heat ratio and molecular mass in an actual nozzle that affect the flow rate and thus the discharge correction factor (see Eq. 3–24).
The ![]() efficiency or
efficiency or ![]() correction factor represents a combined effectiveness of the combustion chamber and the injector design. It can be determined from the ratio of measured values of
correction factor represents a combined effectiveness of the combustion chamber and the injector design. It can be determined from the ratio of measured values of ![]() (from Eq. 2–17) with the corresponding ideal value of the right‐hand side of Eq. 3–32. In well‐designed combustion chambers, the value of
(from Eq. 2–17) with the corresponding ideal value of the right‐hand side of Eq. 3–32. In well‐designed combustion chambers, the value of ![]() correction factor is over 95%. The
correction factor is over 95%. The ![]() correction factor, also known as the CF efficiency, represents the effectiveness of the nozzle design at its operating conditions. It can be determined using measured values of Fa/[(p1)a(At)a] (from Eq. 3–31) with the corresponding ideal value of Eq. 3–30. In well‐designed nozzles, the value of the
correction factor, also known as the CF efficiency, represents the effectiveness of the nozzle design at its operating conditions. It can be determined using measured values of Fa/[(p1)a(At)a] (from Eq. 3–31) with the corresponding ideal value of Eq. 3–30. In well‐designed nozzles, the value of the ![]() correction factor is above 90%.
correction factor is above 90%.
An effective exhaust velocity correction factor ![]() may now be introduced using that velocity's definition given in Eq. 2–16 (or from Eq. 3–32,
may now be introduced using that velocity's definition given in Eq. 2–16 (or from Eq. 3–32, ![]() ) as
) as
This further suggests a correction factors equation, a form equivalent to Eq. 3–33, written as ![]() , which has meaning only within existing experimental uncertainties and implies that in steady flow all four correction factors cannot be arbitrarily determined but must be so related.
, which has meaning only within existing experimental uncertainties and implies that in steady flow all four correction factors cannot be arbitrarily determined but must be so related.
Additional useful relations may also be written. The actual specific impulse, from Eq. 2–5, may now be calculated from
The thermodynamic nozzle efficiency ηn which is traditionally defined as the ratio of ideal to the actual enthalpy changes (see Eqs. 3–15a and 3–16) under a given pressure ratio becomes
The approximate sign above becomes an equality when ![]() . This nozzle efficiency will always have a value less than 1.0 and represents losses inside the nozzle (Ref. 3–3). Small nozzles being used for micropropulsion can have quite low ηn's because of their relatively large frictional effects which depend in the surface‐to‐volume ratio (some cross sections being rectangular thus having additional sharp‐corner losses).
. This nozzle efficiency will always have a value less than 1.0 and represents losses inside the nozzle (Ref. 3–3). Small nozzles being used for micropropulsion can have quite low ηn's because of their relatively large frictional effects which depend in the surface‐to‐volume ratio (some cross sections being rectangular thus having additional sharp‐corner losses).
Under strictly chemically‐frozen‐composition flow assumptions, the right‐hand side of Eq. 3–32 leads to a useful relation between the ideal and actual stagnation temperatures [here T1 ≡ (T0)i]:
With conditions at the inlet of a supersonic nozzle readily calculable, one task for the analyst is to determine the actual throat area required to pass a specified mass flow rate of gaseous propellant and also to determine the area and the flow properties at the nozzle exit plane. Across the nozzle heat losses modify the local stagnation temperatures and, together with friction, the stagnation pressures (both of which begin as ![]() and T1 in the combustion chamber). Because ideal formulations are based on the local stagnation values at any given cross section, the challenge is to work with the appropriate flow assumptions as discussed below.
and T1 in the combustion chamber). Because ideal formulations are based on the local stagnation values at any given cross section, the challenge is to work with the appropriate flow assumptions as discussed below.
When the applicable correction factors values are available, the overall ratio of the product of the stagnation pressure with the throat area may be inferred using
In order to arrive at an actual nozzle throat area from such available parameters, additional information is needed. The key question is how to relate stagnation pressure ratios to their corresponding temperature ratios across the nozzle. When known, a polytropic index “n” provides a relation between gas properties (Ref. 3–3); otherwise, we may apply the isentropic relation given as Eq. 3–7 because nozzle efficiencies are typically high (around 90%). Real nozzle flows are not isentropic but the net entropy change along the nozzle may be insignificant, though noticeable decreases of the stagnation pressure and temperature do occur as Example 3–7 will show next. When dealing with real nozzles with given expansion ratios, it becomes necessary to increase somewhat the stagnation pressure beyond (p1)i to achieve any previously defined ideal nozzle performance.
Four Performance Parameters
When using or quoting values of thrust, specific impulse, propellant flow, and other performance parameters one must be careful to specify or as bare minimum qualify the conditions under which any particular number applies. There are at least four sets of performance parameters, and they are different in concept and value, even when referring to the same rocket propulsion system. Parameters such as F, Is, c, ![]() , and/or
, and/or ![]() should be accompanied by a clear definition of the conditions under which they apply. Not all the items below apply to every parameter.
should be accompanied by a clear definition of the conditions under which they apply. Not all the items below apply to every parameter.
- Chamber pressure; also, for slender chambers, the location where this pressure prevails or is measured (e.g., at nozzle entrance).
- Ambient pressure or altitude or space (vacuum).
- Nozzle expansion area ratio and whether this is an optimum.
- Nozzle shape and exit angle (see Fig. 3–11 and Eq. 3–34).
- Propellants, their composition and mixture ratio.
- Initial ambient temperature of propellants, prior to start.
- Theoretical performance values as defined in Chapters 2, 3, and 5 generally apply only to ideal rockets. Conditions for ideal nozzles are given in Section 3.1. The theoretical performance of an ideal nozzle per se is not used, but one that includes corrections is used instead; analyses of one or more losses may be included as well as values for the correction factors described in the previous section and these will yield a lower performance. Most of these modifications are two dimensional and correct for chemical reactions in the nozzle using real gas properties, and most correct for exit divergence. Many also correct for one or more of the other losses mentioned above. For example, computer programs for solid propellant motor nozzles can include losses for throat erosion and multiphase flow; for liquid propellant engines they may include two or more concentric zones, each at different mixture ratios and thus with different gas properties. Nozzle wall contour analyses with expansion and compression waves may apply finite element analysis and/or a method of characteristics approach. Some of the more sophisticated programs include analyses of viscous boundary layer effects and heat transfer to the walls. Typically, these computer simulations are based on finite element descriptions using the basic Navier–Stokes relationships. Most organizations doing nozzle design have their own computer programs, often different programs for different nozzle designs, different thrust levels, or operating durations. Many also use simpler, one‐dimensional computer programs, which may include one or more correction factors; these programs are used frequently for preliminary estimates, informal proposals, or evaluation of ground test results.
- Delivered, that is, actually measured, performance values are obtained from static tests or flight tests of full‐scale propulsion systems. Again, the conditions should be defined (e.g., p1, A2/At, p3, etc.) and the measured values should be corrected for instrument deviations, errors, or calibration constants. Flight test data need to be corrected for aerodynamic effects, such as drag. Often, empirical values of the thrust correction factor, the velocity correction factor, and the mass discharge flow correction factors are used to convert theoretical values from item 1 above to approximate actual values, something that is often satisfactory for preliminary estimates. Sometimes subscale thrust chambers are used in the development of new large thrust chambers and then scale factors are applied to correct the measured data to full‐scale values.
- Performance values at standard conditions are the corrected values of items 1 and 2 above. These standard conditions are generally rigidly specified by the customer reflecting commonly accepted industrial practice. Usually, they refer to conditions that allow evaluation or comparison with reference values and often they refer to conditions that can be easily measured and/or corrected. For example, to allow for a proper comparison of specific impulse for several propellants or rocket propulsion systems, the values are often corrected to the following standard conditions (see Example 3–6):
 psia (6.894 MPa) or other agreed‐upon value.
 psia (0.10132 MPa) sea level.
- Nozzle exit area ratio, optimum,
 .
. - Nozzle divergence half angle
 ° for conical nozzles, or other agreed‐upon value.
 - Specific propellant, its design mixture ratio, and/or propellant composition and maximum allowed impurities.
- Propellant initial ambient temperature: 21°C (sometimes 20 or 25°C) or boiling temperature, if cryogenic.
A rocket propulsion system is generally designed, built, tested, and delivered in accordance with certain predetermined requirements or customer‐approved specifications found in formal documents (often called the rocket engine or rocket motor specifications). These may define the performance as shown above along with detailing many other requirements. More discussion of these specifications is given as a part of the selection process for propulsion systems in Chapter 19.
- Rocket manufacturers are often required by their customers to deliver rocket propulsion systems with a guaranteed minimum performance, such as minimum F and/or minimum Is. The determination of such values can be based on a nominal value (items 1, 2, or 3 above) diminished by all likely losses, including changes in chamber pressure due to variation of pressure drops in injector or pipelines, losses due to nozzle surface roughness, propellant initial ambient temperatures, ambient pressure variations, and manufacturing variations from rocket to rocket (e.g., in grain volume, nozzle dimensions, or pump impeller diameters, etc.). Minimum values can be determined by probabilistic evaluations of these losses, which are then usually validated by actual full‐scale static and flights tests.
3.6 NOZZLE ALIGNMENT
When the thrust vector direction of the propulsion system does not go through the center of mass of a flying vehicle, a turning moment exists that will rotate the vehicle while thrust is being applied. Predetermined controlled turning moments may be desirable and necessary for turning or for attitude control of the vehicle and can be accomplished by thrust vector deflections, aerodynamic fins, or by separate attitude control rocket engines. However, any turning becomes undesirable when its magnitude or direction is not known—this happens when a fixed nozzle in a major propulsion system has its thrust axis misaligned. A large high‐thrust booster rocket system, even if misaligned by a very small angle (less than 0.50°), can cause major and upsetting turning moments during firing. If not corrected or compensated, such a small misalignment can cause the flight vehicle to tumble and/or deviate from the intended flight path. For such turning moments not to exceed a vehicle's compensating attitude control capability, it is necessary to align very accurately the nozzle axis of each and all propulsion systems that contain fixed (nongimbaled) nozzles. Normally, the geometric axis of the nozzle diverging exit surface geometry is taken to be the thrust axis. Special alignment fixtures are needed to orient the nozzle axis to be within less than ± 0.25° of the intended line though the vehicle's center of gravity and to position the center of a large nozzle throat on the vehicle's centerline, say within 1 or 2 mm. See Ref. 3–15.
There are other types of misalignments: (1) irregularities in the nozzle geometry (out of round, protuberances, or unsymmetrical roughness in the surface); (2) transient flow misalignments during start or stop; (3) uneven deflection of the propulsion system or vehicle structure under load; and (4) irregularities in the gas flow (faulty injector, uneven burning rate in solid propellants). For simple unguided rocket vehicles, it has been customary to rotate (spin) the vehicle to prevent any existing misalignments from being in one direction only, evening out any misalignments during powered flight.
In the cramped volume of spacecraft or launch vehicles, it is sometimes not possible to accommodate the full length of a large‐area‐ratio nozzle within the available vehicle envelope. Nozzles of attitude control thrusters are sometimes cut off at an angle at the vehicle surface, which allows a more compact installation. Figure 3–16 shows a diagram of two (out of four) roll control thrusters whose nozzle exit conforms to the vehicle contour. The thrust direction of such a scarfed nozzle is no longer along the nozzle axis centerline, as it is with fully symmetrical nozzles, and the nozzle exit flow will not be axisymmetric. Reference 3–16 shows how to estimate the performance and thrust direction of scarfed nozzles.

Figure 3–16 Simplified partial section of a flight vehicle showing two attitude control thrusters with scarfed nozzles to fit a cylindrical vehicle envelope.
SYMBOLS
| A | area, m2 (ft2) |
| c | effective exhaust velocity, m/sec (ft/sec) |
| cp | specific heat at constant pressure, J/kg‐K (Btu/lbm‐°R) |
| cs | specific heat of solid phase, J/kg‐K (Btu/lbm‐°R) |
| specific heat at constant volume, J/kg‐K (Btu/lbm‐°R) | |
| characteristic velocity, m/sec (ft/sec) | |
| CF | thrust coefficient |
| CD | discharge coefficient (1/ |
| D | diameter, m (ft) |
| F | thrust, N (lbf) |
| g0 | standard sea‐level gravitational acceleration, 9.80665 m/sec2 (32.174 ft/sec2) |
| h | enthalpy per unit mass, J/kg (Btu/lbm) or altitude, km |
| Is | specific impulse, sec |
| J | mechanical equivalent of heat; |
| k | specific heat ratio |
| L | length of nozzle or liquid level distance above thrust chamber, m (ft) |
| propellant mass flow rate, kg/sec (lbm/sec) | |
| M | Mach number |
| molecular mass, kg/kg‐mol (lbm/lb‐mol) | |
| mass ratio | |
| ni | molar fraction of species i |
| p | pressure, N/m2 (lbf/ft2 or lbf/in.2) |
| R | gas constant per unit weight, J/kg‐K (ft‐lbf/lbm‐°R) ( |
| R′ | universal gas constant, 8314.3 J/kg mol‐K (1544 ft‐lb/lb mol‐°R) |
| T | absolute temperature, K (°R) |
| velocity, m/sec (ft/sec) | |
| V | specific volume, m3/kg(ft3/lbm) |
| propellant weight flow rate, N/sec (lbf/sec) |
Greek Letters
| α | half angle of divergent conical nozzle section |
| β | mass fraction of solid particles |
| ε | nozzle expansion area ratio A2/At |
| ηn | nozzle efficiency |
| thrust coefficient correction factor | |
| ζd | discharge or mass flow correction factor |
| ζF | thrust correction factor |
| velocity correction factor | |
| λ | divergence angle correction factor for conical nozzle exit |
Subscripts
| a | actual |
| g | gas |
| i | ideal, or a particular species in a mixture |
| max | maximum |
| opt | optimum nozzle expansion |
| s | solid |
| sep | point of separation |
| t | nozzle throat |
| x | any direction or section within rocket nozzle |
| y | any direction or section within rocket nozzle |
| 0 | stagnation or impact condition |
| 1 | nozzle inlet or combustion chamber |
| 2 | nozzle exit |
| 3 | atmospheric or ambient |
PROBLEMS
- Certain experimental results indicate that the propellant gases from a liquid oxygen–gasoline reaction have a mean molecular mass of 23.2 kg/kg‐mol and a specific heat ratio of 1.22. Compute the specific heats at constant pressure and at constant volume, assuming perfect‐gas relations apply.
- The actual conditions for an optimum expansion nozzle operating at sea level are given below. Calculate
 , T2, and CF. Use
  and the following parameters:
- A certain nozzle expands a gas under isentropic conditions. Its chamber or nozzle entry velocity equals 90 m/sec, its final velocity 1500 m/sec. What is the change in enthalpy of the gas? What percentage of error is introduced if the initial velocity is neglected?
- Nitrogen (
 , molecular
  ) flows at a Mach number of 2.73 and 500 °C. What are its local and acoustic velocities?
 - The following data are given for an optimum rocket propulsion system:
Determine (a) throat velocity; (b) specific volume at throat; (c) propellant flow and specific impulse; (d) thrust; (e) Mach number at the throat.Average molecular mass 24 kg/kg‐mol Chamber pressure 2.533 MPa External pressure 0.090 MPa Chamber temperature 2900 K Throat area 0.00050 m2 Specific heat ratio 1.30 - Determine the ideal thrust coefficient for Problem 5 by two methods.
- A certain ideal rocket with a nozzle area ratio of 2.3 and a throat area of 5 in.2 delivers gases at
 and
and  at a chamber pressure of 300 psia and a constant chamber temperature of 5300 °R against a back atmospheric pressure of 10 psia. By means of an appropriate valve arrangement, it is possible to throttle the propellant flow to the thrust chamber. Calculate and plot against pressure the following quantities for 300, 200, and 100 psia chamber pressure: (a) pressure ratio between chamber and atmosphere; (b) effective exhaust velocity for area ratio involved; (c) ideal exhaust velocity for optimum and actual area ratio; (d) propellant flow; (e) thrust; (f) specific impulse; (g) exit pressure; (h) exit temperature.
 - For an ideal rocket with a characteristic velocity
 , a nozzle throat diameter of 20 cm, a thrust coefficient of 1.38, and a mass flow rate of 40 kg/sec, compute the chamber pressure, the thrust, and the specific impulse.
 - For the rocket propulsion unit given in Example 3–2 compute the new exhaust velocity if the nozzle is cut off, decreasing the exit area by 50%. Estimate the losses in kinetic energy and thrust and express them as a percentage of the original kinetic energy and the original thrust.
- What is the maximum velocity if the nozzle in Example 3–2 was designed to expand into a vacuum? If the expansion area ratio was 2000?
- Construction of a variable‐area conventional axisymmetric nozzle has often been considered to operate a rocket thrust chamber at the optimum expansion ratio at any altitude. Because of the enormous difficulties of such a mechanical device, it has never been successfully realized. However, assuming that such a mechanism could eventually be constructed, what would have to be the variation of the area ratio with altitude (plot up to 50 km) if such a rocket had a chamber pressure of 20 atm? Assume that
 .
. - Design a supersonic nozzle to operate at 10 km altitude with an area ratio of 8.0. For the hot gas take
 , and
, and  . Determine the exit Mach number, exit velocity, and exit temperature, as well as the chamber pressure. If this chamber pressure is doubled, what happens to the thrust and the exit velocity? Assume no change in gas properties. How close to optimum nozzle expansion is this nozzle?
 - The German World War II A‐4 propulsion system had a sea‐level thrust of 25,400 kg and a chamber pressure of 1.5 Mpa. If the exit pressure is 0.084 MPa and the exit diameter 740 mm, what would be its thrust at 25,000 m?
- Derive Eq. 3–34. (Hint: Assume that all the mass flow originates at the apex of the cone.) Calculate the nozzle angle correction factor for a conical nozzle whose divergence half angle is 13°.
- Assuming that the thrust correction factor is 0.985 and the discharge correction factor is 1.050 in Example 3–2, determine (a) the actual thrust; (b) the actual exhaust velocity; (c) the actual specific impulse; (d) the velocity correction factor.
- An ideal rocket has the following characteristics:
Determine the critical pressure ratio, the gas velocity at the throat, the expansion area ratio, and the theoretical nozzle exit velocity.Answers: 0.5645; 3470 ft/sec; 14.8; and 8570 ft/sec.Chamber pressure 27.2 atm Nozzle exit pressure 3 psia Specific heat ratio 1.20 Average molecular mass 21.0 lbm/lb‐mol Chamber temperature 4200 °F - For an ideal rocket with a characteristic velocity
 of 1220 m/sec, a mass flow rate of 73.0 kg/sec, a thrust coefficient of 1.50, and a nozzle throat area of 0.0248 m2, compute the effective exhaust velocity, the thrust, the chamber pressure, and the specific impulse.Answer: 1830 m/sec; 133,560 N;
  ; 186.7 sec.
 - Derive Eqs. 3–24 and 3–25.
- An upper stage of a launch vehicle propulsion unit fails to meet expectations during sea‐level testing. This unit consists of a chamber at 4.052 MPa feeding hot propellant to a supersonic nozzle of area ratio
 . The local atmospheric pressure at the design condition is 20 kPa. The propellant has a
  and the throat diameter of the nozzle is 9 cm.
- Calculate the ideal thrust at the design condition.
- Calculate the ideal thrust at the sea‐level condition.
- State the most likely source of the observed nonideal behavior.Answer: (a) 44.4 kN, (b) 34.1 kN, (c) separation in the nozzle.
- Assuming ideal flow within some given propulsion unit:
- State all necessary conditions (realistic or not) for

- Do the above conditions result in an optimum thrust for a given p1/p3?
- For a launch vehicle designed to operate at some intermediate Earth altitude, sketch (in absolute or relative values) how
 , c, and
  would vary with altitude.
- State all necessary conditions (realistic or not) for
- A rocket nozzle has been designed with
 in.2 and
  in.2 to operate optimally at
  psia and produce 18,100 lbf of ideal thrust with a chamber pressure of 570 psia. It will use the proven design of a previously built combustion chamber that operates at
  with
with  and
and  , with a
  ‐efficiency of 95%. But test measurements on this thrust system, at the stated pressure conditions, yield a thrust of only 16,300 lbf when the measured flow rate is 2.02 lbm/sec. Find the applicable correction factors
  and the actual specific impulse assuming frozen flow throughout.Answers:
  .
. - The reason optimum thrust coefficient (as shown on Figs. 3–6 and 3–7) exists is that as the nozzle area ratio increases with fixed p1/p3 and k, the pressure thrust in Eq. 3–30 changes sign at
 . Using
  and
and  , show that as p2/p1 drops with increasing ε, the term
 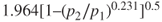 increases more slowly than the (negative) term
  increases (after the peak, where
  ). (Hint: use Eq. 3–25.)
REFERENCES
- 3–1. A. H. Shapiro, The Dynamics and Thermodynamics of Compressible Fluid Flow, Vols. 1 and 2, Ronald Press Company, New York, 1953; and M. J. Zucrow and J. D. Hoffman, Gas Dynamics, Vols. I and II, John Wiley & Sons, New York, 1976 (has section on nozzle analysis by method of characteristics).
- 3–2. M. J. Moran and H. N. Shapiro, Fundamentals of Engineering Thermodynamics, 3rd ed., John Wiley & Sons, New York, 1996; also additional text, 1997.
- 3–3. R. D. Zucker and O. Biblarz, Fundamentals of Gas Dynamics, 2nd ed., John Wiley & Sons, Hoboken, NJ, 2002.
- 3–4. R. Stark, “Flow Separation in Rocket Nozzles – an Overview”, AIAA paper 2013‐3849, July 2013.
- 3–5. G. Hagemann, H. Immich, T. Nguyen, and G. E. Dummov, “Rocket Engine Nozzle Concepts,” Chapter 12 of Liquid Rocket Thrust Chambers: Aspects of Modeling, Analysis and Design, V. Yang, M. Habiballah, J. Hulka, and M. Popp (Eds.), Progress in Astronautics and Aeronautics, Vol. 200, AIAA, 2004.
- 3–6. P. Vuillermoz, C. Weiland, G. Hagemann, B. Aupoix, H. Grosdemange, and M. Bigert, “Nozzle Design Optimization,” Chapter 13 of Liquid Rocket Thrust Chambers: Aspects of Modeling, Analysis and Design, V. Yang, M. Habiballah, J. Hulka, and M. Popp (Eds), Progress in Astronautics and Aeronautics, Vol. 200, AIAA, 2004.
- 3–7. “Liquid Rocket Engine Nozzles,” NASA SP‐8120, 1976.
- 3–8. J. A. Muss, T. V. Nguyen, E. J. Reske, and D. M. McDaniels, “Altitude Compensating Nozzle Concepts for RLV,” AIAA Paper 97‐3222, July 1997.
- 3–9. G. V. R. Rao, Recent Developments in Rocket Nozzle Configurations, ARS Journal, Vol. 31, No. 11, November 1961, pp. 1488–1494; and G. V. R. Rao, Exhaust Nozzle Contour for Optimum Thrust, Jet Propulsion, Vol. 28, June 1958, pp. 377–382.
- 3–10. J. M. Farley and C. E. Campbell, “Performance of Several Method‐of‐Characteristics Exhaust Nozzles,” NASA TN D‐293, October 1960.
- 3–11. J. D. Hoffman, Design of Compressed Truncated Perfect Nozzles, Journal of Propulsion and Power, Vol. 3, No. 2, March–April 1987, pp. 150–156.
- 3–12. G. P. Sutton, Stepped Nozzle, U.S. Patent 5,779,151, 1998; M. Ferlin, “Assessment and benchmarking of extendible nozzle systems in liquid propulsion,” AIAA Paper 2012‐4163, July/August 2012.
- 3–13. F. A. Williams, M. Barrère, and N. C. Huang, “Fundamental Aspects of Solid Propellant Rockets,” AGARDograph 116, Advisory Group for Aerospace Research and Development, NATO, October 1969, 783 pages.
- 3–14. M. Barrère, A. Jaumotte, B. Fraeijs de Veubeke, and J. Vandenkerckhove, Rocket Propulsion, Elsevier Publishing Company, Amsterdam, 1960.
- 3–15. R. N. Knauber, “Thrust Misalignments of Fixed Nozzle Solid Rocket Motors,” AIAA Paper 92–2873, 1992.
- 3–16. J. S. Lilley, “The Design and Optimization of Propulsion Systems Employing Scarfed Nozzles,” Journal of Spacecraft and Rockets, Vol. 23, No. 6, November–December 1986, pp. 597–604; and J. S. Lilley, “Experimental Validation of a Performance Model for Scarfed Nozzles,” Journal of Spacecraft and Rockets, Vol. 24, No. 5, September–October 1987, pp. 474–480.