
CHAPTER 12
SOLID PROPELLANT ROCKET MOTOR FUNDAMENTALS
This is the first of four chapters dealing exclusively with solid propellant rocket motors—the word motor is as common to solid propellants as the word engine is to liquid propellants. In this chapter, we cover burning rates, grain configurations, rocket motor performance, and structural issues. In solid propellant rocket motors the propellant is contained and stored directly within the combustion chamber, sometimes hermetically sealed for long‐time storage (5 to 20 years). Motors come in many different types and sizes, varying in thrust from about 2 N to over 12 million N (0.4 to over 3 million lbf). Historically, solid propellant rocket motors have been credited with having no moving parts. This is still true of many, but some rocket motor designs include movable nozzles and actuators for vectoring (rotating the line of thrust relative to the motor axis). But in comparison to liquid rockets, solid rockets are typically much simpler, are easy to attach (often constituting most of the vehicle structure), do not leak, are ready to ignite, and require little servicing; however, they cannot be fully checked out prior to use and for most applications thrust cannot be randomly varied in flight.
The subjects of thrust vector control, exhaust plumes, and testing are omitted from these four chapters but are treated for both liquid and solid propellant units in Chapters 18, 20, and 21, respectively. Chapter 19 provides a comparison of the advantages and disadvantages of solid and liquid propellant rocket units. Chapters 2 to 5 are needed as background for these four chapters on solid propellants.
Figures 1–5 and 12–1 depict the principal components and features of two relatively simple solid propellant rocket motors. The grain is the solid body of the hardened propellant and typically accounts for 82 to 94% of the total rocket motor mass. Designs and stress profiles for these grains are described later in this chapter and propellants and their properties are described in the next chapter. An electrically activated igniter is needed to start combustion. The propellant grain starts to burn on all its exposed inner surfaces. Combustion and ignition of solid propellants are discussed in Chapter 14. In Fig. 12–1 the grain configuration has a central cylindrical cavity with eight tapered slots, forming an eight‐pointed star cross section (a typical star cross section is shown later in Fig. 12–16). Many grains have slots, grooves, holes, or other geometric features that alter the initial burning surface and thus determine the initial mass flow rate and the initial thrust. Hot combustion gases flow along the perforation or port inside cavity toward the nozzle. The motor case body is either made of metal (such as steel, aluminum or titanium) or a composite fiber‐reinforced plastic material. Any inner surfaces of the case, which are exposed directly to hot gas, must have thermal protection or insulation layers to keep the case from overheating a condition when it would no longer being able carry its pressure and other loads.

Figure 12–1 Cross section of the STARTM 27 rocket motor, which has been used for orbit and satellite maneuvers. It has an altitude thrust of 6000 lbf, nominally burns for 34.4 sec and has an initial mass of 796 lbm. This motor is no longer used but is a good example of a simple, high‐performance, high‐mass‐ratio unit. For relevant data see Table 12–3.
(Courtesy of Orbital ATK.)
The motor's nozzle has the role of efficiently accelerating the hot gases issuing from the combustion chamber through its purposely shaped convergent–divergent passage (see Chapter 3). Nozzles are made of high‐temperature materials (usually a graphite and/or an ablative heat absorbing material to absorb the heat) to withstand the high‐temperatures and erosive environment. The majority of all solid rocket motors have a simple fixed nozzle, as shown, but some nozzles have provisions to slightly rotate them so as to allow vehicle steering. Variable throat area moveable plug nozzles (or “pintle nozzles”) have been developed but are as yet too complex for adoption. Chapter 15 describes nozzles, cases, insulators, liners, and the overall design of solid propellant rocket motors.
Each motor must be fastened to its vehicle by a thrust‐carrying structure. In Fig. 12–1 there is a skirt (with a flange) integral with the case; this mounting flange fastens to the vehicle. As indicated above, since there is no active cooling the rocket motor must be designed to withstand the transient heat loads without failure for the flight duration.
Applications for solid propellant rockets are listed in Tables 1–3 to 1–5, and 12–1, each having its own mission requirements and associated propulsion requirements. Figures 12–1 to 12–4 illustrate representative designs for some of the major categories of rocket motors listed in Table 12–1, namely, large booster or second stage, space flight motor, and tactical missile motor. Reference 12–1 is useful for component and design information. The Atlas V solid rocket strap‐on booster (SRB) shown in Fig. 12–2 is representative of a modern, large solid booster designed by Aerojet Rocketdyne. Depending on the payload, there can be up to five such boosters mounted in the manner shown in the sketch of Fig. 4–15 labeled parallel staging. Several SRBs can be seen in Fig. 1–13 boosting the Atlas V. In this motor the grain design is tubular with slots at the aft end; this style of grain corresponds to the third sketch from the top shown later on Fig. 12–16. The Atlas‐V propellant consists of aluminized hydroxyl‐terminated polybutadiene (HTPB)/ammonium perchlorate (AP) (see Chapter 13). Its case structure is a large, lightweight graphite‐fiber‐composite unit that, unlike the Shuttle's Solid Rocket Motors (SRM) (see Fig. 15–2), has no segments or joints. This motor has been designed with mechanical release device, which separate it from the space launch vehicle after SRB burnout. An erosion‐resistant internal insulation based on EPDM (ethylene propylene diene monomer, see Section 13.6.) has been used—EPDM is a low‐density rubber‐like material. In common with other SRMs, some inert material (i.e., nonpropellant) is ejected during the burn, such as small abraded particles of insulation, nozzle liner and throat insert, which have been decomposed, eroded, charred, and sometimes gasified during propellant burning; these can amount up to 1% of the propellant mass. In the Shuttle SRM the propellant mass fraction (see Eq. ) was 88.2%.

Figure 12–2 Atlas V solid rocket booster (SRB) cross‐sectional view. This motor has a large monolithic carbon‐composite case and other novel features representative of modern solid boosters. The grain has tapered aft slots.
(Courtesy of Aerojet Rocketdyne.)

Figure 12–3 Inertial upper‐stage (IUS) Orbus rocket motor with an extendible exit cone (EEC). This motor was used for propelling upper launch vehicle stages or spacecraft. The grain was simple (internal tube perforation). With the EEC and a thrust vector control, the motor had a propellant mass fraction of 0.916. When launched, and while the two lower vehicle stages were operating, the two conical movable nozzle segments were stowed around the smaller inner nozzle segment. Each of the movable segments was then deployed in space and moved into its operating position by three rotary actuators. The nozzle area ratio increased from 49.3 to 181; overall this improved the specific impulse by about 14 sec. This motor (without the EEC) is described in Table 12–3 and a similar motor is shown in Fig. 18–5.
(Courtesy of United Technologies Corp.)

Figure 12–4 Simplified cross section through a typical tactical motor. The blast tube allows the grain to be close to the center of gravity of the vehicle so it moves very little during motor operation. The nozzle is at the missile's aft end. The annular space around the blast tube is usually filled with guidance, control, and other nonpropulsive equipment. A freestanding grain with bonded external insulation (see Fig. 12–14) is loaded before the aft closure is assembled.
Table 12–1 Major Application Categories for Solid Propellant Rocket Motors
| Category | Application | Typical Characteristics |
| Large booster and second‐stage motors | Space launch vehicles; long‐range ballistic missiles (see Figs. 12–2 and 15–2) | Booster diameter (above 48 in.); L/D of |
| High‐altitude motors | Upper stages of multistage ballistic missiles; space launch vehicles; space maneuvers. See Figs. 12–1, 12–3 | High‐performance propellant; large nozzle area ratio (20–300); L/D of |
| Tactical missiles |
|
Tube launched, |
|
Small diameter (2.5–18 in.); L/D of |
|
| Ballistic missile defense | Defense against long‐ and medium‐range ballistic missiles. Two or three stages | Booster rocket motors; upper maneuverable stage with attitude control nozzles and a larger divert nozzle. Throttling liquid or solid propellant |
| Gas generator | Pilot emergency escape; push missiles from submarine launch tubes or land mobile canisters; actuators for TVC; short‐term power supply; jet engine starter; munition dispersion; rocket turbine drive starter; automotive air bags | Usually low gas temperature (<1300°C); many different configurations, designs, and propellants; purpose is to create high‐pressure, energetic gas rather than thrust |
| Solid propellant augmented artillery projectiles | Increase range of gun‐fired projectiles | Withstand very high acceleration in gun barrel transit (<20,000 g0) |
There are several ways of classifying solid propellant rocket motors. Some are listed in Table 12–2 together with their definitions. Table 12–3 gives characteristics for three specific rocket motors, and these data exemplify the magnitudes of key parameters. As is common in this field, Table 12–3 lists more than one value for thrust and chamber pressure—the maximum value is used to determine loads on structures and the average value is used in performance analyses. These motors are shown in Figs. 12–1, 18–5, and 18–9.
Table 12–2 Classification of Solid Rocket Motors
| Basis of Classification | Examples of Classification |
| Application | See Table 12–1. |
| Diameter/length | 0.005–6.6 m or 0.2–260 in./ 0.025–45 m or 1–1800 in. |
| Propellant. See Chapter 13 | Composite: Heterogeneous (physical) mixture of powdered metal (fuel), small crystal oxidizer and polymer binder |
| Double‐base: Homogeneous mixture (colloidal) of two explosives (nitroglycerin in nitrocellulose) | |
| Composite‐modified double‐base: Combines composite and double‐base ingredients | |
| Gas generator and others | |
| Case design | Steel monolithic: One‐piece steel case |
| Fiber monolithic: Filament wound (high‐strength fibers) with a plastic matrix | |
| Segmented: Case (usually alloy steel) and large grain are in segments which are transported separately and fastened together at launch site | |
| Grain configuration | Cylindrical: Cylindrically shaped, usually hollow |
| End‐burning: Solid cylinder propellant grain | |
| Other configurations: See Figs. 12–16 and 12–17 | |
| Grain installation | Case‐bonded: Adhesion exists between grain and case or between grain and insulation or liner and case; propellant is usually cast into the case |
| Cartridge‐loaded: Grain is formed separately from the motor case and then assembled into case | |
| Explosive hazard | Class 1.3: Catastrophic failure shows evidence of burning and explosion, not detonation |
| Class 1.1: Catastrophic failure shows evidence of detonation | |
| Thrust action | Neutral grain: Thrust remains essentially constant during the burn period. See Fig. 12–15 |
| Progressive grain: Thrust increases with time. See Fig. 12–15 | |
| Regressive grain: Thrust decreases with time. See Fig. 12–15 | |
| Pulse rocket: Two independent thrust pulses or burning periods | |
| Step‐thrust rocket: Usually, two distinct levels of thrust | |
| Toxicity | Toxic and nontoxic propellant and exhaust gases |
Table 12–3 Characteristics of a Missile Motor and Two Space Motors
| Characteristic | First‐Stage Minuteman I Missile Motora | Orbus‐6 Inertial Upper‐Stage Motorb | STARTM 27 Apogee Motora |
| Motor Performance (70°F, sea level) | |||
| Maximum thrust (lbf) | 201,500 | 23,800 | 6,404 (vacuum) |
| Burn timec average thrust (lbf) | 194,600 | 17,175 | 6,010 (vacuum) |
| Action timec average thrust (lbf) | 176,600 | 17,180 | 5,177 (vacuum) |
| Maximum chamber pressure (psia) | 850 | 839 | 569 |
| Burn time average chamber pressure (psia)c | 780 | 611 | 552 |
| Action time average chamber pressure (psia)c | 720 | 604 | 502 |
| Burn time/action time (sec)c | 52.6/61.3 | 101.0/103.5 | 34.35/36.93 |
| Ignition delay time (sec) | 0.130 | 0.076 | |
| Total impulse (lbf‐sec) | 10,830,000 | 1,738,000 | 213,894 |
| Burn time impulse (lbf‐sec) | 10,240,000 | 1,737,000 | |
| Altitude specific impulse (sec) | 254 | 289.6 (vacuum) | 290.8 (vacuum) |
| Temperature limits (°F) | 60–80 | 45–82 | 20–100 |
| Propellant | |||
| Composition: | |||
| NH4ClO4 (%) | 70 | 68 | 72 |
| Aluminum (%) | 16 | 18 | 16 |
| Binder and additives (%) | 14 | 14 | 12 |
| Density (lbm/in.3) | 0.0636 | 0.0635 | 0.0641 |
| Burning rate at 1000 psia (in./sec) | 0.349 | 0.276 | 0.280 |
| Burning rate exponent | 0.21 | 0.3–0.45 | 0.28 |
| Temperature coefficient of pressure (% °F) | 0.102 | 0.09 | 0.10 |
| Adiabatic flame temperature (°F) | 5790 | 6150 | 5,909 |
| Characteristic velocity (ft/sec) | 5180 | 5200 | 5,180 |
| Propellant Grain | |||
| Type | Six‐point star | Central perforation | Eight‐point star |
| Propellant volume (in.3) | 709,400 | 94,490 | 11,480 |
| Web (in.) | 17.36 | 24.2 | 8.17 |
| Web fraction (%) | 53.3 | 77.7 | 60 |
| Sliver fraction (%) | 5.9 | 0 | 2.6 |
| Average burning area (in.2) | 38,500 | 3905 | 1,378 |
| Volumetric loading (%) | 88.7 | 92.4 | 92.6 |
| Igniter | |||
| Type | Pyrogen | Pyrogen | Pyrogen |
| Number of squibs | 2 | 2 through‐the‐bulkhead initiators | 2 |
| Minimum firing current (A) | 4.9 | NA | 5.0 |
| Weights (lbf) | |||
| Total | 50,550 | 6515 | 796.3 |
| Total inert | 4719 | 513 | 60.6 |
| Burnout | 4264 | 478 | 53.4 |
| Propellant | 45,831 | 6000 | 735.7 |
| Internal insulation | 634 | 141 | 12.6 |
| External insulation | 309 | 0 | 0 |
| Liner | 150 | Incl. with insulation | 0.4 |
| Igniter | 26 | 21 | 2.9 (empty) |
| Nozzle | 887 | 143 | 20.4 |
| Overall length (in.) | 294.87 | 72.4 | 48.725 |
| Outside diameter (in.) | 65.69 | 63.3 | 27.30 |
| Case | |||
| Material | Ladish D6AC steel | Kevlar fibers/epoxy | 6 A1‐4V titanium |
| Nominal thickness (in.) | 0.148 | 0.35 | 0.035 |
| Minimum ultimate strength (psi) | 225,000 | — | 165,000 |
| Minimum yield strength (psi) | 195,000 | — | 155,000 |
| Hydrostatic test pressure (psi) | 940 | <1030 | 725 |
| Hydrostatic yield pressure (psi) | 985 | NA | 767 |
| Minimum burst pressure (psi) | — | 1225 | — |
| Typical burst pressure (psi) | — | >1350 | — |
| Liner | |||
| Material | Polymeric | HTPB system | TL‐H‐304 |
| Insulation | |||
| Type | Hydrocarbon– | Silica‐filled | Polyisoprene |
| asbestos | EPDM | ||
| Density (lbm/in.3) | 0.0394 | 0.044 | 0.044 |
| Nozzle | |||
| Number and type | 4, movable | Single, flexible | Fixed, contoured |
| Expansion area ratio | 10:1 | 47.3:1 | 48.8/45.94 |
| Throat area (in.2) | 164.2 | 4.207:1 | 5.900 |
| Nozzle exit cone half angle (deg) | 11.4 | Initial 27.4, | Initial 18.9, |
| Final 17.2 | Exit 15.5 | ||
| Throat insert material | Forged tungsten | 3D carbon–carbond | 3D carbon–carbond |
| Shell body material | AISI 4130 steel | NA | NA |
| Exit cone material | NA | 2D carbon–carbond | Carbon phenolic |
a Courtesy of Orbital ATK.
b Courtesy United Technologies Corp., there is also a version Orbus‐6 E (see Fig. 12–3) with an extendible, exit nozzle; it has a specific impulse of 303.8 sec, a total weight of 6604 lbf and a burnout weight of 567 lbf.
c Burn time and action time are defined in Fig. 12–13.
NA: not applicable or not available.
d 2D and 3D carbon‐carbon refer to “two‐directional and three‐directional” reinforcements.
Nearly all rocket motors are used only once. Any hardware that remains after all the propellant has been burned and the mission has been completed—namely, the nozzle, case, and/or thrust vector control device—is not made to be reusable. In very rare applications, such as NASA's Space Shuttle solid booster, was the hardware recovered, cleaned, refurbished, and reloaded with new propellant; reusability makes the design more complex, but if the hardware is to be reused often enough a major cost saving will result. Unlike some liquid propellant rocket engines, a solid propellant rocket motor and its key components cannot be operationally pretested. As a result, individual motor reliability must be inferred by assuring its structural integrity and by verifying the manufactured quality on entire populations of motors.
Solid propellant rocket motor technologies have remained relatively mature in the last 10 years since many U.S. operational systems use designs developed in the 1970s (Ref. 12–1). Structural materials for motor cases and nozzles continue to be improved (Ref. 12–3) but high‐energy propellants appear to be near their practical limits. There are many more solid propellant rocket motors than liquid propellant engines (presently, over one million worldwide mostly in tactical military applications compared to a few thousand liquid propellant rocket engines worldwide).
12.1 BASIC RELATIONS AND PROPELLANT BURNING RATE
A rocket motor's operation and its design depend on the propellant's combustion characteristics such as burning rate, burning surface, and grain geometry. The branch of applied science describing these is known as internal ballistics; a treatment of the first two follows and effects of grain geometry are treated in Section 12–3.
The burning surface of a propellant grain recedes in a direction essentially perpendicular to it. The rate of regression, usually expressed in cm/sec, mm/sec, or in./sec, is the burning rate r. In Fig. 12–5, we show changes of the grain geometry by drawing successive burning surfaces at a constant time interval between adjacent surface contours. Figure 12–5 depicts this for a two‐dimensional grain with five slots residing in a central cylindrical cavity. Success in rocket motor design and development depends significantly on knowledge of burning rate behavior of the selected propellant under all motor operating conditions and design limits. Burning rate is a function of the propellant composition. For composite propellants (see Chapter 13) it can be increased by changing the propellant characteristics as follows:
- Add a burning rate catalyst, often called burning rate modifier (0.1 to 3.0% of propellant) or increase percentage of existing catalyst.
- Decrease the oxidizer particle size.
- Increase oxidizer percentage.
- Increase the heat of combustion of the binder and/or the plasticizer.
- Imbed wires or metal staples in the propellant.

Figure 12–5 Diagram of successive burning surface contours, each a fixed small time interval apart. It shows how the internal cavity grows. When the lengths of these contour lines are roughly the same (within ±15%), the burning area is considered to be constant. The burning surface area Ab diminishes greatly near the end causing reduced thrust and chamber pressure. When the pressure falls below the conflagration value, combustion will stop leaving some unburnt propellant (slivers).
For any given propellant formulation the burning rate can be increased or otherwise modified by the following:
- Higher temperatures of solid propellant prior to start
- Higher combustion gas chamber pressures
- Higher combustion gas temperatures
- Higher gas flow velocities parallel to its burning surface
- Rocket motor motions (acceleration and spin‐induced grain stress)
All these influencing factors are separately discussed in this chapter. An explanation for the behavior of the burning rate with various parameters is largely based on the combustion mechanisms of solid propellants, which are treated in Chapter 14. Analytical models for the burning rate and the combustion process in general exist and are useful for preliminary design and for extending existing test data; for detailed designs and for evaluation of new or modified propellants, some actual test data is necessary. Burning rate data are usually obtained in three ways—namely, from testing by:
- Standard strand burners, often called Crawford burners
- Small‐scale ballistic evaluation motors
- Full‐scale rocket motors, properly instrumented
A strand burner is a small pressure vessel (usually with windows) in which a thin strand or bar of propellant is ignited at one end and burned to completion. The strand can be inhibited with an external nonflammable coating so that it will burn only on the exposed cross‐sectional surface; chamber pressure is simulated by pressurizing the container with an inert gas. Burning rates can be measured by electric signals from embedded wires, by ultrasonic waves, or by optical means. The burning rate measured on strand burners is usually lower than that obtained from full‐scale motor firing (by 4 to 12%) because it does not completely simulate the hot chamber environment. Small ballistic evaluation motors usually also have a slightly lower burning rate than full‐scale larger motors because of scaling factors. The relationship between these three types of measured burning rates must be determined empirically for each propellant category and grain configuration. Strand burner data are useful in screening propellant formulations and in quality control operations. Because of their cost advantage, strand burners and other substitutes for full‐scale motor tests are used to explore as many needed variables as practicable but data from full‐scale rocket motors tested under a variety of conditions constitute the best and final proof of burning rate behavior.
During development, a new or modified solid propellant is extensively examined or characterized. This includes burn rate testing (in several different ways) under different temperatures, pressures, and impurity conditions. Characterization also includes measurements of physical and chemical properties, as well as manufacturing properties, ignitability, aging, sensitivity to various energy inputs or stimuli (e.g., shock, friction, and fires), moisture absorption, and compatibility with other materials (liners, insulators, cases). Characterization is a lengthy, expensive, and often hazardous process involving many tests, samples, and studies.
The burning rate of propellants in a motor is a function of several parameters; at any instant of time the mass flow rate ![]() of the hot gases generated and flowing from the motor is given by:
of the hot gases generated and flowing from the motor is given by:
Here, Ab is the propellant grain burning area, r the burning rate, and ρb the solid propellant density prior to motor ignition. The total effective mass m of propellant burned is determined by integrating Eq. 12–1:
Here, Ab and r may vary with time (and pressure), but not ρb. Grains can also be designed for Ab to remain essentially constant (within ±15%).
Mass Flow Relations
A first basic performance relation comes from the principle of conservation of matter. The gaseous propellant mass evolving from a burning surface per unit time must equal the sum of the change in gaseous mass storage per unit time in the combustion chamber (due to increases in volume of the grain cavity) and the mass flowing out through the exhaust nozzle per unit time,
The left side of the equation represents the rate of gas generation from Eq. 12–1. The first term on the right represents the rate of change in storage of the hot gas in the combustion chamber volume, and the last term represents the propellant flow rate through the nozzle according to Eqs. 3–24 and 3–32. Note that ρb is the solid propellant density whereas ρ1 is the chamber hot‐gas density and that here in derivative form V1 represents the rate of increase chamber gas cavity volume; At is the nozzle throat area; p1 the chamber pressure; c* is the characteristic velocity (which is proportional to T1, the absolute chamber temperature found from the thermochemistry for a given propellant); and k is the specific heat ratio of the combustion gases (see Eq. 3–32). Equation 12–3 is most useful in numerical solutions of transient conditions, such as during start‐up or shutdown. Though the rate of change of hot gas in the grain cavity is always important during start‐up, it is seldom included in preliminary designs.
The magnitude of the burning surface Ab may or may not change significantly with time and this is a function of grain design as described in Section 12.3. For preliminary performance calculations, the nozzle throat area At is usually taken as constant (Eqs. 3–24, 3–32, 12–3, or 12–4) for the entire burning duration but, for accurate performance predictions during hot firings, it is necessary to account for oxidation, erosion and abrasion in the nozzle material which increases the nozzle throat area as the propellant burns; such nozzle enlargements are usually small (0.05 to 5%) as described in Section 15.2. With time, as the throat area enlarges a noticeable decrease of chamber pressure, burning rate, and thrust ensues.
The chamber gas volume V1 will measurably increase with burn time. But to fill this void requires relatively small amounts of gaseous propellant mass compared to what flows through the nozzle (the volume change of a unit of mass is about 1000 to 1 as the propellant gasifies during the combustion). As a result, the term d(ρ1V1)/dt can usually be neglected except for very short operating durations. This then yields the commonly used relation for the pressure in steady burning:
Here, K is an important new dimensionless motor parameter, the ratio of burning area to nozzle throat area, which has typical values much larger than one. For steady flow and steady burning the value of K (or Ab) must remain essentially constant. When noticeable abrasion/erosion takes place during burning, values of K listed must be interpreted as “initial area ratios.” Equation 12–4 by itself does not properly represent most of the observed dependence of r on Tb and p1 so an additional equation for the burning rate is introduced; this equation is empirical and is discussed next.
Burning Rate Relation with Pressure
Classical relations describing the burning rate are empirical generalizations helpful in data extrapolation and in understanding the phenomena involved. Though useful in preliminary design, they can only deal with the influence of some of the important parameters. However, strict analytical modeling and supportive research have yet to adequately predict the burning rate of a new propellant in a new rocket motor. Unless otherwise stated, the burning rates specified here are based on an ambient temperature of 70°F or 294 K for the propellant grain (prior to ignition) and a reference chamber operating pressure of 1000 psia or 6.895 MPa.
With many propellants it is possible to approximate the burning rate as a function of chamber pressure, at least over a limited range of chamber pressures. A log–log set of plots is shown in Fig. 12–6. For a majority of production‐type propellants the most commonly used empirical equation is
where r, the burning rate, is in mm/sec or in./sec and the chamber operating pressure p1 is in MPa or psia. Known as the temperature coefficient, a is an empirical constant influenced by the ambient grain temperature (Tb)—the dimensions of a are defined by those of the other terms in Eq. 12–5. The burning rate exponent n (a pure number), sometimes also called the pressure exponent or the combustion index, is taken to be independent of the propellant initial temperature but influences the chamber operating pressure and the burning rate. For combustion stability ![]() (see Ref. 12–4), otherwise, when n > 1.0, any pressure disturbances present will be amplified in the chamber. Equation 12–5 applies to all commonly used double‐base, composite, or composite double‐based propellants, several of which are described in the next chapter. While changes in ambient grain temperature (Tb) do not alter the propellant's chemical energy available for release during combustion, they do change the rate of reaction at which the energy is released and have a slight effect on c* through changes in T1.
(see Ref. 12–4), otherwise, when n > 1.0, any pressure disturbances present will be amplified in the chamber. Equation 12–5 applies to all commonly used double‐base, composite, or composite double‐based propellants, several of which are described in the next chapter. While changes in ambient grain temperature (Tb) do not alter the propellant's chemical energy available for release during combustion, they do change the rate of reaction at which the energy is released and have a slight effect on c* through changes in T1.

Figure 12–6 Calculated burning rates versus chamber pressure for several typical solid rocket propellants, some at three different ambient grain temperatures. A particular double‐base (DB) plateau propellant shows constant burning rate over a wide pressure range.
The curves shown in Fig. 12–6 are calculated over limited pressure ranges of interest and appear as straight lines on a log–log plot; however, most actual burning rates deviate somewhat from such linearity and the actual data display slight bending in parts of the curve as the pressure range increases, as seen in the samples of Fig. 12–7. While analyses for production propellants are based on data such as shown in Fig.12–7, preliminary design and comparative analyses use the linear versions shown in Fig.12–6. For any particular propellant and for wide temperature and pressure limits, the burning rate can vary by factors of 3 or 4. For all propellants this translates to a range from about 0.05 to 75 mm/sec or 0.02 to 3 in./sec; the higher values being presently difficult to obtain. To achieve such rates, combinations of very small sized ammonium perchlorate (AP), burning rate catalysts, additives, or embedded metal wire are needed.

Figure 12–7 Measured burning rate characteristics of a double‐base (DB) propellant and three composite‐modified double‐base (CMDB) propellants that contain an increasing percentage of small‐diameter (159‐µm) particles of ammonium perchlorate (AP). When the size of the AP particles is reduced or the percentage of AP is increased, an increase in burning rate is observed.
(Reproduced with permission of the AIAA from Chapter 1 of Ref. 12–4.)
Inserting Eq. 12–5 into Eqs. 12–4 and 12–1, we may now write K and the generated mass flow rate as
From inspection of the results in the Example 12–1 or from Eq. 12–7, it can be seen that the hot gas flow rate is quite sensitive to the exponent n. High values on n give rapid changes of burning rate with pressure. This implies that even an ordinarily small variation in chamber pressure can induce substantial changes in the amount of hot gas produced. Most commercially available propellants have a pressure exponent n ranging between 0.2 and 0.6. As n approaches 1.0, the burning rate and chamber pressure become very sensitive to one another and a disastrous rise in chamber pressure may occur in only a few milliseconds. On the other hand, a propellant having a pressure exponent of zero displays essentially zero change in burning rate over a wide pressure range. Plateau propellants is the name given to those that exhibit nearly constant burning rate over a limited pressure range, and they are desirable for minimizing effects of changes in initial temperature on motor operation as described in the next section. One plateau propellant is shown as a horizontal dashed line in Fig. 12–6. These propellants are only insensitive to changes in chamber pressure over a limited range. Several double‐based propellants and a few composite propellants are known have this desirable plateau characteristic. Table 13–1 lists nominal burning rates r and pressure exponents for several operational (production) propellants.
Burning Rate Relation with Ambient Temperature (Tb)
Because temperature influences chemical reaction rates, the initial (i.e., prior to combustion) or ambient temperature of a propellant (Tb) noticeably changes the burning rate as shown in Figs. 12–6 and 12–8. Common practice in developing and testing larger rocket motors is to “condition” the motor for many hours at a particular temperature before ground‐test firing it to ensure that the propellant grain is uniformly at the desired temperature since rocket motor performance characteristics must stay within specified acceptable limits. For air‐launched missile motors the extremes are usually 219 K (−65°F) and 344 K (160°F) and for silo or submarine launched motors 266 K (20°F) to 300 K (80°F). Motors using typical composite propellant mixtures may experience a 20 to 35% variation in chamber pressure and a 20 to 30% variation in operating time over such a range of propellant temperatures (see Fig. 12–8). In large rocket motors, an uneven heating of the grain (e.g., by the sun heating on one side) may cause a sufficiently large difference in burning rate so that noticeable thrust misalignments can result (see Ref. 12–5). Thus, effects of ambient temperature on motor performance are of some importance and a discussion of this topic is necessary to understand solid propellant behavior.

Figure 12–8 Effect of propellant initial temperature on burning time and chamber pressure in a particular motor. The integrated areas under the curves are proportional to the total impulse, which is the same for the three curves.
The sensitivity of the burning rate to propellant temperature can be expressed in the form of temperature coefficients, the two most common being
with σp known as the temperature sensitivity of burning rate, expressed as the change of burning rate per degree change in propellant ambient temperature at a fixed value of chamber pressure, and πK known as the temperature sensitivity of pressure expressed as the change of chamber pressure per degree change of propellant ambient temperature at a particular value of K. Here, K is the geometric factor introduced earlier, namely, the ratio of the burning surface Ab to the nozzle throat area At.
The coefficient σp for a new propellant is usually found from strand burner test data, and πK is usually found from small‐scale or full‐scale motors. Values of σp typically range between 0.001 and 0.009 per °C, or 0.002 and 0.04 per °F, and for πK they range between 0.00067 and 0.0027 per °C, or 0.0012 and 0.005 per °F. Since these sensitivity coefficients are small numbers, Eqs. 12–8 and 12–9 are sometimes written in terms of differences for more convenient manipulation. Furthermore, when πK remains sufficiently constant over the temperature interval of interest, we may integrate Eq. 12–9 at constant K for the pressure and obtain a useful equation for predicting chamber pressure excursions with ambient temperature changes from any given or defined reference condition, subscripted as 0 (i.e., p01 and T0b):
Values of σp and πK depend primarily on the nature of the propellant burning rate, the composition, and the combustion mechanisms of the propellant. Because of variations in manufacturing tolerances act in addition to changes of ambient temperature, it is not simple to predict motor performance. Both sensitivity coefficients above are used for setting temperature limits and maximum pressures for a given rocket motor. Reference 12–5 reports on an analysis for predicting burning time.
In order to arrive at a relationship between the two sensitivity coefficients introduced above, Eq. 12–5 is rewritten in log‐form and then derivatives are taken under the assumption that the coefficient a depends only on Tb and that n and K are constant:

hence
Next Eq. 12–6 is solved for p1 and written in log‐form. Its ambient temperature derivative is then taken, keeping the second term in the right‐hand‐side brackets as constant:
hence
Note that this results from taking the entire product Kρbc* as constant in Tb which involves more than the geometry factor K (i.e., chamber temperature, propellant density, and composition do not change); according to Eq. 12–4, a good indicator for the constancy of Kρbc* in any data is how constant the ratio p1/r remains during measurements. Since σp is an often tabulated material/propellant property, Eq. 12–14 shows how πK may be obtained from σp and this highlights a strong dependence of πK on burning rate exponent n values near one. Both these conclusions hinge on the assumption that the two sensitivities do remain unchanged over limited temperature and pressure ranges.
In the example above, the variation of chamber pressure is shown to affect both the thrust and burning time of the rocket motor. Between warm or cold grain operations, the thrust can easily vary by a factor of 2 and this may cause significant changes of flight performance during atmospheric flight (because of differences in drag and in the vehicle's flight path). Thrust and chamber pressure increases become more pronounced as n approaches one; the least variations in thrust or chamber pressures occur at small n's (0.2 or less) and with relatively low temperature sensitivities.
Variable Burning Rate Exponent n
A close look at burning rate data (e.g., Fig. 12–7) indicates that n in Eq. 12–5 may not be really constant but a function of p1 (which indirectly makes it also a function of Tb). Here, it may no longer be possible to accurately predict the pressure excursions with ambient temperature changes using Eq. 12–10; this can be seen from Eq. 12–14 by noting that in the constant‐n case πK depends only on a material/propellant property (σp) and on n. An upward concavity in the propellant burning rate data may result in larger excursions of chamber pressure than constant‐n cases would predict. The opposite would hold true for a downward concavity. Such variations may be accommodated by piecewise curve fitting the data with constant n values in preselected ranges of interest (see Ref. 12–5), provided the pressure increments in these curve fits are small enough.
When the piecewise constant‐burning‐rate‐exponent n approach is not satisfactory, a useful approach would be to assume that n depends only on p1, keeping all previous dependences intact (retaining a in Eq. 12–5 as the only function of Tb). This then can be shown to imply that πK (a rocket motor parameter) becomes now a function of p1 and that the differential relation shown below needs to be solved:
The above reverts to the form of Eq. 12–14 when n is constant. Results from Eq. 12–15 depend on having suitable (empirical) information on n as a function of p1. In order to obtain an explicit relation for p1 that reflects ambient temperature changes with the influence of a variable n, we introduce Eq. 12–9 and solve (keeping K, ρb and c * constant):
or
which appropriately reverts back to the form of Eq. 12–10 when n is unchanging. Note that because n has been assumed only a function of p1, values of n may be obtained at any Tb from available burning rate data as a function of chamber pressure for the propellant in question (provided that the variation of n with p1 is monotonic over the interval). The nonexplicit nature of Eq. 12–16 is such that it will require several trials to solve it, for example, first, let n = n0 and find p1 (which is equivalent to just getting the constant‐n constant‐K solution), then update n at this new pressure from the relevant empirical information and repeat solving Eq. 12–16 until the solution converges for the new ambient temperature; Problem 11 provides an application for this procedure; another approach would be to introduce a polynomial fit for n as a function of p1 into Eq. 12–6. As to results, with ![]() and for given values of σp and p01, when
and for given values of σp and p01, when ![]() the final chamber pressure will be greater than that resulting from Eq. 12–10 and when
the final chamber pressure will be greater than that resulting from Eq. 12–10 and when ![]() the final chamber pressure will be less. While these trends are consistent with intuition, any quantitative inferences must be tempered by the nature of the above assumptions. As stated earlier, Eq. 12–5 is only approximately met for many solid propellants.
the final chamber pressure will be less. While these trends are consistent with intuition, any quantitative inferences must be tempered by the nature of the above assumptions. As stated earlier, Eq. 12–5 is only approximately met for many solid propellants.
Burning Enhancement by Erosion
Erosive burning refers to any increase in the propellant burning rate caused by the high‐velocity flow of combustion gases across the burning propellant surface. It can seriously affect the performance of solid propellant rocket motors. It occurs primarily in port passages or in grain perforations as the combustion gases flow toward the nozzle; it is more likely to occur when the port passage cross‐sectional area A is not large relative to the throat area At, with a port‐to‐throat area ratio of 4 or less. High‐velocity gases near the burning surface and their turbulent mixing in the boundary layers increase the heat transfer to the solid propellant and thus increase the burning rate. Chapter 10 of Ref. 12–5 surveys some 29 different theoretical analytical treatments and a variety of experimental techniques aimed at a better understanding of erosive burning.
Erosive burning raises chamber pressure and thrust during the early portion of the burning, as shown in Fig. 12–9. As soon as burning enlarges the flow passage (without a major increase in burning area), the port area flow velocity is reduced and erosive burning diminishes until normal burning will again occur. Since propellant has been consumed more rapidly during the early erosive burning, there is also a reduction of burning time, and of flow and thrust at the end of burning. Erosive burning (defined in Section 12.3 and Ref. 12–7) also causes an early burnout of the web; for certain grain configurations, early web burnouts cause it to lose structural integrity resulting in thin web breakups which produce pieces of unburned propellant that are ejected thru the nozzle. Erosion can also occur at or near the end of the burning period with grains designed for progressive burning (see Figs. 12–15 and 16) where the burning area is intentionally designed to increase in order to raise thrust and chamber pressure shortly before thrust termination. In general, only mild erosion can be tolerated and, in designing rocket motors, erosive burning is either avoided or controlled to be reproducible from one motor to the next. Correlations of erosive burning data are discussed in Ref. 12–8.

Figure 12–9 Typical simplified pressure–time curve with and without erosive burning.
A relatively simple model for erosive burning, based on heat transfer (see Section 8.5), was first developed in 1956 by Lenoir and Robillard and has since been improved and used widely in motor performance calculations. It is based on adding together two burn rates: r0, which is primarily a function of pressure and ambient grain temperature (basically Eq. 12–5) without erosion, and re, the increase in burn rate due to gas erosion:
Here, G is the mass flow velocity per unit area in kg/m2‐sec, D is a characteristic dimension of the port passage (usually, ![]() , where Ap is the port area and S is its perimeter), ρb is the density of the unburned propellant (kg/m3), and α and β are empirically constants. Apparently, β is independent of propellant formulation and has a value of about 53 when r is in m/sec, p1 is in pascals, and G is in kg/m2‐sec. An expression of α has been determined from convective heat transfer considerations to be
, where Ap is the port area and S is its perimeter), ρb is the density of the unburned propellant (kg/m3), and α and β are empirically constants. Apparently, β is independent of propellant formulation and has a value of about 53 when r is in m/sec, p1 is in pascals, and G is in kg/m2‐sec. An expression of α has been determined from convective heat transfer considerations to be
Here cp is the average specific heat at constant pressure of the combustion gases in kcal/kg‐K, μ the gas viscosity in kg/m‐sec, Pr the dimensionless Prandtl number (μcp/k) based on the molecular properties of the gases, k the thermal conductivity of the gas, cs the heat capacity of the solid propellant in kcal/kg‐K, T1 the combustion gas reaction absolute temperature, Ts the solid propellant surface temperature, and Tb the initial ambient temperature within the solid propellant grain.
Figure 12–10 shows the augmentation ratio r/r0, or the ratio of the burning rate with and without erosive burning, as a function of gas velocity for two similar propellants, one of which has an iron oxide burn rate catalyst. Augmentation ratios up to 3 can be found in some motor designs. There is a pressure drop from the forward end to the aft end of the port passage, because static pressure is being converted to kinetic gas energy as the flow is accelerated. This pressure differential during erosive burning causes an extra axial load and deformation on the grain, which must be considered in the stress analysis. Erosion rates or burn rate augmentations are not the same throughout the length of the port passage. Erosion is increased locally by flow turbulence resulting from discontinuities such as protrusions, edges of inhibitors, structural supports, or gaps between segmented grains.

Figure 12–10 Effect of gas velocity in the perforation or grain cavity on the erosive burning augmentation factor, which is the burning rate with erosion r divided by the burning rate without erosion r0 for two composite propellants.
(Reproduced with permission of the AIAA from Chapter 10 of Ref. 12–6.)
Other Burning Rate Enhancements
Enhancement of the burning rate can be expected in vehicles that spin the rocket motor about its longitudinal axis (necessary for spin‐stabilized flight) or that have high lateral or longitudinal accelerations, as typical in antimissile rockets. These effects have been experienced with a variety of propellants, with and without aluminum fuel, where propellant formulation is one of the controlling variables (see Fig. 12–11). Whether acceleration comes from spin or longitudinal forces, burning surfaces that form an angle of 60 to 90° with the acceleration vector are most prone to burning rate enhancement. For example, spinning cylindrical internal burning grains are heavily affected. The effect of spin on a motor with an operational composite propellant internal burning grain is shown in Fig. 12–12. Accelerated burning behavior of candidate propellants for new motor designs is often determined in small‐scale motors, or with a test apparatus that subjects burning propellant to acceleration (Refs. 12–9 and 12–10). Any stresses induced by rapid acceleration or rapid chamber pressure rises may cause cracks to develop (see Ref. 12–11), which then expose additional burning surfaces.

Figure 12–11 Acceleration effect on burning rate for three different propellants. See Ref. 12–8 for symbols.
(Adapted with permission from Ref. 12–8.)

Figure 12–12 Effect of axial spin on the thrust–time behavior of a rocket motor with composite propellant using aluminum and PBAN (polybutadiene acrylonitrile) as fuels.
(Adapted with permission from Ref. 12–8.)
The embedding of wires or other metallic (good‐heat‐conductor) shapes in the propellant grain increases the burning rate. One technique used has several silver wires arranged longitudinally in an end‐burning grain (see Ref. 12–12). Depending on wire size and the number of wires per grain cross‐sectional area, the burning rate can easily be doubled. Aluminum wires are about half as effective as silver wires. Other forms of heat conductors have been wire staples (short bent wires) mixed with the propellant prior to the casting operation. The so‐called Sprint propellants achieved average burning rates of 3.6 in./sec at 2000 psi using staples.
Intense radiation emissions from the hot gases inside the grain cavity also transfer heat to the burning propellant surfaces. The more energetic radiation causes an increase in burning rate. Radiation from exhaust plumes (outside of the nozzle) and effects of particles in the gas are discussed in Chapter 20.
Combustion instability, also called oscillatory combustion, can affect the burning rate of the propellant because of increased heat transfer rates from the changing gas velocities and higher pressures. Combustion instabilities induced by structural vibrations at frequencies where the rocket motor has its highest response function have been reported and investigated in Ref. 12–18. Combustion instability is discussed in Chapter 14.
12.2 OTHER PERFORMANCE ISSUES
Parameters that govern the burning rate and mass discharge rate of motors are called internal ballistic properties; these include r, K, σp, πK, along with their dependence on pressure, propellant ingredients, gas velocity, and/or acceleration. The remaining solid propellant rocket parameters are performance parameters; these include thrust, ideal exhaust velocity, specific impulse, propellant mass fraction, flame temperature, equipment temperature limits, and duration.
The ideal nozzle exhaust velocity of a solid propellant rocket is described by the thermodynamics as given by Eqs. 3–15 and 3–16. As explained in Chapter 5, Eq. 3–16 holds only for frozen equilibrium conditions; for shifting equilibrium the exhaust velocity is best found in terms of the enthalpy drop (![]() ), and computed from
), and computed from ![]() . Here, it is assumed that the approach velocity of gases upstream of the nozzle is small and can be neglected. This is true if the port area Ap (the flow area of gases between and around the propellant grains) is sufficiently large compared to the nozzle throat area At, i.e., when the port‐to‐throat‐area ratio Ap/At is greater than about 4.
. Here, it is assumed that the approach velocity of gases upstream of the nozzle is small and can be neglected. This is true if the port area Ap (the flow area of gases between and around the propellant grains) is sufficiently large compared to the nozzle throat area At, i.e., when the port‐to‐throat‐area ratio Ap/At is greater than about 4.
Internal material erosion always causes a small decrease in performance. This erosion is usually highest at the nozzle throat where the diameter may grow by 0.01 to 0.15 mm/sec. during rocket operation. This enlargement depends on the propellant exhaust gases, any solid particles embedded in the flow, and on the nozzle material. Any nozzle‐expansion area ratio reduction decreases rocket motor performance. In rocket motor specifications, delivered specific impulse is labeled the effective specific impulse and it is somewhat lower than the initial or theoretical specific impulse (the total‐impulse‐to‐loaded‐weight ratio also differs from the effective specific impulse because it accounts for the inert mass expended. In many motors insulation and liner are partially consumed during burning).
Thrust for solid propellant rocket motors is given by the identical definitions developed in Chapters 2 and 3, namely, Eqs. 2–13 and 3–29. The flame or combustion temperature is a thermochemical property of the propellant formulation and the chamber pressure. It not only affects the exhaust velocity, but also heat transfer to the grain, hardware design, materials selection, and external flame radiation emissions. In Chapter 5, methods for combustion temperature calculations are presented. The determination of the nozzle throat area, nozzle expansion area ratio, and nozzle dimensions is discussed in Chapter 3.
The specific impulse Is and the effective exhaust velocity c are defined by Eqs. 2–3, 2–4, and 2–6. It is experimentally difficult to measure the instantaneous propellant flow rate or the effective exhaust velocity. However, total impulse and total propellant mass consumed during the test can be measured. The motor's total effective propellant mass and an approximate mass flow rate can be determined by weighing the rocket before and after a ground test. The effective propellant mass is often slightly less than the total propellant mass because some grain designs lead to small portions of the propellant (called slivers) to remain unburned during combustion, as explained later in this chapter. Also, portions of the hot nozzle surface and insulation material erode and/or vaporize during the burning, and this reduces the final inert mass of the rocket motor and also slightly increases the nozzle mass flow. This explains the difference between the total inert mass and the burnout mass in Table 12–3. It has been found that the total impulse can be accurately determined in testing by integrating the area under a thrust time curve. For this reason the average specific impulse is usually calculated from total measured impulse and effective propellant mass. The total impulse It is defined by Eq. 2–1 as the integration of thrust F over the operating duration tb:
where ![]() is an average value of thrust over the burning duration tb. For real rocket motors, two time intervals are used, burning time and action time as shown in Fig. 12–13 and further described in Section 12.3.
is an average value of thrust over the burning duration tb. For real rocket motors, two time intervals are used, burning time and action time as shown in Fig. 12–13 and further described in Section 12.3.

Figure 12–13 Definitions of burning time and action time.
The definitions for the burning time, action time, and pressure rise or ignition rise time are defined in Fig. 12–13. Time zero is given as the instance when a starting voltage is applied to the ignition squib and primer charge; a common method is the aft tangent bisector method, as shown in Fig. 12–13 (Ref. 12–14), but this time can also be determined by computer analysis (Ref. 12–15). Exhaust gases can actually be seen from the rocket nozzle for periods longer than the action time, but the effluent mass flow ahead of and behind the action time is actually very small; the end of burning has been determined by several methods. The above definitions are somewhat arbitrary but are commonly in use and documented by standards such as Ref. 2–2.
For flight tests it is possible to arrive at the instantaneous thrust from the measured flight path acceleration (reduced by any estimated drag) and from the estimated instantaneous motor mass from chamber pressure measurements, which is essentially proportional to the rocket nozzle mass flow; this gives another way to calculate specific impulse and total impulse.
There are at least four values of specific impulse: (1) theoretical specific impulse, (2) delivered or actual values as measured from flight tests, static tests, or demonstrations (see Ref. 12–16), (3) delivered specific impulse at standard or reference conditions, and (4) the minimum guaranteed value. Merely quoting a number for specific impulse without further qualification leaves many questions unanswered. This notion is similar to the “four performance parameters” listed in Section 3.5. Specific impulse as diminished by several losses can be predicted as shown in Ref. 12–17.
Losses include nozzle inefficiencies due to friction in the viscous boundary layers, nonaxial nozzle exit flows as described in Chapter 3, thrust vector deflection as described in Chapter 18, residual propellants, heat losses to the walls or insulators, incomplete combustion, and to the presence of solid particles and/or small droplets in the gas which need to be accelerated. There are also some performance gains—other gases (created by ablation of the ablative nozzle and insulators or the igniter propellants) contribute to an increased mass flow, in many cases also to a somewhat lower effective average molecular mass, and to a slight reduction of the final inert mass after rocket motor operation.
When particles are present, two‐phase flow equations for calculating specific impulse can be solved when the size distribution, shape, and percentage of solid particles in the exhaust gas are known. The assumption of a uniform average spherical particle diameter simplifies the analysis (Ref. 12–17), and this diameter can be estimated from specific impulse measurements on rocket motor tests (Ref. 12–18). Section 3.5 gives a simple theory for two‐phase flow of solid particles within a gas flow.
Propellants burn to varying degrees of completion depending on the fuel/oxidizer types and ratios, energy losses, and on the environment within the rocket motor. Propellants with nonmetal fuels usually require the use a velocity correction factor (see Section 3.5) of 97 or 98%, as contrasted to 90 to 96% for propellants with aluminum powder as the fuel. Any solid or liquid particles in the exhaust do not contribute to the gas expansion or require energy to be accelerated, and hence two‐phase flow is less efficient. However, the addition of the aluminum increases the heat of combustion, i.e., the chamber gas temperature and thus the exhaust velocity or specific impulse. This increase can be made to outweigh any losses incurred.
The propellant mass fraction ζ is defined in Eq. 2–8 as ![]() , and it is directly related to the motor mass ratio and therefore also to the flight performance of the vehicle. The initial rocket motor mass m0 is taken as the sum of the useful solid propellant mass mp and the nonburning, inert hardware mass of the rocket motor. For a vehicle's total propellant mass fraction, the payload mass and the nonpropulsion inert mass (vehicle structure, guidance and control, communications equipment, and power supply) have to be included. A high value of ζ indicates a low inert motor mass and an efficient hardware design, but often high stresses. This parameter (ζ) has been used to make approximate preliminary design estimates. It depends on motor size or mass, thrust level, nozzle area ratio, and combustion case materials. For very small motors (less than 100 lbm) the value of the propellant fraction is between 0.3 and 0.75. Medium‐sized motors have ζ values between 0.8 and 0.91. For larger motors
, and it is directly related to the motor mass ratio and therefore also to the flight performance of the vehicle. The initial rocket motor mass m0 is taken as the sum of the useful solid propellant mass mp and the nonburning, inert hardware mass of the rocket motor. For a vehicle's total propellant mass fraction, the payload mass and the nonpropulsion inert mass (vehicle structure, guidance and control, communications equipment, and power supply) have to be included. A high value of ζ indicates a low inert motor mass and an efficient hardware design, but often high stresses. This parameter (ζ) has been used to make approximate preliminary design estimates. It depends on motor size or mass, thrust level, nozzle area ratio, and combustion case materials. For very small motors (less than 100 lbm) the value of the propellant fraction is between 0.3 and 0.75. Medium‐sized motors have ζ values between 0.8 and 0.91. For larger motors ![]() ζ is between 0.88 and 0.945. A range of values is given for each category because of the influence of the following other variables: Medium‐ and large‐sized motors with steel cases generally have lower ζ values than those with titanium cases, and their values are lower than for cases made of Kevlar fibers in an epoxy matrix. The highest values are for cases made of graphite or carbon fibers in an epoxy matrix. The ζ values are lower for larger area ratio nozzles and motors with thrust vector control. The STARTM 27 rocket motor, shown in Fig. 12–1 and described in Table 12–3, has a propellant mass fraction of 0.924. This is a high value for a medium‐sized motor with a titanium metal case and a relatively large nozzle exit section.
ζ is between 0.88 and 0.945. A range of values is given for each category because of the influence of the following other variables: Medium‐ and large‐sized motors with steel cases generally have lower ζ values than those with titanium cases, and their values are lower than for cases made of Kevlar fibers in an epoxy matrix. The highest values are for cases made of graphite or carbon fibers in an epoxy matrix. The ζ values are lower for larger area ratio nozzles and motors with thrust vector control. The STARTM 27 rocket motor, shown in Fig. 12–1 and described in Table 12–3, has a propellant mass fraction of 0.924. This is a high value for a medium‐sized motor with a titanium metal case and a relatively large nozzle exit section.
A number of performance parameters are used to evaluate solid propellant rocket motors and to compare the quality of design of one rocket motor with another. The first is the total‐impulse‐to‐loaded‐weight ratio (It/wG), also called the “effective specific impulse.” The loaded gross weight wG is the sea‐level initial gross weight of propellant and the rocket propulsion system hardware. Typical values for It/wG are between 100 and 230 sec, with the higher values representative of high‐performance rocket propellants and highly stressed hardware, which means a lower inert mass. The total‐impulse‐to‐loaded‐weight ratio ideally approaches the value of the specific impulse as seen from Eq. 2–11, when the weight of hardware, metal parts, inhibitors, and so on becomes very small in relation to the propellant weight wp, i.e., the ratio It/wG approaches It/w, which is the definition of the specific impulse (Eq. 2–4). The higher the value of It/wG, the better the design of a rocket motor. Another parameter used for comparing propellants is the volume impulse; it is defined as the total impulse per unit volume of propellant grain, or It/Vb.
The thrust‐to‐weight ratio F/wG is a dimensionless parameter that represents the acceleration of the rocket propulsion system (expressed in multiples of g0) if it could fly by itself in a gravity‐free vacuum; it excludes other vehicle component weights (see Section 4.3). It is peculiar to each application and can vary from very low values of less than one g0 to over 1000g0 for high acceleration applications of solid propellant rocket motors. Some rocket‐assisted gun munitions have accelerations of 20,000 g0.
Two ambient temperature limits for the grain are commonly listed in rocket motor specifications or motor parameter lists. The first comprises the minimum and maximum allowable temperatures for starting rocket motor operation. The second involves the minimum and maximum allowable storage temperatures. Also listed is a storage time which includes any transportation time together with the time in a warehouse and the time when loaded in a vehicle. These limits are intended to minimize excessive internal grain stresses.
It is difficult to measure actual burning rates or specific impulse on full‐scale solid propellant rocket motors (SPRMs) because it is essentially impossible to measure rates of propellant flow or burning area changes directly without changes to the hardware. Some direct measurements of these have been made in experimental rocket motors, such as measuring changes of burning areas or burn rates by means of X‐rays during ground tests. The following measurements are typical of SPRM ground tests (but only some are used during any one test): thrust‐time profile, pressures (including chamber pressure), action time, burning time, ignition delay, total propellant consumed (with small amounts of eroded insulation/ nozzle materials) by weighing the SPRM before and after testing, initial and final throat and exit diameters, temperature of various components, local stresses and strains, and vibrations. Production SPRMs have fewer direct measurements. Additional data are obtained from analyses, laboratory tests, and design information such as initial volumes of the chamber or cavity, initial burning area, expected combustion temperature, and physical properties and composition of the propellant (such as laboratory‐measured specific heats, strand burning rate, propellant density, etc.).
12.3 PROPELLANT GRAIN AND GRAIN CONFIGURATION
The grain is the shaped mass of processed solid propellant inside the rocket motor. The material and geometrical configuration of the grain govern motor performance characteristics. Propellant grains are cast, molded, or extruded bodies and their appearance and feel is similar to that of hard rubber or plastic. Once ignited, the grain will burn on all its exposed surfaces forming hot gases that are then exhausted through a nozzle. Most rocket motors have a single grain. A few have more than one grain inside a single case or chamber, and very few grains have segments made of different propellant composition (e.g., to allow different burning rates).
There are two methods of holding the grain in its case, as seen in Fig. 12–14. Cartridge‐loaded or freestanding grains are manufactured separately from the case (by extrusion or by casting into a cylindrical mold or cartridge) and then loaded into or assembled into the case. In case‐bonded grains the case is used as a mold and the propellant is cast directly into the case and is bonded to the case, its liner or case insulation. Freestanding grains can more easily be replaced when the propellant grain has aged excessively. Cartridge‐loaded grains are used in some small tactical missiles and a few medium‐sized rocket motors. They often have a lower cost and are easier to inspect. Case‐bonded grains give a somewhat better performance, a little less inert mass (no holding device, support pads, and less insulation), and a better volumetric loading fraction, but are more highly stressed and often somewhat more difficult and expensive to manufacture. Today almost all larger motors and many tactical missile motors use case bonding. Stresses in grains are briefly discussed under structural design in the next section.

Figure 12–14 Schematic diagrams of a freestanding (or cartridge‐loaded) and a case‐bonded grain.
Definitions and terminology relevant to grains include:
- Configuration: The shape or geometry of the initial burning surfaces of a grain as it is intended to operate inside a motor.
- Cylindrical grain: A grain in which the internal cross section is constant along the axis regardless of perforation shape (see Fig. 12–3).
- Neutral burning: A grain for which thrust, pressure, and burning surface area remain approximately constant during burning (see Fig. 12–15), typically within about ±15%. Many grains are neutral burning.
- Progressive burning: A grain in which thrust, pressure, and burning surface area increase with burn time (see Fig. 12–15).
- Regressive burning: A grain in which thrust, pressure, and burning surface area decrease with burn time (see Fig. 12–15).
- Perforation: The central cavity port or flow passage of a propellant grain; its cross section may be a cylinder, a star shape, and the like (see Fig. 12–16).
- Sliver: Unburned propellant residue or propellant lost—i.e., expelled through the nozzle at the time of web burnout.
- Burning time, or effective burning time, tb: Usually, the interval from 10% maximum initial pressure (or thrust) to web burnout, with web burnout usually taken as the aft tangent‐bisector point on the pressure–time trace (see Fig. 12–13).
- Action time, ta: The burning time or typically, the interval between the initial and final 10% pressure (or thrust) points on the pressure–time trace (see Fig. 12–13).
- Deflagration limit: The minimum pressure at which combustion can still be barely self‐sustained and maintained without adding energy. Below this pressure the combustion ceases altogether or may be erratic and unsteady with the plume appearing and disappearing periodically.
- Inhibitor: A layer or coating of slow or nonburning material (usually, a polymeric rubber type with filler materials) applied (glued, painted, dipped, or sprayed) to a part of the grain's propellant surface to prevent burning on that surface. By preventing burning on inhibited surfaces the initial burning area can be reduced and controlled. Also called restrictor.
- Liner: A sticky, inert non‐self‐burning thin layer, flexible and relatively low density, rubber‐like polymeric material that is applied to the cases prior to casting the propellant in order to promote good bonding between the propellant and the case or between the propellant and the insulator. It also allows some axial motion between the grain periphery and the case.
- Internal insulator: An internal layer between the case and the propellant grain made of an adhesive, thermally insulating material that will not burn readily. Its purpose is to limit the heat transfer to and the temperature rise of the case during rocket operation. Liners and insulators can be seen in Figs. 12–1, 12–4 and 12–14, and are described in Section 13.6.
- Web thickness, b: The minimum thickness of the grain from the initial internal burning surface to the insulated case wall or to the intersection of another burning surface; for an end‐burning grain, b equals the length of the grain (see Fig. 12–16).
- Web fraction, bf: For a case‐bonded internal burning grain, the ratio of the web thickness b to the outer radius of the grain:
- Volumetric loading fraction, Vf: The ratio of propellant volume Vb to the chamber volume Vc (excluding nozzle) available for propellant, insulation, and restrictors. Using Eq. 2–4 and
 :
:
where It is the total impulse, Is the specific impulse, and ρb the propellant density.
Grain designs have to satisfy several interrelated requirements:
- Rocket motor requirements can be determined from the flight mission. These have to be known before the grain can be designed. They are usually established by the vehicle designers. Motor requirements can include total impulse, desired thrust–time curve and tolerance thereon, motor mass, ambient temperature limits during storage and operation, available vehicle volume or envelope, desired location or movement of rocket motor's center of gravity, and accelerations caused by vehicle forces (vibration, bending, aerodynamic loads, etc.).
- The grain geometry is selected to fit motor requirements; it should be compact efficiently using the available volume, have an appropriate burn surface versus time profile to match the desired thrust–time curve, and avoid or predictably control possible erosive burning (many motors with progressive burning can tolerate short periods of erosive burning). Any remaining unburned propellant slivers, and often also the shift of the center of gravity during burning, should be minimized. Selection of the geometry can be complex, as discussed in Refs. 12–1 and 12–8 as well as below in this section.
- The propellant is usually selected on the basis of its performance capability (e.g., characteristic velocity c*), mechanical properties (e.g., strength), ballistic properties (e.g., burning rate r), manufacturing characteristics, exhaust plume characteristics, and aging properties. If necessary, the propellant formulation may be slightly altered or “tailored” to fit more exactly the required burning time or grain geometry. Propellant selection is discussed in Chapter 13 and in Ref. 12–8.
- Grain structural integrity, including its liner and/or insulator, must be analyzed to assure that the grain will not fail from stress or strain under all conditions of loading, acceleration, or thermal stress. Grain geometry can be changed to reduce excessive stresses. This is discussed in the next section of this chapter.
- Any internal cavity volume made of perforations, slots, ports, and fins increases with burning time. These cavities need to be evaluated for resonance, vibration damping, and combustion stability. This is discussed in Chapter 14.
- The processing of the grain and the fabrication of the propellant should be repeatable, simple, low cost (see Chapter 13), and only cause acceptable thermal stresses.
Though grain configuration designs aim to satisfy most of these requirements, there are cases when some of the six above categories can only be partially met. Grain geometry is crucial in its design. For a neutral burning grain (nearly constant thrust), for example, the burning surface Ab has to remain sufficiently constant, and for a regressive burning grain the burning area has to diminish during the burning time. The trade‐off between burning rate and the burning surface area is evident from Eqs. 12–5 and 12–6 where it can be seen that changes of burning surface with time have a strong influence on chamber pressure and thrust. Because the density of most modern propellants falls within a narrow range (about 0.066 lbm/in.3 or 1830 kg/m3, +2 to −15%), propellant density has only a small influence on grain design.
As a result of rocket motor developments of the past five decades, many grain configurations are available to motor designers. As new methods evolved for increasing the propellant burning rate, the number of configurations needed decreased. Current designs concentrate on relatively few configurations, since the needs of a wide variety of solid rocket motor applications can now be fulfilled by combining known configurations or by slightly altering a classical configuration. The trend has been to discontinue configurations that give weak grains or which form cracks more readily, or produce high sliver residues, or have a low volumetric loading fraction, or are more expensive to manufacture.
The results of propellant burning on internal surface areas are readily apparent for simple geometric shapes such as rods, tubes, wedges, and slots, as shown in the top four configurations of Fig. 12–16. Other basic surface shapes burn as follows: external burning rod—regressive; external burning wedge—regressive. Most propellant grains combine two or more of these basic surfaces to obtain the desired burning characteristic. The star perforation, for example, combines the wedge and the internal burning tube. Figure 12–17 indicates typical single grains with combinations of two basic shapes. The term conocyl is a contraction of the words cone and cylinder. A finocyl has fins on a cylinder.
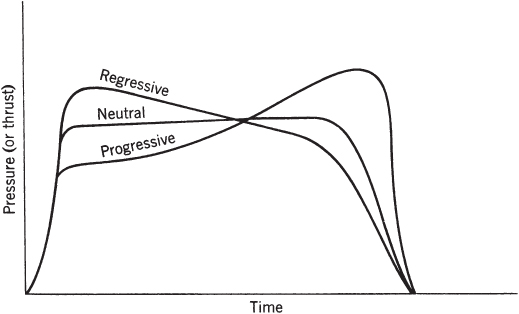
Figure 12–15 Classification of grains according to their pressure–time characteristics.

Figure 12–16 Simplified diagrams of several grain configurations.

Figure 12–17 Typical common grain configurations using combinations of two basic shapes for the grain cavity.
Configurations that combine both radial and longitudinal burning, as does the ‘internal–external burning tube without restricted ends’, are frequently referred to as “three‐dimensional grains” even though all grains are geometrically three‐dimensional. Correspondingly, grains that burn only longitudinally or only radially are called “two‐dimensional grains.” Grain configurations can be classified according to their web fraction bf, their length‐to‐diameter ratio L/D, and their volumetric loading fraction Vf. These three interdependent variables are often used in selecting a grain configuration in the preliminary design of a motor for a specific application. Obvious overlap of characteristics may exist with some configurations, as given in Table 12–4 and shown by simplified sketches in Fig. 12–16. The configurations listed above the horizontal line inside the table are common in recent designs. The bottom three were used in earlier designs and usually are more difficult to manufacture or support in a motor case. An end‐burning grain has the highest volumetric loading fraction, the lowest grain cavity volume for a given total impulse, and a relatively low burning area or thrust with a long duration. The internal burning tube is relatively easy to manufacture and can be neutral burning with unrestricted ends of ![]() . By adding fins or cones (see Fig. 12–17) this configuration works for
. By adding fins or cones (see Fig. 12–17) this configuration works for ![]() . The star configuration is ideal for web fractions of 0.3 to 0.4; it is progressive above 0.4 but can burn neutral with fins or slots. The wagon wheel is structurally superior to the star shape around 0.3 and is a necessary shape for a web fraction of 0.2 (high thrust and short burn time). Dendrites are used in the lowest web fraction when a relatively large burning area is needed (high thrust and short duration), but stresses may be high. Although the limited number of configurations given in this table may not encompass all the practical possibilities for fulfilling a nearly constant thrust–time performance requirement, combinations of these features may be considered for achieving neutral pressure–time traces and high volumetric loadings before any relatively unproven configuration is accepted. The capabilities of basic configurations listed in these tables can be extended by alterations. Movements of the center of gravity (CG) influence flight stability of the vehicle. Relative values of this CG shift are also shown in Table 12–4. Most solid propellant manufacturers have specific approaches and sophisticated computer programs for analyzing and optimizing grain geometry alternatives for burn surface and cavity volume analyses. See Refs. 12–16 and 12–20 and Chapters 8 and 9 of Ref. 12–1.
. The star configuration is ideal for web fractions of 0.3 to 0.4; it is progressive above 0.4 but can burn neutral with fins or slots. The wagon wheel is structurally superior to the star shape around 0.3 and is a necessary shape for a web fraction of 0.2 (high thrust and short burn time). Dendrites are used in the lowest web fraction when a relatively large burning area is needed (high thrust and short duration), but stresses may be high. Although the limited number of configurations given in this table may not encompass all the practical possibilities for fulfilling a nearly constant thrust–time performance requirement, combinations of these features may be considered for achieving neutral pressure–time traces and high volumetric loadings before any relatively unproven configuration is accepted. The capabilities of basic configurations listed in these tables can be extended by alterations. Movements of the center of gravity (CG) influence flight stability of the vehicle. Relative values of this CG shift are also shown in Table 12–4. Most solid propellant manufacturers have specific approaches and sophisticated computer programs for analyzing and optimizing grain geometry alternatives for burn surface and cavity volume analyses. See Refs. 12–16 and 12–20 and Chapters 8 and 9 of Ref. 12–1.
Table 12–4 Characteristics of Several Grain Configurations
| Configuration | Web Fraction | L/D Ratio | Volumetric Fraction | Pressure–Time Burning Characteristics | CG Shift |
| End burner | >1.0 | NA | 0.90–0.98 | Neutral | Large |
| Internal burning tube (including slotted tube, trumpet, conocyl, finocyl) | 0.5–0.9 | 1–4 | 0.80–0.95 | Neutrala | Small to moderate |
| Segmented tube (large grains) | 0.5–0.9 | >2 | 0.80–0.95 | Neutral | Small |
| Internal starb | 0.3–0.6 | NA | 0.75–0.85 | Neutral | Small |
| Wagon Wheelb | 0.2–0.3 | NA | 0.55–0.70 | Neutral | Small |
| Dendriteb | 0.1–0.2 | 1–2 | 0.55–0.70 | Neutral | Small |
| Internal–external burning tube | 0.3–0.5 | NA | 0.75–0.85 | Neutral | Small |
| Rod and tube | 0.3–0.5 | NA | 0.60–0.85 | Neutral | Small |
| Dog boneb | 0.2–0.3 | NA | 0.70–0.80 | Neutral | Small |
a Neutral if ends are unrestricted, otherwise progressive.
b Has up to 4 or sometimes 8% sliver mass and thus a gradual thrust termination.
NA: not applicable or not available.
The end‐burning grain (i.e., burning like a cigarette) is unique; it burns solely in the axial direction and maximizes the amount of propellant that can be placed in a given cylindrical motor case. In larger motors (over 0.6 m diameter) these end burners eventually show a progressive thrust curve. Figure 12–18 indicates how the burning surface forms a conical shape, causing the rise in pressure and thrust. Although this behavior is not fully understood, two factors may contribute to higher burning rate near the bondline: chemical migration of the burning rate catalyst into and toward the bondline, and local high propellant stresses and strains at the bond surface, creating local cracks (Ref. 12–21).

Figure 12–18 Schematic diagram of end‐burning grain coning effect. In larger sizes (above approximately 0.5 m diameter) the burning surface does not remain flat and perpendicular to the motor axis, but gradually assumes a conical shape. The lines in the grain indicate successively larger‐area burning surface contours leading from neutral to progressive burning.
Rocket motors used in air‐launched or in certain surface‐launched missile applications, weather rockets, certain anti‐aircraft or antimissile rockets, and other tactical applications actually benefit by a reducing thrust with burn time. A high thrust is desired to apply the initial acceleration to attain flight‐speed quickly, but, as propellant is consumed and the vehicle mass is reduced, a decrease in thrust is desirable; this limits the maximum acceleration on the rocket‐propelled vehicle and on any sensitive payload, often reduces the drag losses, and usually permits a more effective flight path. Therefore, there is a benefit to vehicle mass, flight performance, and cost in having a higher initial thrust during the boost phase of the flight, followed by a lower thrust (often 10 to 30% of boost thrust) during the sustaining phase of the powered flight. Figure 12–19 shows several grains which give two discrete thrust periods in a single burn operation. The configurations are actually combinations of the configurations listed in Table 12–4.

Figure 12–19 Several simplified schematic diagrams of grain configurations for an initial period of high thrust followed by a lower‐thrust period.
In a single‐propellant dual‐thrust level solid rocket motor, factors relating to the sustain flight portion usually dominate in the selection of the propellant type and grain configuration when most of the propellant volume is used during the longer sustain portion.
A restartable rocket motor has advantages in a number of tactical rocket propulsion systems used for aircraft and missile defense applications. Here two (or sometimes three) grains are contained inside the same case, each with its own igniter. The grains are physically separated typically by a structural bulkhead or by an insulation layer. One method for accomplishing this is shown in Fig. 12–20. The timing between thrust periods (sometimes called thrust pulses) can be controlled and commanded by the missile guidance system, so as to change the trajectory in a nearly optimum fashion and to minimize the flight time to target. The separation mechanism has to prevent the burning‐hot pressurized gas of the first grain from reaching the other grain and causing its inadvertent ignition. When the second grain is ignited, the separation devices are automatically removed, fractured, or burned, but in such a manner that the fragments of hardware pieces will not plug the nozzle or damage the insulation (see Ref. 12–22).

Figure 12–20 Simplified diagram of one concept for a two‐pulse experimental rocket motor with two grains separated by a bulkhead. During the first pulse operation the metal diaphragm is supported by a spider‐web‐like structure made of high‐temperature material. Upon ignition of the second stage, the scored burst diaphragm is loaded in the other direction; it breaks and its leaves peel back. The bulkhead opening has a much larger area than the nozzle throat.
Slivers
Any remaining unburnt propellant is known as slivers. Figure 12–5 and the figure in Problem 12–6 show small slivers or pieces of unburnt propellant remaining at the periphery of the grain, because the pressure there was below the deflagration limit (see Ref. 12–23). About 45 years ago grain designs routinely produced 2 to 7% propellant slivers; any such residue material causes a reduction in propellant mass fraction and vehicle mass ratio. The technology of grain design has advanced so that today there are almost no slivers (usually less than 1%). If slivers were to occur in a new grain design, the designer would try to replace the sliver volume with a lower‐density insulator, which gives less of a mass ratio penalty than the higher‐density propellant residue.
12.4 PROPELLANT GRAIN STRESS AND STRAIN
The objective of stress analysis in rocket motors is to design the configuration of the grain, the liners, and/or the grain support in such a way that stresses or strains that may lead to failure will not occur. Static and dynamic loads and stresses are always imposed on propellant grains during manufacture, transportation, storage, and operation. Structurally, a rocket motor is a thin shell of revolution (the case) almost completely filled with a viscoelastic material, the propellant, which normally accounts for 80 to 94% of the motor mass. Propellants have some mechanical properties that are not found in ordinary structural materials and to date these have received relatively little study. The viscoelastic nature of solid propellants is time–history dependent and these materials accumulate damage from repeated stresses; this is known as the cumulative‐damage phenomenon.
The most common failure modes are:
- Surface cracks that are formed when surface strains are excessive. They open up additional burning surfaces, and this in turn causes the chamber pressure as well as the thrust to increase. A higher, shorter duration thrust may cause the vehicle to fly a different trajectory, and this may result in a missed mission objective. With many cracks or a few deep cracks, the case becomes overpressurized and will fail. The limiting strain depends on the stress level, grain geometry, temperature, propellant age, load history, and the sizes of flaws or voids. At the higher strain rates, deeper, more highly branched cracks readily form (see Ref. 12–11).
- Small locally detached or broken unbonded area may also exist at the grain periphery—a very thin gap may form between the propellant and the liner or the case or the insulation. It can be seen with X‐rays or proper heat conduction instruments. As any part of such unbonded areas become exposed to the hot, high‐pressure combustion gases in the grain cavity the design burning area increases suddenly. Such enlarged burning area results in a higher chamber pressure (and larger thrust). Having even a few large unbonded areas often results in rocket motor failure.
Other failure modes, such as having a high enough ambient grain temperature to cause large reductions in the physical strength properties, ultimately result in grain cracks and/or debonding. Air bubbles, porosity, and/or an uneven density in the grain may locally reduce the propellant strength to cause failure, again by cracks or debonds. X‐ray inspections are routinely used by manufacturers, which can detect all but the smallest debonded areas and surface cracks. When the X‐ray inspection uncovers debonding or cracks that cannot be tolerated, the solid propellant unit is rejected and scrapped. Other failure modes are excessive deformations of the grain (e.g., slump of large grains can restrict the port area) and involuntary ignitions due to heat generated in viscoelastic propellants from excessive mechanical vibrations (e.g., prolonged bouncing during transport).
Material Characterization
Before any structural analysis can be performed it is necessary to specify the materials and obtain data on their properties. Grain materials (propellant, insulator, and liner) are all nearly incompressible rubber‐like substances. They typically have a bulk modulus in compression of at least 1400 MPa or about 200,000 psi in their original state (undamaged). Since there should be very few voids in properly made propellants (much less than 1%), their compression strain is low. However, propellants are easily damaged by applied tension and shear loads. When the strength of any propellant in tension and shear (typically between 50 and 1000 psi) is exceeded, the grain will be damaged or fail locally. Since grains are three‐dimensional, all stresses are combined and not purely compression stresses, and thus grains are easily damaged. This damage may take the form of a “dewetting” of the adhesion between individual solid particles and the binder in the propellant and appears initially as many small voids or porosity. Those very small holes or debonded areas next to or around the solid particles may initially be under vacuum, but they become larger with strain growth.
Propellants, liners, and insulators with solid fillers behave as viscoelastic materials which display nonlinear viscoelastic behaviors. This means that the maximum stress and maximum elongation or strain will diminish each time a significant load is applied. The material becomes weaker and may suffer cumulative damage with each loading cycle or thermal stress application. Other physical properties also change with the time rate of applied loads; for example, very fast pressurizations actually give stronger materials. Because certain binders, such as HTPB (see Chapter 13), give good elongation and are stronger propellants than other polymers used with the same percentage of binder, today HTPB is a preferred binder. Physical properties are also affected by the manufacturing process. For example, tensile specimens cut from the same conventionally cast grain of composite propellant may show a 20 to 40% variation in strength between samples of different orientation which may derive from the local casting slurry flow direction. Though viscoelastic material properties change as a function of prior loading and damage history, they have some capability to “reheal and partially recover” following damage. In time, chemical deterioration will also degrade the properties of many propellants. All these phenomena make it difficult to characterize such materials and predict their behavior or physical properties in engineering terms.
Several kinds of laboratory tests on small samples are routinely performed to determine the physical properties of these materials. (see Refs. 12–24 and 12–25). Simple tests, however, cannot properly represent any complex nonlinear behavior. Laboratory tests are conducted under ideal conditions—mostly uniaxial stresses instead of complex three‐dimensional stresses—with a uniform temperature instead of a thermal gradient and usually with no prior damage to the material. The application of laboratory test results to real structural analysis therefore must involve several assumptions and empirical correction factors. Test data are transformed into certain derived parameters for determining safety margins and useful life, as described in Chapter 9 of Ref. 12–1. No complete agreement exists yet on how best to characterize these materials. Nevertheless, laboratory tests do provide useful information and several are described below.
The most common test is a simple uniaxial tensile test at constant strain rate. One set of results is shown in Fig. 12–21. This test is commonly used for manufacturing quality control, propellant development, and for determining failure criteria. Once the sample has been loaded, unloaded, and restressed several times, the damage to the material changes its response and properties as shown by the dashed curve in Fig. 12–21.

Figure 12–21 Stress–strain curves for a typical composite‐type solid propellant showing the effect of cumulative damage. The maximum stress σm is higher than the rupture stress σr, of the tensile test sample.
The dewetting strain is, by definition, the strain (and corresponding maximum stress) where incipient failure of the interface bonds between small solid oxidizer crystals and the rubbery binder occurs. The dewetting stress is analogous to the yield point in elastic materials, because it represents when internal material damage begins to happen. The slope E, the modulus at low strain, is not ordinarily used in design, but is often used as a quality control parameter. Data from several such uniaxial tests at different temperatures can be then manipulated to arrive at allowable stresses, permissible safe strains, and a derived artificial modulus, as described later. Once a case‐bonded grain has been cooled down from its casting temperature, it will have shrunk and be under multidirectional strain. Samples cut from different parts of a temperature‐cycled grain will usually give different tensile test results.
Biaxial strength tests are also performed frequently in the laboratory. One type is described in Ref. 12–24. Meaningful three‐dimensional stress tests are difficult to perform in the laboratory and are usually not done. Other sample tests give information about propellant behavior, such as strain endurance tests to obtain the strain levels at which the propellant has long endurance and does not suffer significant damage, tests at constant stress levels, fracture tests of samples with known cracks or defects, tensile tests under simulated chamber pressures, and/or tests to measure thermal coefficients of expansion. Peel tests for the adhesive bonds of propellants to liners or insulators are very common and their failures are discussed in Ref. 12–25. In addition, strain or stress measurements are made occasionally on full‐scale, experimental, flight‐weight motors using special embedded sensors. Care must be taken that the implanting of these sensors into the grain does not disturb the local stress–strain distribution, which would lead to erroneous measurements. The application and interpretation of all these depend on the test conditions in the grain and on experimenter preferences.
Table 12–5 Range of Tensile Properties of a Reduced Smoke Composite Propellant for a Tactical Missilea
Source: Data taken with permission of the AIAA from Ref. 12–26.
| Temperature (°F) | |||
| 158 | 77 | −40 | |
| Maximum stress (psi) | 137–152 | 198–224 | 555–633 |
| Modulus (psi) | 262–320 | 420–483 | 5120–6170 |
| Strain at maximum stress–strain at ultimate stress (%) | 54/55–65/66 | 56/57–64/66 | 46/55–59/63 |
a Polybutadiene binder with reduced aluminum and ammonium perchlorate; data are from four different 5‐gallon mixes.
The maximum failure stress for most solid propellants is relatively low compared to that of plastic materials. Typical values range from about 0.25 to 8 MPa or about 40 to about 1200 psi, with average values between 50 and 300 psi, and elongations range from 4 to 250%, depending on the specific propellant, its temperature, and its stress history. Table 12–5 shows such properties for a relatively strong propellant. A few double‐base propellants and binder‐rich composite propellants can withstand higher stresses (up to about 32 MPa or 4600 psi). Because pressure and strain rate have a major influence on the physical properties, tensile tests performed at actual chamber pressures give a higher strength than those done at atmospheric pressure, in some cases by a factor of 2 or more. High strain rates (sudden‐start pressurization) can also temporarily improve propellant properties.
Commonly, strength properties of grain materials are determined over a range of propellant temperatures. For air‐launched missiles these limits are wide, with −65 and +160°F or 219 and 344 K often representing the lower and upper extremes expected during motor exposure. Propellant grains must be strong enough and have sufficient elongation capability to meet the high stress concentrations present during shrinkage at low temperatures and also under the dynamic load conditions of ignition and motor operation. Mechanical properties (strength, elongation) can be increased by increasing the percent of binder material in the propellant, but at a reduction in performance.
Structural Design
Structural analyses of any typical case‐bonded grain have to consider not only the grain itself but also the liner, insulator, and case, all of which interact structurally with the propellant grain under various loading conditions (see Chapter 9 of Ref. 12–1). The need to obtain strong bonds between propellant and liner, liner and insulator, or insulator and case is usually satisfied by using selected materials and manufacturing procedures that assure a proper set of bonds. Liners are usually flexible and can accept relatively large strains without failure as they transmit vehicle loads from the case (which is usually part of the vehicle structure) into the propellant.
When a propellant is oven‐cured, it is assumed to have a uniform internal temperature and be free of thermal stresses. As the grain cools and shrinks after curing it reaches equilibrium at the uniform ambient temperature (say, from −40 to +75°F), the propellant thus experiences internal stresses and strains which can be relatively large even at these temperatures. Stresses are further increased because the case material usually has a thermal coefficient of expansion that is smaller than that of the propellant by an order of magnitude. The stress‐free temperature range of a propellant can be changed by curing the motor under pressure. Since this usually reduces the stresses at ambient temperature extremes, such pressure cure is now being used more commonly.
Structural analyses may proceed only after all loads have been identified and quantified. Table 12–6 lists typical loads that are experienced by solid propellant motors during their life cycle and some of the failures induced. Since some loads are unique to specific applications, individual loads and their timing during the life cycle of a solid propellant rocket motor have to be analyzed for each application and each motor. They uniquely depend on the motor design and use. Although ignition and high accelerations (e.g., impact on a rocket motor that falls off a truck) usually cause high stresses and strains, these commonly do not produce the critical loads. Stresses induced by ambient environmental temperature cycling or gravity slumps are often relatively small; however, they are additive to other stresses and thus can be critical. A motor used in space that is to be fired within a few months after manufacture presents a different problem than a tactical motor that is to be transported, temperature cycled, and vibrated for longer times, and this is yet different from large‐diameter ballistic missile motors that may sit in a temperature‐conditioned silo for over 10 years.
Table 12–6 Summary of Loads and Likely Failure Modes in Case‐Bonded Rocket Motors
| Load Source | Description of Load and Critical Stress Area |
| 1. Cool‐down during manufacture after hot cure | Temperature differential across case and grain; tension and compression stresses on grain surfaces; hot grain, cool case |
| 2. Thermal cycling during storage or transport (cold night, warm day) | Alternating hot and cold environment; critical condition is with cold grain, hot case; two critical areas: bond‐line tensile stress (tearing), inner‐bore surface cracking |
| 3. Improper handling and transport vibrations | Shock and vibration, 5–30g0 forces during road transport at 5–300 Hz (5–2500 Hz for external aircraft carry) for hours or days; critical failure: grain fracture or grain debonding |
| 4. Ignition shock/initial pressure loading | Case expands and grain compresses; axial pressure differential more severe with end‐burning grains; critical areas; fracture and debonding at grain periphery |
| 5. Friction of internal gas flow in cavity | Axially rearward force on grain |
| 6. Launch and axial flight acceleration | Inertial load mostly axial; shear stress at bond line; slump deformation in large motors can reduce port area |
| 7. Flight maneuvers (e.g., antimissile rocket) | High side accelerations cause unsymmetrical stress distribution; can result in debonding or cracks |
| 8. Centrifugal forces in spin‐stabilized projectiles/missiles | High strain at inner burning surfaces; cracks can form |
| 9. Gravity slump of grain during storage; only in large motors (such as 10 ft in diameter) | Stresses and deformation in perforations minimized by rotating the motor periodically; port area cross section can be reduced by slump |
| 10. External air friction when case is also the vehicle's skin—at low altitudes only | Aerodynamic heating of case lowers strength of internal insulation in some propellants causing premature failure. Induces thermal stresses. External insulation is a remedy. |
Any structural analysis also requires knowledge of material characteristics and of failure criteria: namely, the maximum stress and strains that can safely be accepted by the propellant under various conditions. Failure criteria are derived from cumulative damage tests, classical failure theories, actual motor failures, and from fracture mechanics. Such analyses may need to be iterative because materials and grain geometries must be changed when analysis shows that desired margins of safety are exceeded.
Analyses based on nonlinear viscoelastic stress theory have not been reliable (see Ref. 12–2). Viscoelastic material behavior modelling, though feasible, is relatively complex requiring material‐property data that are difficult to obtain and uncertain in value. Most structural analyses have been based on elastic material models; they are relatively simpler and two‐ and three‐dimensional finite element analysis computer programs of such an approach have been developed by rocket motor manufacturing companies. Admittedly, the theory does not fit all the facts, but with appropriate empirical corrections some such analyses have given satisfactory answers to structural grain design problems. An example of a two‐dimensional finite element grid from a computer output is shown in Fig. 12–22 for a segment of a grain using an elastic model (see Ref. 12–17).

Figure 12–22 Partial view of a finite element analysis grid of the forward end of a cast grain in a filament‐wound plastic case. The grain has an internal tube (not fully visible) and annular grooves. The left diagram shows the model grid elements and the right shows one calculated strain or deformation condition.
(Reprinted with permission from A. Turchot, Chapter 10 of Ref. 12–1.)
With elastic materials, stress is essentially proportional strain and independent of time, and when the load is removed they return to their original condition. Neither of these propositions is valid for grains or their propellant materials; in viscoelastic material a time‐related dependence exists between stresses and strains and this relationship is not linear, being influenced by the rate of strain. Stresses are not one‐dimensional as many laboratory tests are, but three‐dimensional and more difficult to visualize and when the load is removed the grain does not return to its exact original position. References 12–28 and 12–29 and Chapters 9 and 10 of Ref. 12–1 discuss three‐dimensional analysis techniques in viscoelastic design. A satisfactory analytical description that predicts the influence of cumulative damage has yet to be developed.
Various means have been used to compensate for nonelastic behavior by using allowable stress values degraded for nonlinear effects and/or an effective modulus that uses complicated approximations based on laboratory strain test data. Many use a modified modulus (maximum stress–strain at maximum stress or σm/εm in Fig. 12–21) called the stress relaxation modulus ER in a master curve against temperature‐compensated time to failure, as shown in Fig. 12–23 (see Ref. 12–28 for details). It is constructed from data collected from a series of uniaxial tests at constant strain rate (typically 3 to 5%) performed at different temperatures (typically −55 to +43 °C). A shifted temperature ratio Ts/T is shown in the curve on the upper right for 3% strain rate and sample tests taken at different temperatures. The factor λ in the ordinate corrects for the necking down of the tension sample during test. The small inset in this figure explains the correction for temperature that is applied to the reduced time to failure. The empirical time–temperature shift factor aT is set to zero at ambient temperatures (25 °C or 77 °F) and graphically shifted for higher and lower temperatures. Such a master curve then provides time‐dependent stress–strain data to calculate the response of the propellant for structural analysis (see Ref. 12–14 and Chapter 9 of Ref. 12–1).

Figure 12–23 Stress–relaxation modulus master curve for a particular composite solid propellant constructed with data taken from a number of uniaxial tensile tests at constant strain rate but at different temperatures.
(Reproduced with permission of United Technologies Corp., from Ref. 12–29.)
Usually, several different grain loading and operating conditions need to be analyzed. Such structural analyses are useful for identifying locations of maximum stress or strain and for finding any structural members or grain sectors that are too weak or too heavy. The choice of the best analytical tool and the best pseudo‐viscoelastic compensation factors depends on the experience of the stress analyst, the specific motor design conditions, the complexity of the motor, the geometry, and on suitable, available and valid propellant property data.
For case‐bonded rocket motors, special provisions are required to reduce stress concentrations at the grain ends where the case and grain interface, especially in motors expected to operate satisfactorily over a wide range of temperatures. Basically, high stresses arise from two primary sources: The first one comprises the physical properties, including the coefficient of thermal expansion of the case material and the propellant, when they are grossly dissimilar. The coefficient of expansion of a typical solid propellant is ![]() , which is five times as great as that of a typical steel motor case. The second one arises from the aft‐end and head‐end geometries at the grain–case juncture that often present a discontinuity, where the grain stress theoretically would approach infinity. Actually, finite stresses arise because viscoplastic deformations occur in the propellant, the liner, and the case insulation. Calculating the stress in a given case–grain termination arrangement is usually impractical, and designers rely on approximations supported by empirical data.
, which is five times as great as that of a typical steel motor case. The second one arises from the aft‐end and head‐end geometries at the grain–case juncture that often present a discontinuity, where the grain stress theoretically would approach infinity. Actually, finite stresses arise because viscoplastic deformations occur in the propellant, the liner, and the case insulation. Calculating the stress in a given case–grain termination arrangement is usually impractical, and designers rely on approximations supported by empirical data.
For simple cylindrical grains, the highest stresses usually occur at the outer and inner surfaces, at discontinuities such as the bond surface termination point, or at stress concentration locations such as sharp radii at the roots or tips of star or wagonwheel perforations, as shown in Fig. 12–16. Figure 12–24 shows a stress relief flap, sometimes called a boot, a device to reduce local grain stresses at the cylindrical walls. It is usually an area on the outside of the grain near its aft end (and sometimes also its forward end), where the liner material is not sticky but has a nonadhesive coating that permits the grain to shrink away from the wall. It allows for a reduction of the grain at the bond termination point moving the location of highest stress into the liner or the insulation at the flap termination or hinge. Normally, the liner and insulation are much stronger and tougher than the propellant.

Figure 12–24 Stress relief system. The asterisks in the bottom simplified diagram denote potentially critical failure areas. The top sketch is an enlargement of the aft termination region of the grain and shows a boot or stress relief flap.
Parametric studies of propellant and case‐bond stresses of a typical grain–case termination design (Fig. 12–24) reveal the following:
- Flap length is less significant than the thickness of the insulation of the separate flap boot, if one is used, in controlling the local level of stresses at the grain–case termination.
- The distribution of stresses at the grain–case termination is sensitive to the local geometry; the level of stress at the case bond increases with web fraction and length‐to‐diameter ratio under loading by internal pressure and thermal shrinkage.
- As the L/D and web fraction increase, the inner‐bore hoop stress and the radial stress at the grain–case bond increase more rapidly than does the grain–case termination stress under internal pressure and thermal shrinkage loads.
- The radial case‐bond stress level at the grain–case termination is much larger than the case‐bond shear stress under axial acceleration loading as well as under internal pressure and thermal shrinkage loading.
Aging of propellants in rocket motors refers to deterioration in their physical properties with time. It is caused by any cumulative damage done to the grain (such as by thermal cycling, and/or repetitive load applications) during storage, handling, or transport. It can also be caused by chemical changes with time, such as the gradual depletion (evaporation) of certain liquid plasticizers and/or moisture absorption. The ability to carry stress or to allow for elongation in propellants diminishes with cumulative damage. The aging limit is the estimated time when the motor is no longer able to perform its operation reliably or safely (see Refs. 12–30 and 12–31). Depending on the propellant and the grain design, this age limit or motor life can be between 8 and 25 years. Before this limit is reached, the motor may be deactivated and have its propellant removed and replaced; this refurbishing of propellant is routinely done on larger and more expensive rocket motors in military inventories.
With small tactical rocket motors the aging limit is usually determined by full‐scale motor‐firing tests at various time intervals after manufacture, say two or three years, together with extrapolation to longer time periods. Accelerated temperature aging (more severe thermal cycles) and accelerated mechanical pulse loads and overstressing are often used to reduce the time needed for these tests. For the larger rocket motors, which are more expensive, the number of full‐scale tests has to be relatively small and aging criteria are then developed from structural analysis, laboratory tests, and subscale rocket motor tests.
Many of the early grains were cartridge loaded and kept the grain isolated from the motor case to minimize the interrelation of the case and any grain stresses and strains resulting from thermal expansion or contraction. Also, upon pressurization, the case expands but the grain shrinks. The case‐bonded grain presents a far more complex problem in stress analysis. With the propellant grain bonded firmly to the case, being a semirubbery and relatively weak material, it is forced to respond to case strains. As a result, several critically stressed areas exist in every case‐bonded motor design; some are shown with an asterisk in Fig. 12–24.
The physical character of propellants brings about the varying nature of the stress analysis problem. In summary, solid propellants are relatively weak in tension and shear, are semielastic, grow softer and weaker at elevated temperatures, become hard and brittle at low temperatures, readily absorb and store energy upon being vibrated, degrade physically during long‐term storage because of decomposition and chemical or crystalline changes, and accumulate structural damage under load, including cyclic load. This last phenomenon is shown graphically in Fig. 12–25 and is particularly important in the analysis of rocket motors that are to have a long shelf life (more than 10 years).

Figure 12–25 Representation of the progress in cumulative damage to the bond between the grain and the case in a case‐bonded rocket motor experiencing a hypothetical stress history.
(Adapted from Ref. 12–32.)
No a priori reason is known for materials to exhibit cumulative damage, but propellants and their bond‐to‐case materials do exhibit this trait even under constant load, as shown in Fig. 12–26. Valid theories and analytical methods applicable to cumulative damage include a consideration of both the stress–strain history and the loading path (of the material affected). The most important environmental variables affecting the shelf life of a motor are time, temperature cycles, propellant mass, stress (gravity forces for large motors), and shock and vibration. Failure due to cumulative damage usually appears as cracks in the face of the perforation or as local “unbonds” in case‐bonded motors.

Figure 12–26 Time‐dependent reduction of the propellant–liner–insulator bond strength when subjected to constant load at 77 °F.
(From Ref. 12–33.)
The strength of most propellants is sensitive to the rate of strain; in effect they appear to become more brittle at any given temperature as the strain rate is increased, a physical trait that becomes important during the ignition process.
12.5 ATTITUDE CONTROL AND SIDE MANEUVERS WITH SOLID PROPELLANT ROCKET MOTORS
An ingenious attitude control (also called reaction control) system with solid propellants used with some ballistic missiles is shown schematically in Fig. 12–27. Its hot reaction gases have a low enough temperature so that uncooled hardware can be used for long operating durations. Ammonium nitrate composite propellant (mentioned as gas generator propellants in Tables 13–1 and 13–2) or any propellant consisting of a nitramine (RDX or HMX, described in Chapter 13) with a polymer binding is suitable. The version shown in Fig. 12–27 provides pitch and yaw control, see Chapter 18; hot gas flows continuously through insulated manifolds, open hot gas valves, and all four nozzles. When one of these valves is closed, it causes an imbalance of gas flow producing a side force. The chamber pressure rises when any valve is closed. Four roll‐control thrusters have been deleted from this figure for simplicity.

Figure 12–27 Simplified diagram of a rocket attitude control system using solid propellant. All four valves are normally open and gas flows equally through all nozzles.
With this type of attitude control system it is possible to achieve variable duration thrust pulsing operations and random pitch, yaw, and roll maneuvers. It is competitive with multithruster liquid propellant attitude control systems. The solid propellant versions are usually heavier because they have heavy insulated hardware and require more propellant (for continuous gas flow), whereas the liquid version is operated only when attitude control vehicle motions are required.
A similar approach with hot gas valves applies to upper stages of interceptor vehicles and is used for missile defense; there is little time available for maneuvers of the upper stage to reach the incoming missile or aircraft and therefore the burning durations are usually short. The solid propellant gas temperatures are higher than with gas generators (typically 1260 °C or 2300 °F), but lower than with typical composite propellants (3050 K or 5500 °F), but this requires the valves and manifolds to be made of high‐temperature material (such as rhenium or carbon). In addition to attitude control, the system provides a substantial side force or divert thrust, which displaces the flight path laterally. Figure 12–28 shows such a system. Since all hot gas valves are normally open, a valve has to be closed to obtain thrust as explained in the previous figure. The attitude control system provides pitch, yaw, and roll control to stabilize the vehicle during its flight, to orient the divert nozzle into the desired direction, and sometimes to orient the seeker (at the front of the vehicle) toward the target. Another example is NASA's Orion launch abort control system, which has eight proportionally controlled valves designed to provide up to 7000 lbf of net steering force in any direction. Thrust vector control is treated in Chapter 18.

Figure 12–28 Simplified diagram of two propulsion systems for one type of maneuverable upper stage of an interceptor missile. The side or divert forces are relatively large and go essentially through the center of gravity (CG) of the upper‐stage vehicle. To minimize the CG travel two grains are above and two grains are below the CG. Each nozzle has its own hot gas valve, which is normally open and can be pulsed. The attitude control system (ACS) is fed from the reaction gas of two grains and has six small nozzles.
SYMBOLS
| a | burning rate constant, also called temperature coefficient |
| Ab | solid propellant burning area, m2 (ft2) |
| Ap | port area (flow area of gases inside grain cavity or between and around propellant grains), m2 (ft2). |
| At | nozzle throat cross‐sectional area, m2 (ft2) |
| b | web thickness, m (in.) |
| bf | web fraction, or web thickness‐to‐radius ratio |
| c | effective exhaust velocity, m/sec (ft/sec) |
| characteristic exhaust velocity, m/sec (ft/sec) | |
| cp | specific heat of gas, kcal/kg‐K |
| cs | specific heat of solid, kcal/kg‐K |
| CF | thrust coefficient |
| D | diameter or other dimension, m (ft.) |
| ER | relaxation modulus, MPa (psi) |
| F | thrust, N (lbf) |
| average thrust, N (lbf) | |
| g0 | acceleration due to gravity at sea level, 9.81 m/sec2 (32.2 ft/sec2) |
| G | mass flow velocity per unit area kg/m2 sec |
| h | enthalpy per unit mass, J/kg (Btu/lbm) |
| Is | specific impulse, sec |
| It | total impulse, N‐sec (lbf‐sec) |
| k | specific heat ratio |
| K | ratio of burning surface to throat area, Ab/At |
| L | length, m (ft) |
| m | mass, kg (lbm) |
| mass flow rate, kg/sec | |
| n | burning rate exponent |
| p | pressure, MPa (lbf/in.2) |
| p1 | chamber pressure, MPa (lbf/in.2) |
| Pr | Prandtl number, μcp/k |
| r | propellant burning rate (velocity of consumption), m/sec or mm/sec or in./sec |
| R | gas constant, J/kg‐K (Btu/lbm‐°R) |
| S | perimeter, m |
| t | time, sec |
| ta | action time, sec |
| tb | burn time, sec |
| T | absolute temperature, K (°R) |
| T1 | chamber temperature, K (°R) |
| Tb | propellant ambient temperature, °F(°C) |
| Ts | Propellant initial temperature, °F(°C) |
| theoretical exhaust velocity, m/sec (ft/sec) | |
| Vb | propellant volume, m3 (ft3) |
| Vc | chamber volume, m3 (ft3) |
| Vf | volumetric loading fraction, % |
| w | total effective propellant weight, N (lbf) |
| wG | total loaded rocket weight, or gross weight, N (lbf) |
| weight rate of flow, N/sec (lbf/sec) |
Greek Letters
| α | heat transfer factor |
| β | Constant |
| ε | elongation or strain |
| κ | Conductivity |
| μ | Viscosity |
| πK | temperature sensitivity coefficient of pressure, K–1 (°R−1) |
| ρ | density, kg/m3 (lbm/ft3) |
| σ | stress, N/cm2 (psi) |
| σp | temperature sensitivity coefficient of burning rate, K–1 (°R−1) |
| ζ | propellant mass fraction |
Subscripts
| a | action time |
| b | solid propellant burning conditions |
| e | erosive index |
| m | Maximum |
| p | pressure or propellant or port cavity |
| t | throat conditions |
| 0 | initial or reference condition |
| 1 | chamber condition |
| 2 | nozzle exit condition |
PROBLEMS
- What is the ratio of burning area to nozzle throat area for a solid propellant motor with the characteristics shown below? Also, calculate the temperature coefficient (a) and the temperature sensitivity of pressure (πK).
Propellant specific gravity 1.71 Chamber pressure 14 MPa Burning rate 38 mm/sec Temperature sensitivity σp 0.007 (K) – 1 Specific heat ratio 1.27 Chamber gas temperature 2220 K Molecular mass 23 kg/kg‐mol Burning rate exponent n 0.3 - Plot the burning rate against chamber pressure for the motor in Problem 1 using Eq. 12–5 between chamber pressures of 11 and 20 MPa.
- What would the area ratio Ab/At in Problem 1 be if the pressure were increased by 10%? (Use curve from Problem 2 or Eq. 12–5.)
- Design a simple rocket motor for the conditions given in Problems 1 and 2 for a thrust of 5000 N and for a duration of 15 sec. Determine principal dimensions and approximate weight.
- For the Orbus‐6 rocket motor described in Table 12–3 determine the total impulse‐to‐weight ratio, the thrust‐to‐weight ratio, and the acceleration at start and burnout if the vehicle inert mass and the payload come to about 6000 lbm. Use burn time from Table 12–3 and assume
 ft./sec2.
 - For a cylindrical grain with two slots the burning progresses in finite time intervals approximately as shown by the successive burn surface contours in the following drawing. Draw a similar set of progressive burning surfaces for any one configuration shown in Figure 12–16, and draw an approximate thrust–time curve from these plots, indicating the locations where slivers might remain. Assume the propellant has a low value of n and thus the motor experiences little change in burning rate with chamber pressure.

- Discuss the significance of the web fraction, the volumetric loading ratio, and the L/D ratio in terms of vehicle performance and design influence.
- Equations 12–8 and 12–9 express the influence of temperature on the burning of a solid propellant. Describe how a set of tests should be set up and what should be measured in order to determine these coefficients over a given range of operating conditions.
- What would be the likely changes in burning rate (at 1000 psi), action time, average thrust, action‐time‐average chamber pressure, burn time, and action‐time total impulse for the three rocket motors described in Table 12–3 if each were operated with the rocket motor at a storage temperature lower than that given in the table? Describe what results qualitatively.
- A newly designed case‐bonded rocket motor with a simple end‐burning grain failed and exploded on its first test. The motor worked well for about 20% of its burn time, when the record showed a rapid rise in chamber pressure. It was well conditioned at room temperature before firing, and the inspection records did not show any flaws or voids in the grain. Make a list of possible causes for this failure and give suggestions on what to do in each case to avoid a repetition of the failure.
- For the AP‐CMDB (30%, 150 µm) propellant shown in Fig. 12–8 as the solid dots, find the chamber pressure that would result from an increase of
 (this would correspond to a 30°F change with
  ). Take the reference values as 28 atm and 70°F. Values of n(p1) at various pressure ranges from Fig. 12–7 may be taken as:
Answer:
). Take the reference values as 28 atm and 70°F. Values of n(p1) at various pressure ranges from Fig. 12–7 may be taken as:
Answer:
 atm.
atm. - What will be the percent change in nominal values of At, r, Is, T0, tb, Ab/At and the nozzle throat heat transfer rate, if the Orbus‐6 rocket motor listed in Table 12–3 is to be downgraded in thrust for a particular flight by 15% by substituting a new nozzle with a larger nozzle throat area but the same nozzle exit area? The propellants, grain, insulation, and igniter will be the same.
- What would be the new values of It, Is, p1, F, tb, and r for the first stage of the Minuteman rocket motor described in Table 12–3, if the motor were fired at sea level with the grain temperature 20 °F hotter than the data shown. Use only data from this table.Answers:

- Calculate K‐ratio of the burning area to the nozzle throat area in two separate ways for the STARTM 27 motor using only the data found in Table 12–3. Refer to Figure 12–13 for several of the definitions. Compare the two values of K and comment.
- We may take K as constant when the chamber contour lengths remain within ±15% during propellant burning (see Fig. 12–5). Calculate the variation in thrust that a ±8% change would represent in a rocket motor with a fixed nozzle geometry and
 . What would be the corresponding changes in thrust and mass‐flow rate. State your assumptions noting that in the real world some nozzle erosion and other effects may occur.
REFERENCES
- 12–1. P. R. Evans, Chapter 4A, “Composite Motor Case Design”; H. Badham and G. P. Thorp, Chapter 6, “Considerations for Designers of Cases for Small Solid Propellant Rocket Motors”; B. Zeller, Chapter 8, “Solid Propellant Grain Design”; D. I. Thrasher, Chapter 9, “State of the Art of Solid Propellant Rocket Motor Grain Design in the United States”; and A. Truchot, Chapter 10, “Design and Analysis of Rocket Motor Internal Insulation”; all in Design Methods in Solid Propellant Rocket Motors, AGARD Lecture Series 150, Revised Version, NATO, Brussels, 1988.
- 12–2. L. H. Caveney, R.L. Geisler, R, A. Ellis, and T. L. Moore, “Solid Rocket Enabling Technologies and Milestones in the United States,” Journal of Propulsion and Power, Vol. 19, No. 6, Nov.—Dec. 2003, pp. 1038–1066.
- 12–3. E. Gautronneau, M. Darant, and E. Vari, “Vega Program the P80 FW SRM Nozzle,” Report ESA 42‐113‐1, 2008.
- 12–4. N. Kubota, Chapter 1, “Survey of Rocket Propellants and Their Combustion Characteristics,” in Fundamentals of Solid Propellant Combustion; K. K. Kuo and M. Summerfield (Eds.), Progress in Astronautics and Aeronautics, Vol. 90, AIAA, New York, 1984. See also A. Davenas, Development of Modern Solid Propellants, Journal of Propulsion and Power, Vol. 19, No. 6, May–Jun. 2003, pp. 1108–1128; V. Yang, T. B. Brill, and W.‐Z. Ren (Eds.), Solid Propellant Chemistry, Combustion, and Motor Interior Ballistics, Progress in Aeronautics and Astronautics, Vol. 185, AIAA, Reston, VA, 2000.
- 12–5. S. D. Heister and J. Davis, Predicting Burning Time‐Variations in Solid Rocket Motors, Journal of Propulsion and Power, Vol. 8, No. 3, May–June 1992; J. R. Osborn and S. D. Heister, Solid Rocket Motor Temperature Sensitivity, Journal of Propulsion and Power, Vol. 10, No. 6, November–December 1994, pp. 908–910.
- 12–6. M. K. Razdan and K. Kuo, Chapter 10, “Erosive Burning of Solid Propellants,” in Fundamentals of Solid Propellant Combustion, K. K. Kuo and M. Summerfield (Eds.), Progress in Astronautics and Aeronautics, Vol. 90, AIAA, New York, 1984.
- 12–7. E. M. Landsbaum, “Erosive Burning Revisited,” AIAA Paper 2003‐4805, Jul. 2003.
- 12–8. “Solid Propellant Selection and Characterization,” NASA SP‐8064, Jun. 1971 (N72‐13737).
- 12–9. M. S. Fuchs, A. Peretz, and Y. M. Timnat, “Parametric Study of Acceleration Effects on Burning Rates of Metallized Solid Propellants,” Journal of Spacecraft and Rockets, Vol. 19, No. 6, Nov.–Dec. 1982, pp. 539–544.
- 12–10. P. Yang, Z. Huo, and Z. Tang, Chapter 3, “Combustion Characteristics of Aluminized HTPB/AP Propellants in Acceleration Fields,” in V. Yang, T. B. Brill and W.‐Z. Ren (Eds.), Solid Propellant Chemistry, Combustion, and Motor Interior Ballistics, Progress in Aeronautics and Astronautics, Vol. 185, AIAA, Reston VA, 2000.
- 12–11. K. K. Kuo, J. Moreci, and J. Mantzaras, “Modes of Crack Formation in Burning Solid Propellant,” Journal of Propulsion and Power, Vol. 3, No. 1, Jan.–Feb. 1987, pp. 19–25.
- 12–12. M. K. King, “Analytical Modeling of Effects of Wires on Solid Motor Ballistics,” Journal of Propulsion and Power, Vol. 7, No. 3, May–Jun. 1991, pp. 312–320.
- 12–13. D. R. Greatrix, “Correlation of Pressure Rise with Radial Vibration Level in Solid Rocket Motors,” AIAA Paper 95‐2880, July 1995; “Simulation of Axial Combustion Instability Development and Suppression in Rocket Motors,” International Journal of Spray and Combustion Dynamics, Vol. 1, No, 1, 2009, pp. 143–168.
- 12–14. R. Mannepalli, “Automatic Computation of Burning Time of Solid Rocket Motors Using the Aft‐Tangent Method,” Report SRO‐SHAR‐TR‐07‐96‐92, ISRO (Indian Space Rocket Organization, Bangalore), 1992.
- 12–15. R. Mannepalli, “Automatic Computation of Burning Time of Solid Rocket Motors Using the Chord‐Midpoint Method”, Report SRO‐SHAR‐TR‐07‐95‐90, ISRO (Indian Space Rocket Organization, Bangalore), 1990.
- 12–16. “Solid Rocket Motor Performance Analysis and Prediction,” NASA SP‐8039, May 1971 (N72‐18785).
- 12–17. E. M. Landsbaum, M. P. Salinas, and J. P. Leavy, “Specific Impulse Predictions of Solid Propellant Motors,” Journal of Spacecraft and Rockets, Vol. 17, 1980, pp. 400–406.
- 12–18. R. Akiba and M. Kohno, “Experiments with Solid Rocket Technology in the Development of M‐3SII,” Acta Astronautica, Vol. 13, No. 6–7, 1986, pp. 349–361.
- 12–19. “SPP'04TM,” Computer Program from Software & Engineering Associates, Inc., http://www.seainc.com
- 12–20. R. J. Hejl and S. D. Heister, “Solid Rocket Motor Grain Burnback Analysis Using Adaptive Grids,” Journal of Propulsion and Power, Vol. 11, No. 5, Sept.–Oct. 1995.
- 12–21. W. H. Jolley, J. F. Hooper, P. R. Holton, and W. A. Bradfield, “Studies on Coning in End‐Burning Rocket Motors,” Journal of Propulsion and Power, Vol. 2, No. 2, May–Jun. 1986, pp. 223–227.
- 12–22. L. C. Carrier, T. Constantinou, P. G. Harris, and D. L. Smith, “Dual Interrupted Thrust Pulse Motor,” Journal of Propulsion and Power, Vol. 3, No. 4, Jul.–Aug. 1987, pp. 308–312.
- 12–23. C. Bruno et al., “Experimental and Theoretical Burning of Rocket Propellant near the Pressure Deflagration Limit,” Acta Astronautica, Vol. 12, No. 5, 1985, pp. 351–360.
- 12–24. F. N. Kelley, Chapter 8, “Solid Propellant Mechanical Property Testing, Failure Criteria and Aging,” in C. Boyars and K. Klager (Eds.), Propellant Manufacture Hazards and Testing, Advances in Chemistry Series 88, American Chemical Society, Washington, DC, 1969.
- 12–25. T. L. Kuhlmann, R. L. Peeters, K. W. Bills, and D. D. Scheer, Modified Maximum Principal Stress Criterion for Propellant Liner Bond Failures, Journal of Propulsion and Power, Vol. 3, No. 3, May–Jun. 1987.
- 12–26. R. W. Magness and J. W. Gassaway, “Development of a High Performance Rocket Motor for the Tactical VT‐1 Missile,” AIAA Paper 88‐3325, July 1988.
- 12–27. I‐Shih Chang and M. J. Adams, “Three‐Dimensional, Adaptive, Unstructured, Mesh Generation for Solid‐Propellant Stress Analysis,” AIAA Paper 96‐3256, July 1996.
- 12–28. G. Meili, G. Dubroca, M. Pasquier, and J. Thenpenier, “Nonlinear Viscoelastic Design of Case‐Bonded Composite Modified Double Base Grains,” AIAA Paper 80‐1177R, July 1980; and S. Y. Ho and G. Care, “Modified Fracture Mechanics Approach in Structural Analysis of Solid‐Rocket Motors,” Journal of Propulsion and Power, Vol. 14, No. 4, Jul.–Aug. 1998.
- 12–29. P. G. Butts and R. N. Hammond, “IUS Propellant Development and Qualification,” Paper presented at the 1983 JANNAF Propulsion Meeting, Monterey, CA, Feb. 1983.
- 12–30. A. G. Christianson et al., “HTPB Propellant Aging,” Journal of Spacecraft and Rockets, Vol. 18, No. 3, May–Jun. 1983; D. Zhou et al., “Accelerated Aging and Structural Integrity Analysis Approach to Predict Service Life of Solid Rocket Motors,” AIAA Paper 2015‐4240, Orlando, FL, 2015.
- 12–31. D. I. Thrasher and J. H. Hildreth, “Structural Service Life Estimates for a Reduced Smoke Rocket Motor,” Journal of Spacecraft and Rockets, Vol. 19, No. 6, Nov. 1982, pp. 564–570.
- 12–32. S. W. Tsa, Ed., Introduction to Viscoelasticity, Technomic, Stanford, CT, 1968.
- 12–33. J. D. Ferry, Viscoelastic Properties of Polymers, John Wiley & Sons, New York, 1970.