18. Working with Reports in QuickBooks
QuickBooks is all about reports. All the information you enter on forms, registers, and journal entries is stored in QuickBooks, waiting for you to pull it out in reports. Reports show you the results of all your company’s financial transactions. You can display reports, print them, save them, email them, and rely on the information they provide to show you how well your company is meeting your expectations.
QuickBooks comes with a large collection of reports to help you understand your business. You can customize all the QuickBooks reports so they display exactly the information you need.
You can access all the QuickBooks reports from the Reports menu and also by clicking the Report Center button on your Icon bar. The Report Center provides you with a sample view of what each report displays, so if you’re not certain which reports you want to work with, the Report Center is probably going to be more helpful to you than just picking a title from the Reports menu.
Use reports to show potential lenders and investors why they should commit funds to your company. Use reports to supply your accountant with information necessary to prepare tax forms, and use reports to compare your company’s actual performance with the budget. Use reports to keep track of who owes you money and to whom you owe money.
Company Snapshot
Get instant views into the bottom line with at-a-glance reports that feature easy-to-read graphics. See data from multiple years side-by-side for a quick comparison.
These reporting tools are commonly referred to as digital dashboards and provide real-time visual views of a company’s critical information. The improved QuickBooks offers the ability to customize the information shown and is now user- and company file-specific when you work in a multi-user environment.
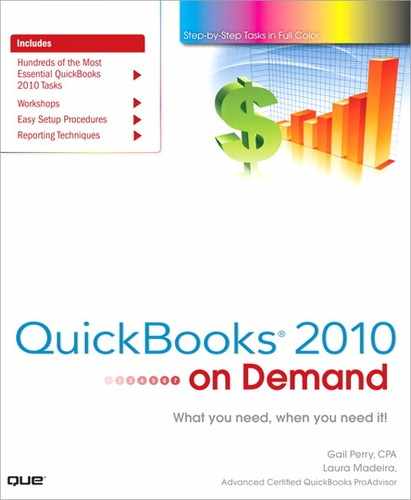
![]() From the Icon bar, select Company Snapshot to view the default graphs and reports.
From the Icon bar, select Company Snapshot to view the default graphs and reports.
![]() Click Add Content to view and select from additional graphs and reports.
Click Add Content to view and select from additional graphs and reports.

![]() Click Print to print or preview the Company Snapshot.
Click Print to print or preview the Company Snapshot.
![]() Click a + Add button to add that graph or report to your Company Snapshot.
Click a + Add button to add that graph or report to your Company Snapshot.
![]() Click Restore Defaults to remove any graphs or reports you added.
Click Restore Defaults to remove any graphs or reports you added.
![]() Click Done to view your modified Company Snapshot.
Click Done to view your modified Company Snapshot.
![]() To rearrange the order or placement of a graph and report, click and hold your left mouse button (a move Icon displays), drag the item to a new location, and release the button.
To rearrange the order or placement of a graph and report, click and hold your left mouse button (a move Icon displays), drag the item to a new location, and release the button.

Using the Improved Report Center
If you are new to QuickBooks or if you have never reviewed the QuickBooks Report Center, in this section you can find out about the many features available for simplifying your reporting needs in QuickBooks. Use the Report Center to find standard, memorized, favorite, or recently run reports. You can browse through sample report images, report descriptions, or both.
Carousel View
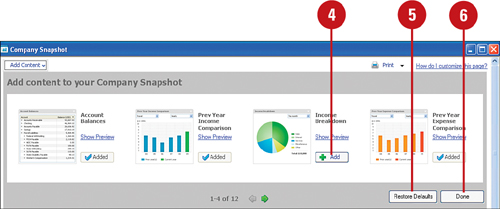
![]() To open the Report Center, select Report Center from the Icon bar or from the Reports menu (not shown).
To open the Report Center, select Report Center from the Icon bar or from the Reports menu (not shown).
![]() Click to view the reports or graphs in Carousel View.
Click to view the reports or graphs in Carousel View.
![]() Click to select a Report Center tab.
Click to select a Report Center tab.
![]() Click to select a report group within the selected tab. The report groups available will differ depending on your version of QuickBooks.
Click to select a report group within the selected tab. The report groups available will differ depending on your version of QuickBooks.
![]() Use the scroll bar to move the carousel view through samples of the reports available in the selected report group. Data displayed is sample data.
Use the scroll bar to move the carousel view through samples of the reports available in the selected report group. Data displayed is sample data.
![]() Click the Dates drop-down menu to select a specific date, or accept the default date. (You can also modify the date on the displayed report.)
Click the Dates drop-down menu to select a specific date, or accept the default date. (You can also modify the date on the displayed report.)
![]() Click to display the report details with your company data.
Click to display the report details with your company data.
![]() Click to Mark or Unmark as favorite. Marking a report as a favorite places it on the Favorites Report Center tab.
Click to Mark or Unmark as favorite. Marking a report as a favorite places it on the Favorites Report Center tab.
![]() Click to open Help information about the specific report.
Click to open Help information about the specific report.
![]() Optionally, click to close the menu report group listing on the selected tab.
Optionally, click to close the menu report group listing on the selected tab.
List View
![]() To open the Report Center, select Report Center from the Icon bar or, optionally, open from the Reports menu (not shown).
To open the Report Center, select Report Center from the Icon bar or, optionally, open from the Reports menu (not shown).
![]() Click to view the reports or graphs in List View.
Click to view the reports or graphs in List View.

![]() Click to select the desired Report Center tab.
Click to select the desired Report Center tab.
![]() Click to select a report group within the selected tab. The report groups available will differ depending on your version of QuickBooks.
Click to select a report group within the selected tab. The report groups available will differ depending on your version of QuickBooks.
![]() Click once to select a report or graph.
Click once to select a report or graph.
![]() With a report selected in list view, the Dates drop-down displays; select your preferred date range.
With a report selected in list view, the Dates drop-down displays; select your preferred date range.
![]() Click to display the report with your company data.
Click to display the report with your company data.
Grid View
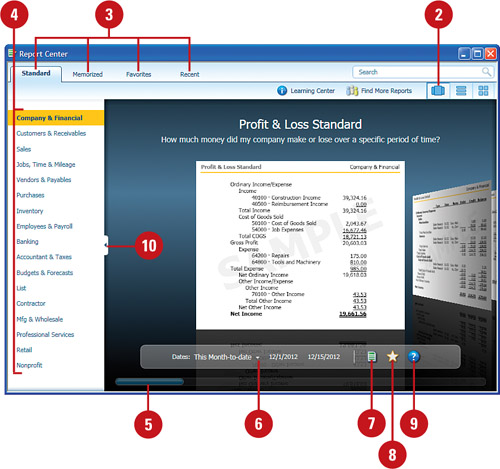
![]() To open the Report Center, select Report Center from the Icon bar or, optionally, open the Reports menu (not shown).
To open the Report Center, select Report Center from the Icon bar or, optionally, open the Reports menu (not shown).
![]() Click to view the reports or graphs in Grid View.
Click to view the reports or graphs in Grid View.
![]() Click the desired tab in the Report Center.
Click the desired tab in the Report Center.
![]() Click the desired report grouping. A grid view of available reports is displayed with sample data.
Click the desired report grouping. A grid view of available reports is displayed with sample data.
![]() Use the scroll bar to view the available reports and graphs.
Use the scroll bar to view the available reports and graphs.
![]() With a report selected, click to change the report dates.
With a report selected, click to change the report dates.
![]() Click to view a thumbnail of the report with sample data.
Click to view a thumbnail of the report with sample data.
![]() Click to display the report with your company data.
Click to display the report with your company data.
![]() Click to add to the Favorites tab of the Report Center.
Click to add to the Favorites tab of the Report Center.
Setting Report and Graph Preferences
Make some basic decisions up front about how your reports and graphs should appear, and you won’t have to think about these choices every time you open a report. Each QuickBooks user at your company can set personal report preferences. Company-wide preferences, such as text formatting and the way numbers appear, affect reports that are accessible by all users.
Set Personal Reports and Graphs Preferences
![]() Select Edit, Preferences to open the Preferences window.
Select Edit, Preferences to open the Preferences window.
![]() Click the Reports & Graphs link.
Click the Reports & Graphs link.
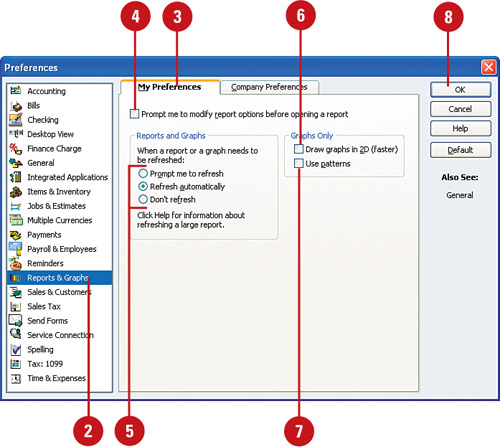
![]() Click the My Preferences tab.
Click the My Preferences tab.
![]() Check the Prompt Me to Modify Report checkbox if you always want the customizing options to appear when you view reports.
Check the Prompt Me to Modify Report checkbox if you always want the customizing options to appear when you view reports.
![]() Select a refresh option to indicate whether you want a report to update automatically when you make a change.
Select a refresh option to indicate whether you want a report to update automatically when you make a change.
![]() Check Draw Graphs in 2D (faster) if you like your graphs in two-dimensional style instead of the default three-dimensional.
Check Draw Graphs in 2D (faster) if you like your graphs in two-dimensional style instead of the default three-dimensional.
![]() Check Use Patterns to produce graphs in shades of black, gray, and white instead of full color. This is the best choice if you plan to print graphs on a black-and-white printer.
Check Use Patterns to produce graphs in shades of black, gray, and white instead of full color. This is the best choice if you plan to print graphs on a black-and-white printer.
![]() Click OK, or see the next task to set additional preferences.
Click OK, or see the next task to set additional preferences.
Set Company-Wide Reports and Graphs Preferences
![]() Select Edit, Preferences.
Select Edit, Preferences.
![]() Click the Reports & Graphs link.
Click the Reports & Graphs link.

![]() Click the Company Preferences tab.
Click the Company Preferences tab.
![]() Select whether to present reports on a cash basis or an accrual basis.
Select whether to present reports on a cash basis or an accrual basis.
![]() Select whether you prefer aging reports such as the Accounts Receivable Aging Report aged from the invoice due date or the transaction date.
Select whether you prefer aging reports such as the Accounts Receivable Aging Report aged from the invoice due date or the transaction date.
![]() Indicate how you want account names and descriptions displayed on reports.
Indicate how you want account names and descriptions displayed on reports.
![]() Click Classify Cash to select which accounts you want to include in your Statement of Cash Flows.
Click Classify Cash to select which accounts you want to include in your Statement of Cash Flows.
![]() Click Format to make format choices for your report.
Click Format to make format choices for your report.
![]() Check off each item that should normally appear on your reports.
Check off each item that should normally appear on your reports.
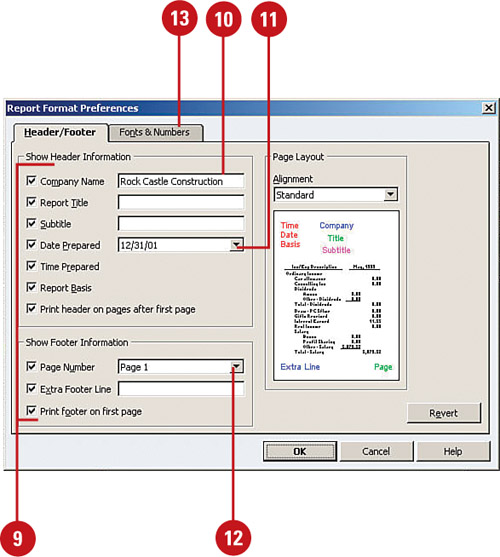
![]() Enter your company name the way you want it to appear on reports.
Enter your company name the way you want it to appear on reports.
![]() Click the arrow to select from several date styles.
Click the arrow to select from several date styles.
![]() Click the arrow to select from several page styles.
Click the arrow to select from several page styles.
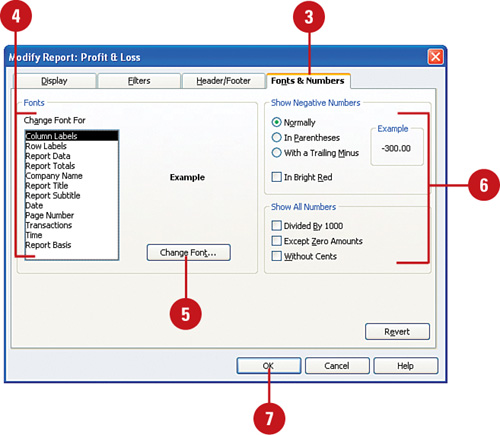
![]() Click the Fonts & Numbers tab to set preferences for font style and number presentation on your reports.
Click the Fonts & Numbers tab to set preferences for font style and number presentation on your reports.
![]() Click a report element from the Change Font For list.
Click a report element from the Change Font For list.
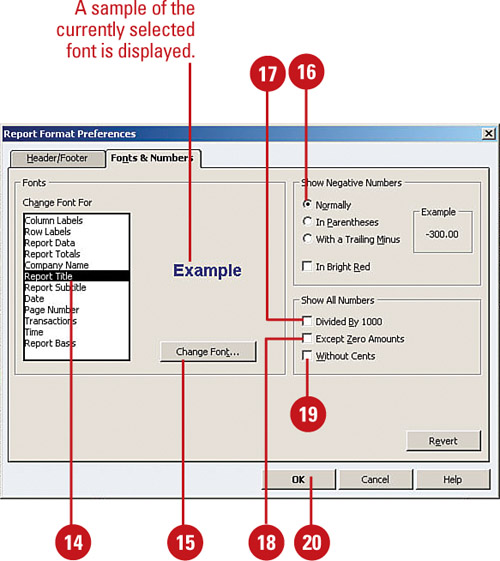
![]() Click Change Font to change the font selection for the selected title.
Click Change Font to change the font selection for the selected title.
![]() Select a preference for displaying negative numbers.
Select a preference for displaying negative numbers.
![]() Check Divided by 1000 to show report amounts divided by 1,000.
Check Divided by 1000 to show report amounts divided by 1,000.
![]() Check Except Zero Amounts to omit zero amounts from reports.
Check Except Zero Amounts to omit zero amounts from reports.
![]() Check Without Cents to display amounts without cents.
Check Without Cents to display amounts without cents.
![]() Click OK to close each of the preference windows.
Click OK to close each of the preference windows.
Modifying Reports
QuickBooks makes gathering information from your data quick and easy. Though many reports are already created and organized for your use, you might want to modify an existing report.
Display Options
![]() Display a report in your QuickBooks data using any of the instructions in the “Using the Improved Report Center” section earlier in this chapter.
Display a report in your QuickBooks data using any of the instructions in the “Using the Improved Report Center” section earlier in this chapter.
![]() Click Modify Report. The Display tab is shown by default. The type of information that can be modified will vary depending on the report that is currently open.
Click Modify Report. The Display tab is shown by default. The type of information that can be modified will vary depending on the report that is currently open.


![]() Click to change the selected report dates.
Click to change the selected report dates.
![]() Click to toggle between Accrual and Cash Basis reporting. The default is set in reporting preferences.
Click to toggle between Accrual and Cash Basis reporting. The default is set in reporting preferences.
![]() Select what data you want to display in the report. This information will vary greatly depending on the report that is displayed.
Select what data you want to display in the report. This information will vary greatly depending on the report that is displayed.
![]() Click the Advanced button to choose which rows and columns you wish to display on the report.
Click the Advanced button to choose which rows and columns you wish to display on the report.
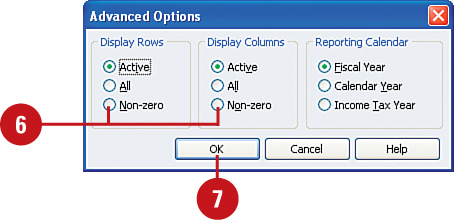
![]() Click OK to close the Advanced Options.
Click OK to close the Advanced Options.
![]() Click OK to return to the report, or click one of the other tabs to continue modifying the report.
Click OK to return to the report, or click one of the other tabs to continue modifying the report.
Filters Options
![]() Display a report in your QuickBooks data using any of the instructions in the “Using the Improved Report Center” section.
Display a report in your QuickBooks data using any of the instructions in the “Using the Improved Report Center” section.
![]() Click Modify Report. The Display tab is shown by default.
Click Modify Report. The Display tab is shown by default.
![]() Click the Filters tab.
Click the Filters tab.

![]() In the Choose Filter pane, select the specific item you want to include in the filters. The example shown is filtering for Account.
In the Choose Filter pane, select the specific item you want to include in the filters. The example shown is filtering for Account.
![]() With the item type selected to the left, click the drop-down menu or other options offered. If offered a drop-down, scroll up and down through the options available.
With the item type selected to the left, click the drop-down menu or other options offered. If offered a drop-down, scroll up and down through the options available.
![]() Review your filter choices.
Review your filter choices.
![]() To remove a filter, click the filter item and then click Remove Selected Filter.
To remove a filter, click the filter item and then click Remove Selected Filter.
![]() When you have finished setting all of your filters, click OK to return to the report, or click one of the other tabs to continue modifying the report.
When you have finished setting all of your filters, click OK to return to the report, or click one of the other tabs to continue modifying the report.
Header/Footer Options
![]() Display a report in your QuickBooks data using any of the instructions in the “Using the Improved Report Center” section.
Display a report in your QuickBooks data using any of the instructions in the “Using the Improved Report Center” section.
![]() Click Modify Report. The Display tab is shown by default.
Click Modify Report. The Display tab is shown by default.
![]() Click the Header/Footer tab.
Click the Header/Footer tab.

![]() Modify the Show Header Information; it is recommend that you keep these defaults.
Modify the Show Header Information; it is recommend that you keep these defaults.
![]() Modify the Show Footer Information.
Modify the Show Footer Information.
![]() Modify the alignment of the report.
Modify the alignment of the report.
![]() Click OK to return to the report, or click one of the other tabs to continue modifying the report.
Click OK to return to the report, or click one of the other tabs to continue modifying the report.
Fonts & Number Options
![]() Display a report in your QuickBooks data using any of the instructions in the “Using the Improved Report Center” section.
Display a report in your QuickBooks data using any of the instructions in the “Using the Improved Report Center” section.
![]() Click Modify Report. The Display tab is shown by default.
Click Modify Report. The Display tab is shown by default.
![]() Click the Fonts & Numbers tab.
Click the Fonts & Numbers tab.
![]() From the Change Fonts For list, select the data for which you want to change the font.
From the Change Fonts For list, select the data for which you want to change the font.
![]() Click the Change Font button to display the Column Labels dialog (not shown). Click OK to return to the Modify Report dialog.
Click the Change Font button to display the Column Labels dialog (not shown). Click OK to return to the Modify Report dialog.
![]() Choose how you want to display negative numbers and other display options.
Choose how you want to display negative numbers and other display options.
![]() Click OK to return to the report, or click one of the other tabs to continue modifying the report.
Click OK to return to the report, or click one of the other tabs to continue modifying the report.
Creating and Using Report Groups
If you have not set up your own customized report groups, you might not know how easy they are to work with and how efficient they can make reporting on your QuickBooks data. This section highlights how to create and use report groups.
One purpose of using report groups is the convenience of printing or displaying a batch of related reports at one time. For example, your accountant has requested that you review certain reports prior to his visit. When the requested reports are memorized and placed in a report group, you save time and are better prepared for your accountant’s review of your data because you can prepare them all at one time.
Creating a Report Group
![]() Click Reports from the menu bar.
Click Reports from the menu bar.
![]() Select Memorized Reports, Memorized Report List.
Select Memorized Reports, Memorized Report List.

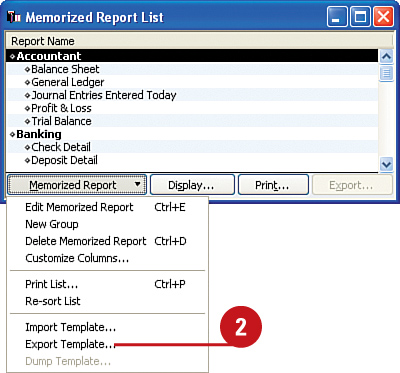
![]() The Memorized Report List dialog displays. Click Memorized Report, New Group.
The Memorized Report List dialog displays. Click Memorized Report, New Group.

![]() Type a Name to identify the group (not shown).
Type a Name to identify the group (not shown).
![]() Click OK (not shown).
Click OK (not shown).
![]() The memorized report list displays with your newly created report group in bold type.
The memorized report list displays with your newly created report group in bold type.

![]() To exit, click the red X in the top-right corner.
To exit, click the red X in the top-right corner.
Using Report Groups
![]() To process a batch of related reports, click Reports and choose Process Multiple Reports.
To process a batch of related reports, click Reports and choose Process Multiple Reports.
![]() From the Process Multiple Reports dialog, click to select the group of reports you want to display or print.
From the Process Multiple Reports dialog, click to select the group of reports you want to display or print.

![]() Place a check mark to include the report or remove the check mark for those reports you do not want to run (not shown).
Place a check mark to include the report or remove the check mark for those reports you do not want to run (not shown).
![]() Modify the From and To dates if needed.
Modify the From and To dates if needed.
Important
Changing the From and To dates in the Process Multiple Reports dialog is only temporary. If you want the date change to be permanent, you need to re-create the report and memorize it again.
![]() Click an option to Display or Print.
Click an option to Display or Print.
Memorizing Reports
After you have created a report group, you will want to use the memorize feature to place reports in that group. Placing your memorized reports in a group is optional, but using groups will help keep your memorized reports organized.
![]() Display a report in your QuickBooks data using any of the instructions in the “Using the Improved Report Center” section earlier in this chapter.
Display a report in your QuickBooks data using any of the instructions in the “Using the Improved Report Center” section earlier in this chapter.
![]() Click the Memorize button on the active report dialog.
Click the Memorize button on the active report dialog.
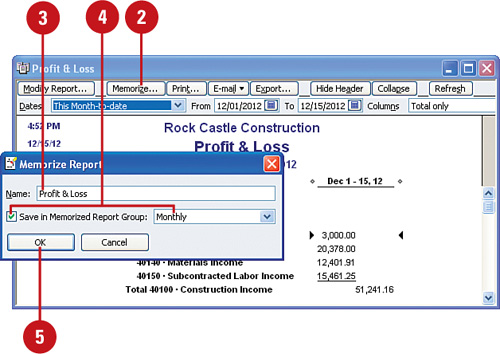
![]() Type a Name for the report or accept the default name.
Type a Name for the report or accept the default name.
![]() To save your report in a group, click Save in Memorized Report Group and choose the appropriate group from the drop-down menu.
To save your report in a group, click Save in Memorized Report Group and choose the appropriate group from the drop-down menu.
![]() Click OK to memorize your report and return to the displayed report.
Click OK to memorize your report and return to the displayed report.
Importing and Exporting Report Templates
QuickBooks offers the option to import and export report templates. This feature is useful for accountants who want to save time by having several clients use the same report template. You can export and import a single report or a group of reports only from the memorized report list. So before you attempt to export a report, be sure QuickBooks memorizes it first.
Importing Report Templates
![]() Click Reports, Memorized Reports. The Memorized Report List dialog appears.
Click Reports, Memorized Reports. The Memorized Report List dialog appears.
![]() On the Memorized Report List dialog, select Import Template from the Memorized Report drop-down menu.
On the Memorized Report List dialog, select Import Template from the Memorized Report drop-down menu.
![]() The Select File to Import dialog appears in Windows Explorer, enabling you to browse to the stored location of the .QBR template.
The Select File to Import dialog appears in Windows Explorer, enabling you to browse to the stored location of the .QBR template.
![]() Select the appropriate .QBR report or report group template.
Select the appropriate .QBR report or report group template.

![]() Click Open. The Memorize Report dialog displays.
Click Open. The Memorize Report dialog displays.
![]() Type a name for the report or accept the default report name.
Type a name for the report or accept the default report name.
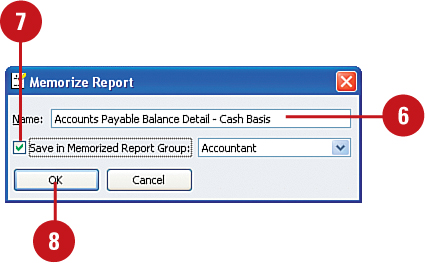
![]() If you want to assign the report to a group, check the box and indicate the name of the Memorized Report Group.
If you want to assign the report to a group, check the box and indicate the name of the Memorized Report Group.
![]() Click OK to add the report to your memorized report list.
Click OK to add the report to your memorized report list.
Exporting Report Templates
![]() Click Reports, Memorized Reports. The Memorized Reports List dialog displays.
Click Reports, Memorized Reports. The Memorized Reports List dialog displays.
![]() Click once to select the report on the list that you want to export (not shown).
Click once to select the report on the list that you want to export (not shown).
![]() On the Memorized Reports List dialog, select Export Template from the Memorized Report drop-down menu (not shown).
On the Memorized Reports List dialog, select Export Template from the Memorized Report drop-down menu (not shown).
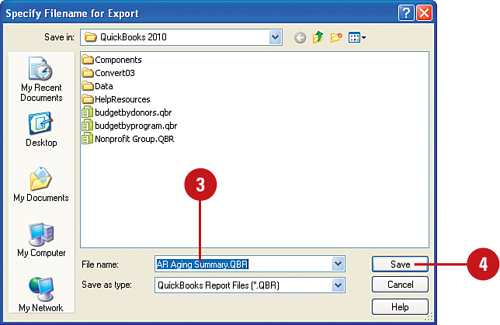
![]() The Specify Filename for Export dialog displays in Windows Explorer; type a file name (or accept the default name assigned).
The Specify Filename for Export dialog displays in Windows Explorer; type a file name (or accept the default name assigned).
![]() Click Save to store the file with an extension of .QBR.
Click Save to store the file with an extension of .QBR.
![]() To share this report with others, copy the .QBR file to a USB removable device or attach it to an email.
To share this report with others, copy the .QBR file to a USB removable device or attach it to an email.
Important
Not all reports can be exported. If the report has been customized with filters for unique list items that another data file might not have, such as a unique chart of accounts, a warning will display that the report cannot be exported.
Other Reporting Tips and Tricks
You have learned some of the most useful tools for working with reports in QuickBooks. You might want to email your financials to your banking institution if you are applying for a loan. Or perhaps your accountant needs to do some tax planning and requests that certain reports to be forwarded to him via Microsoft Excel. Or perhaps you just want to collapse the information in summary form, making it easier to analyze. Here are some useful tips and tricks for making QuickBooks even easier to use for reporting.
Emailing Reports
![]() To set your default preferences and text for emailing forms, select Edit, Preferences, and choose the Send Forms preference.
To set your default preferences and text for emailing forms, select Edit, Preferences, and choose the Send Forms preference.
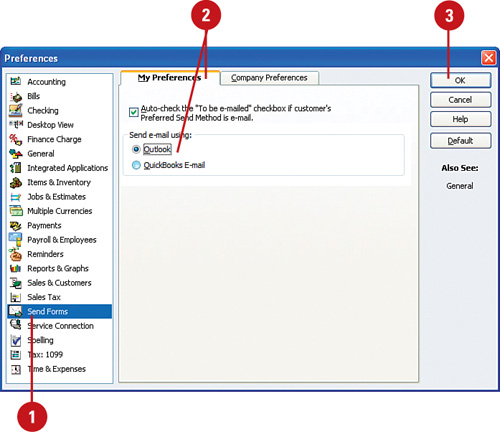
![]() Click the My Preferences tab to select to send your email via Outlook or QuickBooks E-mail.
Click the My Preferences tab to select to send your email via Outlook or QuickBooks E-mail.
Important
The option to select Outlook will only display if you have Microsoft Outlook installed on the same computer as the QuickBooks data file.
![]() Click OK.
Click OK.
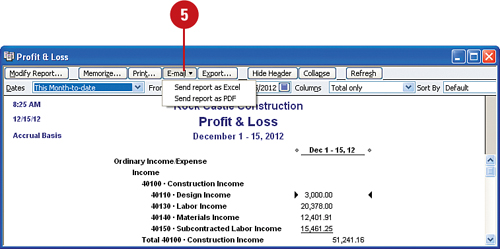
![]() Display a report in your QuickBooks data using any of the instructions in the “Using the Improved Report Center” section.
Display a report in your QuickBooks data using any of the instructions in the “Using the Improved Report Center” section.
![]() Click the Email drop-down menu. Select your preference to attach the report as an Excel or PDF file attachment.
Click the Email drop-down menu. Select your preference to attach the report as an Excel or PDF file attachment.
![]() If you are sending the report via Outlook (not shown), an Outlook new mail will open with the attachment. You can then use Outlook editing features before sending.
If you are sending the report via Outlook (not shown), an Outlook new mail will open with the attachment. You can then use Outlook editing features before sending.
![]() If you are sending the report via QuickBooks E-Mail (not shown), you can modify the default text that was assigned to the email, as defined in step 1.
If you are sending the report via QuickBooks E-Mail (not shown), you can modify the default text that was assigned to the email, as defined in step 1.
Exporting Reports to Excel or .csv File Format
![]() Display a report in your QuickBooks data using any of the instructions in the “Using the Improved Report Center” section earlier in this chapter.
Display a report in your QuickBooks data using any of the instructions in the “Using the Improved Report Center” section earlier in this chapter.
![]() Click Export. The Export Report dialog displays with the Basic tab selected.
Click Export. The Export Report dialog displays with the Basic tab selected.

![]() Choose an export option that meets your needs.
Choose an export option that meets your needs.
![]() Click the Advanced tab for more export options (not shown).
Click the Advanced tab for more export options (not shown).
![]() Click Export to create an Excel workbook or .csv file.
Click Export to create an Excel workbook or .csv file.
Hiding Header and Collapsing Details
![]() Display a report in your QuickBooks data using any of the instructions in the “Using the Improved Report Center” section earlier in this chapter.
Display a report in your QuickBooks data using any of the instructions in the “Using the Improved Report Center” section earlier in this chapter.
![]() Click Hide Header. The report dialog displays without the report header (not shown).
Click Hide Header. The report dialog displays without the report header (not shown).
![]() Click Collapse. The report displayed rolls up subaccounts into the assigned primary account.
Click Collapse. The report displayed rolls up subaccounts into the assigned primary account.
