
Deciding the optimum value of K is one of the tough parts while performing a k-means clustering. There are a few methods that can be used to do this.
We earlier discussed that a good cluster is defined by the compactness between the observations of that cluster. The compactness is quantified by something called intra-cluster distance. The intra-cluster distance for a cluster is essentially the sum of pair-wise distances between all possible pairs of points in that cluster.
If we denote intra-cluster distance by W, then for a cluster k intra-cluster, the distance can be denoted by:

Generally, the normalized intra-cluster distance is used, which is given by:
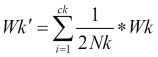
Here Xi and Xj are points in the cluster, Mk is the centroid of the cluster, Nk is the number of points in the centroid, and K is the number of clusters.
Wk' is actually a measure of the variance between the points in the same cluster. Since it is normalized, its value would range from 0 to 1. As one increases the number of clusters, the value of Wk' increases marginally until a certain point post of this marginal increase stops. At this point, we get an elbow in the curve and this gives us the correct number of the cluster as shown in the following graph:

Fig. 7.27: Elbow method to find the correct K
As shown in the preceding plot for a hypothetical dataset, the percentage variance explained by the clusters peaks at k=4, post which the marginal increase stops. This encircled point in the preceding graph is called the elbow that gives the name to the method. The correct number of clusters in this case is then 4.
Silhouette Coefficient for an observation in the dataset quantifies how tightly the point is bound to the other points in the same cluster and how loosely the point is bound to points in the nearest neighbor cluster. The Silhouette Coefficient is calculated using the mean intra-cluster distance (b) and the mean nearest-cluster distance (a) for each sample:
Let us have a look at the following example to understand the concept of the Silhouette Coefficient better:

Fig. 7.28: Illustrating a silhouette coefficient
Let us look at the preceding situation for the point (observation) marked X. It has two nearby clusters, A and B; A being relatively closer to X than B. The mean intra-cluster distance of X from the points in A is denoted by a. The mean intra-cluster distance of X from the points in the next nearest cluster (B in this case) is denoted by b. The intra-cluster distance is simply defined as the sum of the distances of the point marked X from all the points in a given cluster.
The Silhouette Coefficient, S, can be rewritten as follows:

The value of the Silhouette Coefficient ranges from -1 to 1. A value close to -1 means that a is (very) large than b implying that the point is more similar to the neighboring cluster (B) than the current cluster (A) and is wrongly placed in the current cluster. A value close to 1 means that a is (very) smaller than b and hence a point is placed in the correct cluster.
Overall the silhouette coefficient of the entire dataset is a mean of the silhouette coefficients of each sample. The value of the Silhouette Coefficient is affected by the number of clusters. The Silhouette Coefficients can be used to decide the optimum number of clusters as follows:
- Start with two clusters. Calculate the mean silhouette coefficient for each cluster.
- Calculate the mean silhouette coefficients of the entire dataset (average over all the clusters).
- Check whether the mean silhouette coefficient of any of the clusters is less than the overall mean silhouette coefficient of the dataset. If this is the case, the number of clusters is suboptimal or a bad pick. If it is not the case, then it is a potential candidate for being the optimum number of clusters.
- Repeat the steps 1 to 3 for different numbers of clusters (untill n=6 to 10 or a suitable number derived from the context or elbow method).
- Decide on one of the potential candidates identified in the steps 3 and 4 to be the optimum number of clusters.
The elbow method and silhouette coefficients can be used to fine-tune the clustering once it has been run assuming some arbitrary number of clusters. The actual clustering can then be performed once the optimum number of clusters is known. The results from these methods coupled with the business context should give an idea about the number of clusters to be used.