
Checking for missing values and handling them properly is an important step in the data preparation process, if they are left untreated they can:
- Lead to the behavior between the variables not being analyzed correctly
- Lead to incorrect interpretation and inference from the data
To see how; move up a few pages to see how the describe method is explained. Look at the output table; why are the counts for many of the variables different from each other? There are 1310 rows in the dataset, as we saw earlier in the section. Why is it then that the count is 1046 for age, 1309 for pclass, and 121 for body. This is because the dataset doesn't have a value for 264 (1310-1046) entries in the age column, 1 (1310-1309) entry in the pclass column, and 1189 (1310-121) entries in the body column. In other words, these many entries have missing values in their respective columns. If a column has a count value less than the number of rows in the dataset, it is most certainly because the column contains missing values.
There are a multitude of in-built methods to check for missing values. Let's go through some of them. Suppose you wish to find the entries that have missing values in a column of a data frame. It can be done as follows for the body column of the data data frame:
pd.isnull(data['body'])
This will give a series indicating True in the cells with missing values and False for non-missing values. Just the opposite can be done as follows:
pd.notnull(data['body'])
The result will look something similar to the following screenshot:
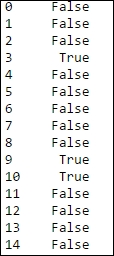
Fig. 2.10: The notnull method gives False for missing values and True for non-missing values
The number of entries with missing values can be counted for a particular column to verify whether our calculation earlier about the number of missing entries was correct or not. This can be done as follows:
pd.isnull(data['body']).values.ravel().sum()
The result we get is 1189. This is the same number of missing entries from the body column as we have calculated in the preceding paragraph. In the preceding one-liner, the values (True/False; 1/0 in binary) have been stripped off the series and have been converted into a row (using the ravel method) to be able to sum them up. The sum of 1/0 values (1 for missing values and 0 for non-missing) gives the number of total missing values.
The opposite of isnull is notnull. This should give us 121 as the result:
pd.nottnull(data['body']).values.ravel().sum()
Before we dig deeper into how to handle missing data, let's see what constitutes the missing data and how missing values are generated and propagated.
Nan is the default keyword for a missing value in Python. None is also considered as a missing value by the isnull and notnull functions.
There are various ways in which a missing values are incorporated in the datatset:
- Data extraction: While extracting data from a database, the missing values can be incorporated in the dataset due to various incompatibilities between the database server and the extraction process. In this case, the value is actually not missing but is being shown as missing because of the various incompatibilities. This can be corrected by optimizing the extraction process.
- Data collection: It might be the case that at the time of collection, certain data points are not available or not applicable and hence can't be entered into the database. Such entries become missing values and can't be obtained by changing the data extraction process because they are actually missing. For example, in case of a survey in a village, many people might not want to share their annual income; this becomes a missing value. Some datasets might have missing values because of the way they are collected. A time series data will have data starting from the relevant time and before that time it will have missing values.
Any numerical operator on a missing value propagates the missing value to the resultant variable. For example, while summing the entries in two columns, if one of them has a missing value in one of the entries, the resultant sum variable will also have a missing value.
There are basically two approaches to handle missing values: deletion and imputation. Deletion means deleting the entire row with one or more missing entries. Imputation means replacing the missing entries with some values based on the context of the data.
One can either delete a complete row or column. One can specify when to delete an entire row or column (when any of the entries are missing in a row or all of the entries are missing in a row). For our dataset, we can write something, as shown:
data.dropna(axis=0,how='all')
The statement when executed will drop all the rows (axis=0 means rows, axis=1 means columns) in which all the columns have missing values (the how parameter is set to all). One can drop a row even if a single column has a missing value. One needs to specify the how method as 'any' to do that:
data.dropna(axis=0,how='any')
Imputation is the method of adding/replacing missing values with some other values such as 0, a string, or mean of non-missing values of that variable. There are several ways to impute a missing value and the choice of the best method depends on the context of the data.
One method is to fill the missing values in the entire dataset with some number or character variable. Thus, it can be done as follows:
data.fillna(0)
This will replace the missing values anywhere in the dataset with the value 0. One can impute a character variable as well:
data.fillna('missing')The preceding statement will impute a missing string in place of NaN, None, blanks, and so on. Another way is to replace the missing values in a particular column only is as shown below.
If you select the body column of the data by typing data['body'], the result will be something similar to the following screenshot:

Fig. 2.11: The values in the body column of the Titanic dataset without imputation for missing values
One can impute zeros to the missing values using the following statement:
data['body'].fillna(0)
But after imputing 0 to the missing values, we get something similar to the following screenshot:

Fig. 2.12: The values in the body column of the Titanic dataset after imputing 0 for missing values
A common imputation is with the mean or median value of that column. This basically means that the missing values are assumed to have the same values as the mean value of that column (excluding missing values, of course), which makes perfect sense. Let us see how we can do that using the fillna method. Let us have a look at the age column of the dataset:
data['age']

Fig. 2.13: The values in the age column of the Titanic dataset without imputation for missing values
As shown in the preceding screenshot, some of the entries in the age column have missing values. Let us see how we can impute them with mean values:
data['age'].fillna(data['age'].mean())
The output looks something similar to the following screenshot:

Fig. 2.14: The values in the age column of the Titanic dataset after imputing mean for missing values
As you can see, all the NaN values have been replaced with 29.881135, which is the mean of the age column.
One can use any function in place of mean, the most commonly used functions are median or some defined calculation using lambda. Apart from that, there are two very important methods in fillna to impute the missing values: ffill and backfill. As the name suggests, ffill replaces the missing values with the nearest preceding non-missing value while the backfill replaces the missing value with the nearest succeeding non-missing value. It will be clearer with the following example:
data['age'].fillna(method='ffill')

Fig. 2.15: The result of using ffill method of imputation on the age column of the Titanic dataset
As it can be seen, the missing value in row number 1297 is replaced with the value in row number 1296.
With the backfill statement, something similar happens:
data['age'].fillna(method='backfill')

Fig. 2.16: The result of using backfill method of imputation
As it can be seen, the missing value in row number 1297 is replaced with the value in row number 1298.