
Chapter 3
Understanding Memory
WHAT’S IN THIS CHAPTER?
- Understanding physical memory and how to use virtual memory addressing
- NUMA architecture and how SQL Server uses it
- SQL Server’s memory clerks, caches, and pools
- Looking at SQL Server’s plan cache
- An in-depth look at Query/Workspace memory
- Memory configuration options including Max Server Memory, Lock Pages in Memory, and Optimize for Ad-hoc Workloads
WROX.COM CODE DOWNLOADS FOR THIS CHAPTER
The wrox.com code downloads for this chapter are found at www.wrox.com/remtitle.cgi?isbn=1118177657 on the Download Code tab. The code is in the Chapter 3 download and individually named according to the names throughout the chapter.
INTRODUCTION
Memory, disk, and CPU are the holy trinity of resources in a computer system, and memory is first because it’s the area you’re most likely to have an issue with. Memory issues can cause both disk and CPU saturation, so when troubleshooting a server issue (or at least a performance issue), you need to start by looking at the memory profile of the system.
Understanding how Windows and SQL Server interact with and manage memory is crucial for gaining an understanding of the actual memory usage of a server you’re troubleshooting.
The first part of this chapter explains the fundamentals of how Windows manages memory and explains the difference and relationship between physical and virtual memory. The second part focuses on SQL Server’s internal memory structures, how they are managed, and how you can break down their usage for effective troubleshooting. The chapter concludes with a look at different memory configuration options for SQL Server, helping you to understand what they do and how to decide on an appropriate configuration.
PHYSICAL AND VIRTUAL MEMORY
This section covers topics — often considered to be outside the scope of a database professional — that are fundamental to the way that Windows manages memory and the applications running on it, including SQL Server. Understanding this information is a great differentiator among database professionals and it will give you the right foundation of knowledge to understand how all applications work with Windows.
Physical Memory
When the term physical memory is used, it’s usually in relation to RAM (random access memory), but it actually also includes the system page file (explained later in the chapter). RAM is also referred to as primary storage, main memory, or system memory because it’s directly addressable by the CPU. It is regarded as the fastest type of storage you can use, but it’s volatile, meaning you lose what was stored when you reboot the computer. It’s also expensive and limited in capacity compared to nonvolatile storage such as a hard disk.
For example, Windows Server 2012 supports up to 4TB of RAM, but buying a server with that much memory will cost you millions of U.S. dollars, whereas it’s possible to buy a single 4TB hard disk for a few hundred dollars. Combine a few of those and you can have tens of TBs of very cost-effective storage space. Consequently, servers use a combination of hard disks to store data, which is then loaded into RAM where it can be worked with much faster.
By way of comparison, throughput for RAM modules is measured in gigabytes per second (GB/s) with nanosecond (ns) response times, whereas hard disk throughput is measured in megabytes per second (MB/s) with millisecond (ms) response times. Even solid-state storage technology, which is much faster than traditional disk, is typically still measured in MB/s throughput and with microsecond (μs) latency. You can read more about storage in Chapter 4.
Maximum Supported Physical Memory
For ease of reference, Table 3-1 shows the maximum usable RAM for SQL Server 2012 by feature and edition.
TABLE 3-1: SQL Server 2012 Usable Memory by Edition and Feature
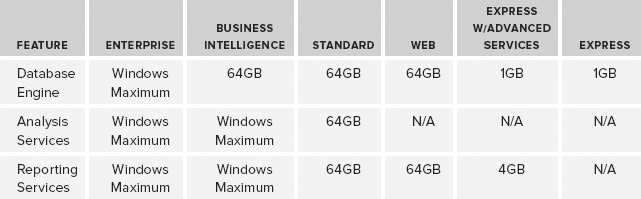
SQL Server 2012 Enterprise Edition and SQL Server 2012 Business Edition support the maximum RAM of the underlying operating system, the most popular of which at the time of writing are Windows Server 2008 R2 Standard Edition, which supports 32GB, and Windows Server 2008 R2 Enterprise Edition, which supports 2TB.
Windows Server 2012, due for release at the end of 2012, supports a maximum of 4TB of RAM.
Virtual Memory
If all the processes running on a computer could only use addresses in physical RAM, the system would very quickly experience a bottleneck. All the processes would have to share the same range of addresses, which are limited by the amount of RAM installed in the computer. Because physical RAM is very fast to access and cannot be increased indefinitely (as just discussed in the previous section), it’s a resource that needs to be used efficiently.
Windows (and many other mainstream, modern operating systems) assigns a virtual address space (VAS) to each process. This provides a layer of abstraction between an application and physical memory so that the operating system can choose the most efficient way to use physical memory across all the processes. For example, two different processes can both use the memory address 0xFFF because it’s a virtual address and each process has its own VAS with the same address range.
Whether that address maps to physical memory or not is determined by the operating system or, more specifically (for Windows at least), the Virtual Memory Manager, which is covered in the next section.
The size of the virtual address space is determined largely by the CPU architecture. A 64-bit CPU running 64-bit software (also known as the x64 platform) is so named because it is based on an architecture that can manipulate values that are up to 64 bits in length. This means that a 64-bit memory pointer could potentially store a value between 0 and 18,446,744,073,709,551,616 to reference a memory address.
This number is so large that in memory/storage terminology it equates to 16 exabytes (EBs). You don’t come across that term very often, so to grasp the scale, here is what 16 exabytes equals when converted to more commonly used measurements:
- 16,384 petabytes (PB)
- 16,777,216 terabytes (TB)
- 17,179,869,184 gigabytes (GB)
17 billion GB of RAM, anyone?
As you can see, the theoretical memory limits of a 64-bit architecture go way beyond anything that could be used today or even in the near future, so processor manufacturers implemented a 44-bit address bus instead. This provides a virtual address space on 64-bit systems of 16TB.
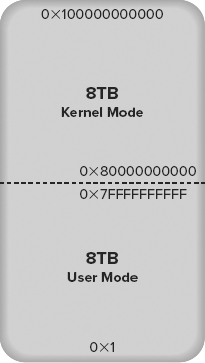
This was regarded as being more than enough address space for the foreseeable future and logically it is split into two ranges of 8TB: one for the process and one reserved for system use. These two ranges are commonly referred to as user mode and kernel mode address space and are illustrated in Figure 3-1. Each application process (i.e., SQL Server) can access up to 8TB of VAS, and therefore up to 8TB of RAM (depending on operating system support — remember Windows Server 2012 supports 4TB of RAM, so we’re halfway there).
Virtual Memory Manager
The Virtual Memory Manager (VMM) is the part of Windows that links together physical memory and virtual address space. When a process needs to read from or write something into memory, it references an address in its VAS; and the VMM will map it to an address in RAM. It isn’t guaranteed, however, to still be mapped to an address in RAM the next time you access it because the VMM may determine that it needs to move your data to the page file temporarily to allow another process to use the physical memory address. As part of this process, the VMM updates the VAS address and makes it invalid (it doesn’t point to an address in RAM anymore). The next time you access this address, it has to be loaded from the page file on disk, so the request is slower — this is known as a page fault and it happens automatically without you knowing.
The portion of a process’s VAS that currently maps to physical RAM is known as the working set. If a process requests data that isn’t currently in the working set, then it needs to be reloaded back into memory before use. This is called a hard page fault (a soft page fault is when the page is still on the standby list in physical memory); and to fix it, the VMM retrieves the data from the page file, finds a free page of memory, either from its list of free pages or from another process, writes the data from the page file into memory, and then maps the new page back into the process’s virtual address space.
On a system with enough RAM to give every process all the memory it needs, the VMM doesn’t have to do much other than hand out memory and clean up after a process is done with it. On a system without enough RAM to go around, the job is a little more involved. The VMM has to do some work to provide each process with the memory it needs when it needs it. It does this by using the page file to temporarily store data that a process hasn’t accessed for a while. This process is called paging, and the data is often described as having been paged out to disk.
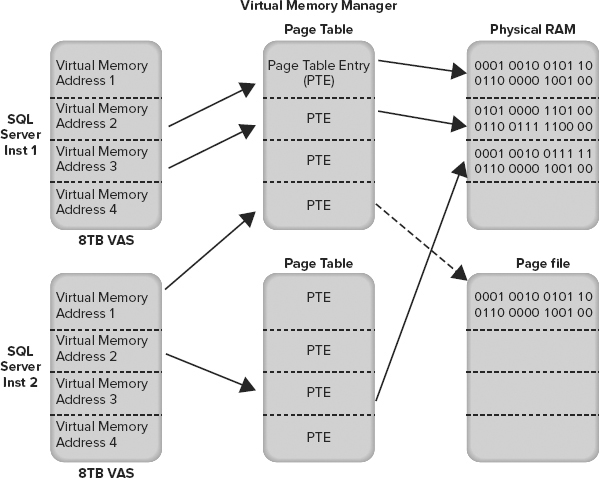
The Virtual Memory Manager keeps track of each mapping for VAS addresses using page tables, and the mapping information itself is stored in a page table entry (PTE). This is illustrated in Figure 3-2 using two SQL Server instances as an example. Note that the dashed arrow indicates an invalid reference that will generate a hard page fault when accessed, causing the page to be loaded from the page file.
Sizing the Page File
Determining the optimal size of a page file has been a long-running debate for years. By default, Windows will manage the size of your page file recommending a page file size of 1.5 times the size of RAM.
It won’t hurt performance to leave the default in place but the debates start to ensue when there are large amounts of RAM in a server and not enough disk space on the system drive for a full-size page file.
The primary purpose of a page file is to allow Windows to temporarily move data from RAM to disk to help it manage resources effectively. When a page file is heavily used, it indicates memory pressure; and the solution is to optimize your memory resources or buy more RAM, rather than to optimize your page file.
If you have disk space concerns on your page file drive, then setting the page file to 50% of total available RAM would be a safe bet.
At one client, where I was delivering a SQL Server Health Check, one of their servers had 96GB of RAM and a 96GB page file. Page file usage was minimal during the day, but every night a SQL Server Analysis Services cube was being rebuilt, which required so much memory that 20GB of the page file was being used during the build. This amount of page file usage is extreme but even a page file sized at 50% would have been more than enough. They upgraded the RAM to 128GB the next week.
Another argument for full-size page files is that they are required to take full memory dumps. While that is correct, it is extremely unlikely that Microsoft support will ever investigate a full memory dump because of the sheer size of it, and certainly never on the first occurrence of an issue. This then gives you time to increase the size of your page file temporarily at Microsoft’s request to gather a full dump should the need ever actually arise.
NUMA
Non-Uniform Memory Architecture (NUMA) is a hardware design that improves server scalability by removing motherboard bottlenecks. In a traditional architecture, every processor has access to every memory bank across a shared system bus to a central memory controller on the motherboard. This is called symmetric multiprocessing (SMP) and it has limited scalability because the shared system bus quickly becomes a bottleneck when you start to increase the number of processors.
In a NUMA system, each processor has its own memory controller and a direct connection to a dedicated bank of RAM, which is referred to as local memory, and together they’re represented as a NUMA node.
A NUMA node can access memory belonging to another NUMA node but this incurs additional overhead and therefore latency — this is known as remote memory.
Coreinfo, a free tool from Sysinternals that can be found on the TechNet website, displays a lot of interesting information about your processor topology, including a mapping of the access cost for remote memory, by processor. Figure 3-3 shows a screenshot from a NUMA system with two nodes, indicating the approximate cost of accessing remote memory as 1.3 times that of local — although latency in the tests can produce outlying results as you can see in the figure. 00 to 00 is actually local and should report a cost of 1.0.

SQL Server’s Use of NUMA
SQL Server creates its own internal nodes on startup that map directly on to NUMA nodes, so you can query SQL Server directly and get a representation of the physical design of your motherboard in terms of the number processors, NUMA nodes, and memory distribution.
For example, Figure 3-4 shows a representation of a server with two processors, each with four cores and a bank of local memory that makes up a NUMA node. When SQL Server starts, the SQLOS identifies the number of logical processors and creates a scheduler for each one in an internal node (SQLOS and Schedulers are covered in Chapter 1 and Chapter 5).
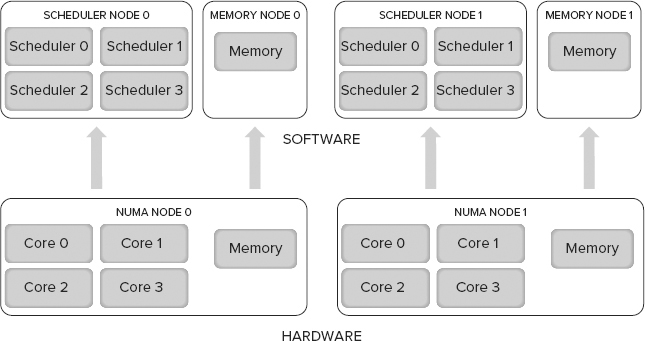
The memory node is separate from the scheduler node, not grouped together as it is at the hardware level. This provides a greater degree of flexibility and independence; it was a design decision to overcome memory management limitations in earlier versions of Windows.
SQL Server NUMA CPU Configuration
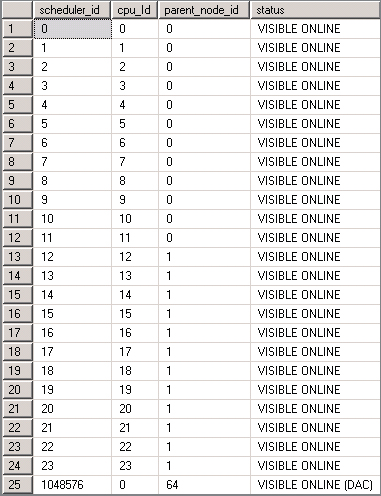
You can view information about the NUMA configuration in SQL Server using several DMVs. Figure 3-5 shows results from sys.dm_os_schedulers on a server with 24 logical processors and two NUMA nodes. The parent_node_id column shows the distribution of schedulers and CPU references across the two NUMA nodes. You can also see a separate scheduler for the dedicated administrator connection (DAC), which isn’t NUMA aware.
The sys.dm_os_nodes DMV also returns information about CPU distribution, containing a node_id column and a cpu_affinity_mask column, which when converted from decimal to binary provides a visual representation of CPU distribution across nodes. A system with 24 logical processors and two NUMA nodes would look like the following:
node_id      dec-to-bin CPU mask
0            000000000000111111111111
1            111111111111000000000000
When SQL Server starts, it also writes this information to the Error Log, which you can see for the same server in Figure 3-6.
SQL Server NUMA Memory Configuration
As you learned earlier in the chapter, SQL Server memory nodes map directly onto NUMA nodes at the hardware level, so you can’t do anything to change the distribution of memory across nodes.
SQL Server is aware of the NUMA configuration of the server on which it’s running, and its objective is to reduce the need for remote memory access. As a result, the memory objects created when a task is running are created within the same NUMA node as the task whenever it’s efficient to do so. For example, if you execute a simple query and it’s assigned a thread on scheduler 0 in node 0, then SQL Server will try to use the memory in node 0 for all new memory requirements to keep it local.
How much memory SQL Server tries to use in each hardware NUMA node is determined by the target server’s memory, which is affected by the max server memory option (see the section “Min and Max Server Memory” later in the chapter).
Whether you configure Max Server Memory or not, SQL Server will set a target server memory, which represents the target for SQL Server memory usage. This target is then divided by the number of NUMA nodes detected to set a target for each node.
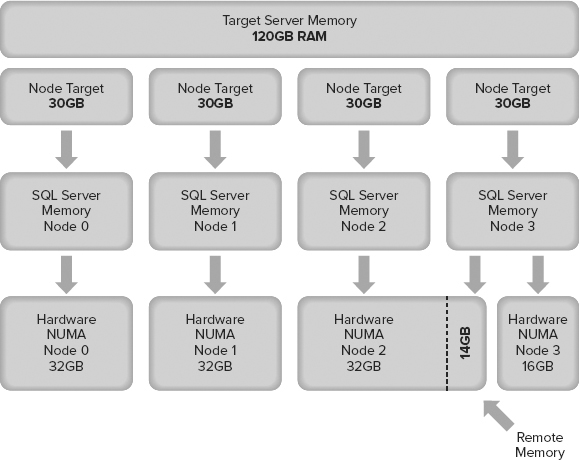
If your server doesn’t have an even distribution of RAM across the hardware NUMA nodes on your motherboard, you could find yourself in a situation in which you need to use remote memory just to meet SQL Server’s target memory. Figure 3-7 illustrates this; the target server memory of node 3 cannot be fulfilled with local memory because the RAM has not been evenly distributed across NUMA nodes on the motherboard.
SQL SERVER MEMORY
The first part of this chapter dealt mainly with the memory environment external to SQL Server — that is, understanding and configuring memory before SQL Server starts. This second part looks at how SQL Server manages memory.
Memory management in SQL Server has a three-level structure. At the bottom are memory nodes, which are the lowest-level allocators for SQL Server memory. The second level consists of memory clerks, which are used to access the memory nodes, and cache stores, which are used for caching. The top level contains memory objects, which provide a smaller degree of granularity than the memory clerks allow directly.
Only clerks can access memory nodes to allocate memory, so every component that needs to allocate substantial amounts of memory needs to create its own memory clerk when the SQL Server service starts.
Memory Nodes
Memory nodes map directly onto NUMA nodes as described earlier in the chapter, and you can view details about these nodes on your server using the sys.dm_os_memory_nodes DMV. You will always have at least one memory node, which has a memory_node_id of 0, and you may have several if your CPU architecture supports NUMA.
Each memory node has its own memory clerks and caches, which are distributed evenly across all the nodes (although some objects will only be found in node 0). SQL Server’s total usage is calculated using the sum of all the nodes.
Clerks, Caches, and the Buffer Pool
Memory clerks are the mechanism by which memory caches are used, and the buffer pool is by far the largest consumer of memory in SQL Server. All three are discussed in this section.
Memory Clerks
Whenever a memory consumer within SQL Server wants to allocate memory, it needs to go through a memory clerk, rather than going straight to a memory node. There are generic memory clerks like MEMORYCLERK_SQLGENERAL, but any component that needs to allocate significant amounts will have been written to create and use its own memory clerk.
The buffer pool for instance has its own memory clerk (MEMORYCLERK_SQLBUFFERPOOL), as do query plans (MEMORYCLERK_SQLQUERYPLAN), which makes troubleshooting much easier because you can view the memory allocations made by each clerk and see who has what.
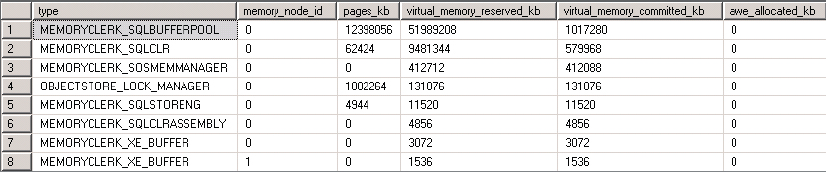
You can view details about all the memory clerks using the sys.dm_os_memory_clerks DMV. For example, running the following query against a SQL Server 2012 Enterprise Edition instance running a production workload produced the results shown in Figure 3-8:
SELECT   [type],
         memory_node_id,
         pages_kb,
         virtual_memory_reserved_kb,
         virtual_memory_committed_kb,
         awe_allocated_kb
FROM     sys.dm_os_memory_clerks
ORDER BY virtual_memory_reserved_kb DESC;
The query orders the results by virtual_memory_reserved_kb, so what you see in the figure are the top eight memory clerks ordered by the amount of VAS that they have reserved.
Caches
SQL Server uses three types of caching mechanism: object store, cache store, and user store.
Object stores are used to cache homogeneous types of stateless data, but it’s the cache and user stores that you’ll come across most often. They are very similar in that they’re both caches — the main difference between them is that user stores must be created with their own storage semantics using the development framework, whereas a cache store implements support for the memory objects mentioned previously to provide a smaller granularity of memory allocation.
Essentially, the user stores are mainly used by different development teams within Microsoft to implement their own specific caches for SQL Server features, so you can treat cache stores and user stores the same way.
To view the different caches implemented on your SQL Server, use the sys.dm_os_memory_cache_counters DMV. For example, running the following query will show you all the caches available, ordered by the total amount of space they consume:
SELECT   [name],
         [type],
         pages_kb,
         entries_count
FROM     sys.dm_os_memory_cache_counters
ORDER BY pages_kb DESC;
Sample output showing the top three caches by size is shown in Figure 3-9.

Here, the caches you see are all related to query processing (discussed further in Chapter 5). These specific caches are used for the following:
- CACHESTORE_OBJCP — Compiled plans for objects such as stored procedures, functions, and triggers
- CACHESTORE_SQLCP — Cached plans for SQL statements or batches that aren’t in stored procedures. If your application doesn’t use stored procedures, then the plans are cached here. However, they are much less likely to be reused than stored procedure plans, which can lead to a bloated cache taking a lot of memory (see the “Optimize for Ad-Hoc Workloads” section later in the chapter).
- CACHESTORE_PHDR — Algebrizer trees for views, constraints, and defaults. An algebrizer tree is the parsed SQL text that resolves table and column names.
Buffer Pool
The buffer pool contains and manages SQL Server’s data cache. Information on its contents can be found in the sys.dm_os_buffer_descriptors DMV. For example, the following query returns the amount of data cache usage per database, in MB:
SELECT   count(*)*8/1024 AS 'Cached Size (MB)'
        ,CASE database_id
         WHEN 32767 THEN 'ResourceDb'
         ELSE db_name(database_id)
         END AS 'Database'
FROM     sys.dm_os_buffer_descriptors
GROUP BY db_name(database_id),database_id
ORDER BY 'Cached Size (MB)' DESC
Monitoring SQL Server’s buffer pool is a great way to look out for memory pressure, and Performance Monitor provides numerous counters to help you do this for quick insight, including the following:
- MSSQL$<instance >:Memory ManagerTotal Server Memory (KB) — Indicates the current size of the buffer pool
- MSSQL$<instance >:Memory ManagerTarget Server Memory (KB) — Indicates the ideal size for the buffer pool. Total and Target should be almost the same on a server with no memory pressure that has been running for a while. If Total is significantly less than Target, then either the workload hasn’t been sufficient for SQL Server to grow any further or SQL Server cannot grow the buffer pool due to memory pressure, in which case you can investigate further.
- MSSQL$<instance >:Buffer ManagerPage Life Expectancy — Indicates the amount of time, in seconds, that SQL Server expects a page that has been loaded into the buffer pool to remain in cache. Under memory pressure, data pages are flushed from cache far more frequently. Microsoft recommends a minimum of 300 seconds for a good PLE; this threshold continues to be debated within the SQL Server community, but one thing everyone agrees on is that less than 300 seconds is bad. In systems with plenty of physical memory, this will easily reach thousands of seconds.
Plan Cache
Execution plans can be time consuming and resource intensive to create; therefore, it makes sense that if SQL Server has already found a good way to execute a piece of code, it should try to reuse it for subsequent requests. The plan cache (also referred to as the procedure cache) is used to cache all the execution plans in case they can be reused.
You can view the contents of the plan cache and determine its current size by using the sys.dm_exec_cached_plans DMV or by running DBCC MEMORYSTATUS and looking for the “Procedure Cache” section, where you’ll find the number of plans in cache and the cache size, in 8KB pages.
- sys.dm_os_memory_nodes
- sys.dm_os_memory_clerks
- sys.dm_os_memory_objects
- sys.dm_os_memory_cache_counters
- sys.dm_os_memory_pools
The following example script uses sys.dm_exec_cached_plans to show the number of cached plans and the total size in MB:
SELECT count(*) AS 'Number of Plans',
sum(cast(size_in_bytes AS BIGINT))/1024/1024 AS 'Plan Cache Size (MB)'
FROM sys.dm_exec_cached_plans
Running this on a production SQL Server 2012 instance with Max Server Memory set to 32GB produced the following results:
Number of Plans   Plan Cache Size (MB)
14402 2859The maximum size for the plan cache is calculated by SQL Server as follows:
- 75% of server memory from 0–4GB +
- 10% of server memory from 4GB–64GB +
- 5% of server memory > 64GB
Therefore, a system with 32GB of RAM would have a maximum plan cache of 3GB + 2.8GB = 5.8GB.
Query/Workspace Memory
In SQL Server, query memory (also known as workspace memory) is used to temporarily store results during hash and sort operations when executing a query. It’s not very widely known or documented, but if you look at an execution plan (also known as an query plan) for a query and you see hash and/or sort operators, that query needs to use query memory to complete execution.
Query memory is allocated out of the buffer pool, so it’s definitely something to be aware of when you’re building a picture of the memory usage on a server.
You can find out how much query memory an individual query uses by looking at the properties of an actual execution plan in Management Studio, as opposed to an estimated execution plan. The estimated plan contains information about how SQL Server will run the query, and it shows any hash or sort operators; but the actual plan reflects what SQL Server used to execute the query, and it contains additional runtime data, including how much query memory was used.
You can view the details of any queries that already have an allocation of query memory (memory grant) and those that are waiting for a memory grant using the sys.dm_exec_query_memory_grants DMV.
Query memory also has its own memory clerk, which means you can view the sizing information for outstanding memory grants by querying the sys.dm_exec_query_memory_grants DMV where type = ’MEMORYCLERK_SQLQERESERVATIONS’.
The memory requirements for all hash and sort operators in a plan are added together to get the total query memory requirement.
The amount of space available as query memory is dynamically managed between 25% and 75% of the buffer pool but it can grow larger than that if the buffer pool is not under pressure.
Five percent of query memory is reserved for small queries that require less than 5MB of memory and have a “cost” of less than 3. SQL Server assigns a cost to queries based on how many resources will be needed to run the query. You can read more about how SQL Server assigns and uses “cost” in Chapter 5.
No individual query will get a grant for more than 20% of the total query memory, to ensure that other queries can still be executed. In addition to this safeguard, SQL Server also implements a query memory grant queue. Every query that contains a hash or sort operation has to pass through the global query memory grant queue before executing, which is organized as five queues organized by query cost query cost.
Each query is put into the appropriate queue based on cost, and each queue implements a first-come first-served policy. This method enables smaller queries with lower memory requirements to be processed even if larger queries are waiting for enough free memory.
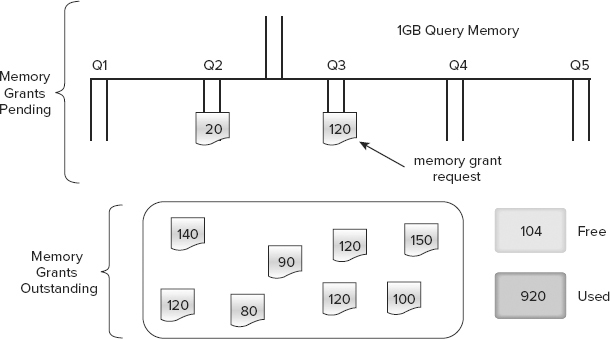
Figure 3-10 shows a representation of the five queues based on query cost that make up the global memory grant queue on a server with 1GB of query memory. The box at the bottom of the picture contains eight existing memory grants totaling 920MB, leaving 104MB free. The first request to arrive was for 120MB and went into Q3. This request can’t be allocated immediately because only 104MB are free. The next request is only for 20MB and goes into Q2. This request can be fulfilled immediately because having multiple queues means that it isn’t stuck behind the first request that is still waiting.
The Query Wait Option
Queries can time out if they spend too much time waiting for a memory grant. The time-out duration is controlled by the Query Wait option, which can be modified either using sp_configure or on the Advanced page of Server Properties in Management Studio. The default value is −1, which equates to 25 times the cost of the query, in seconds. Any positive value for Query Wait will be used as the time-out value in seconds.
It is possible for a transaction that contains a query waiting for a memory grant to hold locks open and cause a blocking problem before it times out. In this situation, a lower Query Wait value would reduce the impact on other tasks by causing the query to time out sooner.
However, first try to reduce the memory requirement for the query or increase the available memory to avoid the timeout before changing a global option like Query Wait because doing so affects all queries running on the server. The default setting allows for a dynamic time-out value that varies according to the query cost, so it’s generally the best option.
Query Memory Diagnostics
There are a number of different ways to get information on query memory usage on your SQL Server in addition to the DMVs already discussed at the beginning of the section. Performance Monitor provides the following counters, all of which are found within the instance’s Memory Manager:
- Granted Workspace Memory (KB) — Total amount of query memory currently in use
- Maximum Workspace Memory (KB) — Total amount of memory that SQL Server has marked for query memory
- Memory Grants Pending — Number of memory grants waiting in the queue
- Memory Grants Outstanding — Number of memory grants currently in use
The RESOURCE_SEMAPHORE wait type is a wait on a memory grant, so if you see this near the top in your results from the sys.dm_os_wait_stats DMV, then your system is struggling to provide memory grants fast enough.
You can also encounter performance issues other than just a query timing out while it waits for a memory grant. Within an execution plan or when analyzing a SQL trace, you may notice hash warning or sort warning messages if you have selected the relevant events. These occur when the memory grant was insufficient for a query’s requirements.
A hash warning occurs when the hash build doesn’t fit in memory and must be spilled to disk (its actually written to tempdb). A sort warning occurs when a multi-pass sort is required because the granted memory was insufficient. Both warnings generally occur because the SQL Server Query Optimizer made the wrong choice, usually because of inaccurate statistics or a lack of useful statistics. For more details about this, see Chapter 5.
OPTIMIZING SQL SERVER MEMORY CONFIGURATION
This section discusses some of the most common memory configuration options for SQL Server.
Min and Max Server Memory
Min Server Memory (MB) and Max Server Memory (MB) control the allowable size of all SQL Server’s memory usage. With the introduction of a new Memory Manager described earlier in the chapter, this is a change for SQL Server 2012. This makes sizing SQL Server’s memory requirements much easier than with previous versions.
As its name suggests, Min Server Memory controls the minimum amount of physical memory that SQL Server will try to keep committed. We say “try” because it can fall under that value if Windows is desperate enough, but to all intents and purposes it sets a floor for SQL Server’s memory usage.
When the SQL Server service starts, it does not acquire all the memory configured in Min Server Memory but instead starts with only the minimum required, growing as necessary. Once memory usage has increased beyond the Min Server Memory setting, SQL Server won’t release any memory below that amount.
Not surprisingly, Max Server Memory is the opposite of Min Server Memory, setting a ceiling for memory usage. Both values can be set using sp_configure or through Management Studio on the Memory page of the SQL Server Properties window.
Configuring a maximum value for the buffer pool is the more important of the two settings and will prevent SQL Server from taking too much memory. This is particularly significant on 64-bit systems, where a lack of free physical memory can cause Windows to trim SQL Server’s working set. See the section “Lock Pages in Memory” for a full description of this issue.
There are several different ways to calculate an appropriate value for configuring Max Server Memory, but two of the most straightforward are as follows:
- Look at SQL Server’s maximum usage.
- Determine the maximum potential for memory requirements outside SQL Server.
Each of these options is covered in the following sections.
Looking at the SQL Server’s Maximum Usage
With this method, you set SQL Server to dynamically manage memory and then monitor the MSSQL$<instance>:Memory ManagerTotal Server Memory (KB) counter using Performance Monitor. This counter measures SQL Server’s total buffer pool usage.
The Total Server Memory value will decrease if other requirements outside SQL Server need more physical memory than is currently free, and then increase again to use any free memory. If you monitor this counter for a period of time that is representative for your business (i.e., it includes busy and slack periods), you can then set Max Server Memory to the lowest value that was observed for Total Server Memory (KB), and you won’t have to worry about SQL Server having to shrink its usage during normal operations.
Determining the Maximum Potential for Requirements Outside SQL Server
This option is the most popular, as the aim is to calculate the worst-case scenario for memory requirements other than SQL Server’s. You should allow for the following:
- 2GB for Windows
- xGB for SQL Server worker threads. You can find your max workers count by querying sys.dm_os_sys_info. Each thread will use 0.5MB on x86, and 2MB on x64.
- 512MB, if you use linked servers, extended stored procedure dlls, or objects created using Automation procedures (sp_OA calls)
- 1–3GB, for other applications that might be running on the system, such as backup programs or anti-virus software
For example, on a server with eight CPU cores and 64GB of RAM running SQL Server 2012, a third-party backup utility, and virus checker, you would allow for the following:
- 2GB for Windows
- 1GB for worker threads (576 × 2MB rounded down)
- 512MB for linked servers, etc.
- 1GB for the backup program and virus checker
For a total of 4.5GB, you would configure Max Server Memory to 59.5GB.
Both of these options can be valid in different circumstances. On a single SQL Server from which you need to squeeze every drop of performance, you might use option 1 and monitor Total Server Memory to see how often SQL Server has to give memory back to Windows. However, if you had dozens of SQL Servers to manage or a mission-critical server, you might go with option 2, as it would be easier to calculate across multiple servers and is less likely to cause a failure under exceptional circumstances.
Checking That Your Max Server Memory Is Effective
How you decide to configure Max Server Memory when you build a server (there are many opinions on the matter) isn’t as important as measuring its effectiveness and adjusting it when the server has run its expected workload. An easy way to do this is using performance monitor counters, specifically, MSSQL$<instance>:Buffer ManagerPage Life Expectancy (PLE) (also see the section “Clerks, Caches, and the Buffer Pool”) and MemoryAvailable MBytes. The balance between these two counters shows you how effective your Max Server Memory setting is.
- PLE: Shows you how many seconds SQL Server expects to keep a page in the data cache and is a good measure of memory pressure on SQL Server
- Available MBytes: Shows how much physical RAM Windows has that isn’t doing anything
If your PLE is low (<300 is definitely low but you might choose a higher threshold), then check your Available MBytes to see how much unused RAM is available. Windows starts to aggressively trim (see next section) all application working sets when it has less than 5MB available, so anything close to this on a production server should be considered an urgent problem.
The minimum Available MBytes you should have is 100MB but even this is cutting it too close because any application that is run on your SQL Server can easily use that up. Instead, try aiming for 500 or 600MB as a minimum or even 1GB to be sure. That way, if you need to run any support tools on the server, there will be plenty of RAM for them.
So, if your PLE is low and you have plenty of Available MBytes because you were conservative with your Max Server Memory setting, then you have scope to increase your Max Server Memory, thereby increasing your PLE. Conversely, if your Available MBytes is low because you were aggressive with your Max Server Memory setting and your PLE is very high, then you can reduce your Max Server Memory to give some RAM back to Windows.
Here are some example scenarios to illustrate this point:
- Max Server Memory is 30GB on a server with 32GB RAM. PLE averages 10,000 and Available MBytes is 90MB. Solution: Lower Max Server Memory by at least 500MB.
- Max Server Memory is 46GB on a server with 50GB RAM. PLE averages 10 and Available MBytes is 1500MB. Solution: Increase Max Server Memory by 500MB to 1000MB.
- Max Server Memory is 60GB on a server with 64GB RAM. PLE averages 50 and Available MBytes is 20MB. Solution: Lower Max Server Memory by 100MB and buy more RAM (quickly).
Lock Pages in Memory
Lock Pages in Memory (LPIM) is used as a work-around for a problem than can occur between Windows and SQL Server, and it was especially bad on older versions of SQL Server, which could run on Windows Server 2003 and earlier.
If there isn’t enough free physical memory in Windows to service a request for resources from a driver or another application, Windows will trim the working set (which refers to the physical memory usage of a process) of all applications running on the server. This is normal behavior and shouldn’t have much noticeable impact.
Windows Server 2003 didn’t cope very well with badly written drivers and could actually force all applications to empty their working sets. This is known as aggressive working set trimming and had a devastating effect on SQL Server’s memory allocation — and therefore performance. So that you could see when this happened, Microsoft added a message to the SQL Server Error Log. Here is an example:
A significant part of sql server process memory has been paged out.
This may result in a performance degradation. Duration: 0 seconds.
Working set (KB): 1086400, committed (KB): 2160928, memory
utilization: 50%.
This behavior significantly changed in Windows Server 2008 and later thus preventing the biggest problem — badly written drivers causing application working sets to be emptied. This won’t affect SQL Server 2012 because it only runs on Windows Server 2008+.
In SQL Server 2012, you will still get messages logged when Windows performs working set trimming. Several messages can indicate a gradual decline of SQL Server’s working set (which is still a problem).
Resolving this issue (or avoiding it all together) can be approached in two ways:
- Set Max Server Memory appropriately to ensure that Windows and other processes running on the server have enough physical memory to perform their work without asking SQL Server to trim. See the previous section on Min and Max Server Memory for more details.
- If you’re still seeing the issue (or if its effects are so severe you don’t want to risk seeing it again), you can configure your SQL Server to use Locked Pages in Memory (LPIM).
When LPIM is enabled, SQL Server’s buffer pool pages are “locked” and non-pageable so Windows can’t take them when trimming.
Once the pages are locked, they’re not considered part of available memory for working set trimming. However, only SQL Server buffer pool allocations can be locked — Windows can still trim the working sets of other processes, affecting resources on which SQL Server depends.
LPIM should be used if you continue to get working set trimming after setting a suitable max server memory or the cost of SQL Server’s working set being trimmed again is too risky.
Whether or not it should be used as a default best practice on all your SQL Servers is a common debate. One perspective is that it’s a work-around and not intended to replace the default behavior on every SQL Server implementation. Administrators who believe this don’t set it unless they know it’s going to fix a problem. Another perspective is that setting it by default on every implementation is a good preventative measure, which avoids working set trimming ever happening.
Ultimately, it’s down to personal choice; and whether or not you choose to enable it by default is less important than understanding what it does and making an educated decision rather than blindly enabling the feature because someone advised it.
If LPIM is working, you’ll see the following message in the SQL Server Error Log:
Using Locked Pages in the Memory Manager.You can read about Microsoft support for this feature and how to enable it at http://support.microsoft.com/kb/2659143.
Optimize for Ad-Hoc Workloads
Every time an execution plan (see Chapter 5) is generated, it is stored in the plan cache in the hope that it can be reused — this is one of the efficient ways that SQL Server manages its workload.
If an execution plan is never reused, then it’s just taking up resources unnecessarily; and the use of unparameterized ad-hoc T-SQL is the most likely cause.
When you execute code in SQL Server, it generates a hash value of your code and uses that to determine plan reuse. If you execute a stored procedure, a hash value is generated from the stored procedure name, and the plan will be reused on each subsequent procedure call regardless of the parameter values used.
If you run the same code outside of a stored procedure (ad-hoc T-SQL), the hash is taken on the whole statement, including any literal values. When you then change the literal values for another execution, the hash is different, so SQL Server doesn’t find a match and generates a new execution plan instead of reusing the previous one.
This situation can lead to a scenario called plan cache bloat, whereby potentially thousands of ad-hoc plans are generated and cached with a usecount of 1 even though the code is fundamentally the same.
The ideal solution is to use stored procedures or functions, or to parameterize all your ad-hoc T-SQL; but this can be very challenging, and often unachievable due to complexity and company politics, so Microsoft introduced the Optimize for Ad-hoc Workloads server-level option in SQL Server 2008 to help.
When this option is enabled, SQL Server will cache only a plan stub the first time a piece of ad-hoc T-SQL is executed, rather than the full plan. If SQL Server subsequently tries to reuse that plan, it will be generated again but this time cached in full. This avoids the scenario of thousands of single-use plans taking up valuable space in cache.
For example, recall this script used earlier in the chapter:
SELECT count(*) AS 'Number of Plans',
sum(cast(size_in_bytes AS BIGINT))/1024/1024 AS 'Plan Cache Size (MB)'
FROM sys.dm_exec_cached_plans
The preceding code produced the following results on a SQL Server 2012 instance with Max Server Memory set to 32GB:
Number of Plans   Plan Cache Size (MB)

14402             2859
Almost 3GB of memory is being used to cache plans, so it’s significant enough to investigate the usage details. The following script breaks down the plan cache size by cached object type:
SELECT objtype AS 'Cached Object Type',
count(*) AS 'Number of Plans',
sum(cast(size_in_bytes AS BIGINT))/1024/1024 AS 'Plan Cache Size (MB)',
avg(usecounts) AS 'Avg Use Count'
FROM sys.dm_exec_cached_plans
GROUP BY objtype
The results are as follows:
Cached Object Type  Number of Plans  Plan Cache Size (MB) Avg Use Count

UsrTab              10               0                     222
Prepared            286              72                    4814
View                216              20                    62
Adhoc               13206            2223                  39
Check               30               0                     7
Trigger             22               5                     1953
Proc                738              554                   289025
As you can see, most of the plan cache is taken up with ad-hoc plans, with an average use of 39, which is quite low; therefore, you now want to determine how many of those are single-use plans by modifying the earlier cache sizing script:
SELECT count(*) AS 'Number of Plans',
sum(cast(size_in_bytes AS BIGINT))/1024/1024 AS 'Plan Cache Size (MB)'
FROM sys.dm_exec_cached_plans
WHERE usecounts = 1
AND objtype = 'adhoc'
Here are the results:
Number of Plans   Plan Cache Size (MB)

12117             332
This indicates that 332MB of cache is being used for plans that aren’t being reused, which isn’t a huge amount on this server, but it’s completely wasted, so there’s no reason not to get rid of these plans.
The Optimize for Adhoc Workloads option ensures that this scenario will never occur — and because it only affects ad-hoc plans, we recommend switching it on by default in all installations of SQL Server.
SUMMARY
In this chapter, you’ve learned the difference between physical and virtual memory and the limited support SQL Server 2012 has for 32-bit environments.
You’ve also read about NUMA architectures and how SQL Server’s memory model structures itself around NUMA. And you’ve seen the Clerks and Caches that SQL Server uses, including the buffer pool and the plan cache.
You’ve also learned about Workspace Memory, which supports hashing and sort operations; how to determine an effective Max Server Memory setting; and that all of SQL Server’s memory requests are now governed by this setting.
Other configuration settings you read about were Optimize for AdHoc Workloads, which prevents cache bloat from single-use ad-hoc plans; and Lock Pages in Memory, which prevents Windows trimming SQL Server’s working set.