Chapter 2
Demystifying Hardware
WHAT’S IN THIS CHAPTER?
- Understanding SQL Server workload types
- Server model selection and evolution
- Processor selection and SQL Server 2012 licensing considerations
- Understanding processor model numbering
- Choosing hardware to increase redundancy
- Using hardware comparison tools
WROX.COM CODE DOWNLOADS FOR THIS CHAPTER
There are no code downloads for this chapter.
THE IMPORTANCE OF HARDWARE
The underlying foundation of SQL Server 2012 performance and scalability is the actual hardware and storage subsystem on which your instance of SQL Server 2012 is running. This is true whether you are running in a virtualized environment or in a bare metal configuration. Regardless of what type of database workload you may have to deal with, and irrespective of how well designed and optimized your databases are, the characteristics and performance of your database hardware and storage subsystem are extremely important. Even the most well-designed and carefully tuned database application can be crippled by poorly chosen or inadequate hardware. This is not to say that hardware can solve all performance or scalability problems. A frequently executed, expensive query on an extremely large dataset can quickly overwhelm even the best hardware and storage subsystem. Despite this, having modern, properly sized hardware and a good storage subsystem gives you a much better chance of being able to handle any type of workload that you may see on SQL Server 2012, and makes your life as a DBA much easier!
Unfortunately, far too many database administrators (DBAs) are blissfully ignorant about the important details regarding their database hardware infrastructure. Given the pace of recent and ongoing advances in new processors and chipsets, along with changes in both magnetic and flash storage, trying to stay current with hardware technology can be daunting. Many DBAs simply give up, and let someone else make all the hardware and storage decisions. No matter who makes these decisions, however, the DBA is usually blamed for any performance or scalability issues that show up later. Even if you don’t get to make the final decisions regarding hardware selection, being knowledgeable and informed about server hardware puts you in a much stronger position during the decision-making process. Being educated about database hardware also helps you understand whether your existing hardware and storage subsystem is woefully underpowered by today’s standards, which is extremely valuable information for a DBA. This chapter is designed to give you the foundational concepts and knowledge that you need to make informed decisions about your database hardware and storage systems.
HOW WORKLOAD AFFECTS HARDWARE AND STORAGE CONSIDERATIONS
If you are ready to accept the challenge of learning some of the mysteries of database server hardware and storage, where should you begin? The first step is to have a good understanding of your current or planned workload. You need to know whether your database server will be running only the actual SQL Server Database Engine, or also other SQL Server components such as SQL Server Analysis Services (SSAS), SQL Server Integration Services (SSIS), or SQL Server Reporting Services (SSRS). Ideally, you would want these other SQL Server components running on separate dedicated servers, but you might not have that luxury because of the extra hardware and licensing costs. Even if you are only going to be running the Database Engine on your database server, you need to understand what kind of workload you will be handling.
Workload Types
Several different types of workload are common with SQL Server, or any other relational database management server (RDBMS), including online transaction processing (OLTP), data warehousing (DW), relational reporting, and online analytical processing (OLAP). Depending on your applications and what SQL Server components are running on your database server, you might have a relatively pure version of one of these workload types or a mixture of several.
Other variables include the number of user databases running on your database instance, and the volume and intensity of your workload — that is, how many batch requests per second, how many new rows are inserted or updated per second, and so on. All these different variables affect your hardware selection decisions, and how you decide to configure your hardware and storage subsystem to get the best performance possible for that type of workload.
OLTP Workloads
One extreme is a pure OLTP workload, which is typically characterized by numerous short-duration queries and transactions with a relatively high percentage of write activity. Processors with higher base clock speeds and higher turbo speeds (within the same processor family) tend to perform better on most OLTP queries. A pure OLTP workload usually has a high degree of data volatility, especially in some of the database’s key tables. Having a pure OLTP workload will influence your hardware options and how you configure your hardware and storage subsystem. These workloads generate more input/output (I/O) operations per second (IOPS) than an equivalent data warehouse (DW) system.
With a single OLTP database, you will see mostly sequential write activity to your transaction log file, and more random write activity to your data file(s). If you have more than one OLTP database on your instance of SQL Server, and the transaction log files for these databases are located on the same drive array, you will see more random write activity because the drive array is forced to service all the transaction log files for multiple OLTP databases. If you are using technologies such as SQL Server transactional replication, database mirroring, or AlwaysOn availability groups, you will also see sequential read activity against your transaction log file(s).
Data Warehousing Workloads
Another completely different type of workload is a pure DW workload, which has long-running, complex queries that are often parallelized by the Query Optimizer; this places a premium on having processors with higher physical core counts and better memory controllers in order to execute these types of queries as quickly as possible. Also very important for DW workloads is having a large amount of memory to ensure you have adequate room for the buffer pool.
A DW workload has more sequential reads from your data files and very little write activity to your data files and log file during normal operations. During data loads, you will see predominantly sequential write activity to your transaction log file and a combination of sequential and random write activity to your data files. You want to consider sequential read and write performance as you select and configure your I/O subsystem for a DW workload.
Relational Reporting Workloads
Many organizations maintain a second copy of an OLTP database for reporting usage. This is ideally located on a dedicated server that is separate from the primary OLTP database server. This “reporting” database will have many additional nonclustered indexes added to the existing OLTP tables and it may also have additional reporting tables containing calculated summary data for reporting purposes.
In some cases, this reporting database is restored from a backup of the production OLTP database, perhaps once a day. After the restore is finished, all the additional nonclustered indexes are created and the reporting tables are loaded and indexed. In terms of sequential read and write performance, this type of pattern places a lot of stress on the I/O subsystem. Restoring a database from a backup and creating many new indexes is a sequential operation, so having a lot of sequential I/O performance is very important. After the reporting database is ready for use, the overall workload becomes very similar to a DW workload. If you have this type of pattern, you should consider using the new columnstore index feature in SQL Server 2012.
Another scenario for a relational reporting database is to use transactional replication between the production OLTP database, which acts as a publisher, to the “reporting” database, which acts as a subscriber. Usually, many additional nonclustered indexes are added to the subscriber to improve query performance for reporting queries. Maintaining acceptable INSERT, UPDATE, and DELETE performance in this database is more difficult because of these additional indexes. This places more stress on your I/O subsystem, so you will see sequential writes to the log file and random writes to the data files. The reporting queries cause sequential reads from the data files. Overall, this is a relatively challenging mixed workload type.
OLAP Workloads
OLAP workloads have several different components, including reading data from the source(s) to initially build or update the cube, processing the cube when changes are made, and then actually running various types of OLAP queries to retrieve the data for users. Having processors with higher physical core counts, with better memory controllers in order to execute these types of queries as quickly as possible, is very valuable. Also very important for OLAP workloads is having a large amount of memory so that you can process large cubes quickly. OLAP workloads tend to have a lot of random I/O, so flash-based storage (see Chapter 4) for the cube files can be very beneficial. Flash-based storage includes solid-state drives (SSDs) and other devices such as Fusion-io cards that use solid-state flash memory for permanent storage. These types of devices offer extremely high random I/O performance, which is very useful for OLAP workloads.
Server Model Selection
In order to choose an appropriate server model for your database server, you must first decide whether you want to use an Intel processor or an AMD processor, as this absolutely dictates which server models you can consider from your system vendor. Next, you need to decide whether you will be using a one-socket, two-socket, or four-socket database server, or something even larger, as that constrains your available processor options. You also have to decide what vertical form factor you want for the server — that is, whether it will be a 1U, 2U, 4U, or even larger server. These designations, (1U, 2U, etc.) refer to how tall the server is in rack units, with a rack unit being roughly 1.75 inches tall. This affects how many servers will fit in a rack, and how many internal drive bays will fit inside a rack-mounted server.
These choices also affect the maximum amount of physical memory (RAM) that you can have, the number of Peripheral Component Interconnect Express (PCIe) expansion slots that are available, and the number of internal drive bays that are available in the server.
Here are some things to consider as you decide whether to purchase a two-socket database server or a four-socket database server. Traditionally, it was very common to use a four-socket machine for most database server scenarios, while two-socket servers were most often used for web servers or application servers. However, given recent advances in processors, improvements in memory density, and the increase in the number and bandwidth of PCIe expansion slots over the past several years, you might want to seriously reconsider that conventional wisdom.
Historically, two-socket database servers did not have enough processor capacity, memory capacity, or I/O capacity to handle most intense database workloads. Processors have become far more powerful in the last few years, and memory density has increased dramatically. It is also possible to achieve much more I/O capacity connected to a two-socket server than it was a few years ago, especially with the latest processors and chipsets that have PCIe 3.0 support.
Another reason to carefully consider this issue is the cost of SQL Server 2012 Enterprise Edition processor core licenses. If you can run your workload on a two-socket server instead of a four-socket server, you could save up to 50% on your SQL Server processor core license costs, which can be a very substantial savings! With SQL Server 2012 Enterprise Edition, the cost of a few processor core licenses would pay for a very capable two-socket database server (exclusive of the I/O subsystem).
Server Model Evolution
To provide some history and context, this section describes how the capabilities and performance of commodity two- and four-socket servers have changed over the past seven years. In 2005, you could buy a two-socket Dell PowerEdge 1850 with two hyperthreaded Intel Xeon “Irwindale” 3.2GHz processors and 12GB of RAM (with a total of four logical cores). This was fine for an application or web server, but it really didn’t have the CPU horsepower (the Geekbench score was about 2200) or memory capacity for a heavy-duty database workload (more details about Geekbench appear later in the chapter). This model server had relatively few expansion slots, with either two PCI-X or two PCIe 1.0 slots being available.
By early 2006, you could buy a four-socket Dell PowerEdge 6850 with four dual-core, Intel Xeon 7040 “Paxville” 3.0GHz processors and up to 64GB of RAM (with a total of 16 logical cores with hyperthreading enabled). This was a much better choice for a database server at the time because of the additional processor, memory, and I/O capacity compared to a PowerEdge 1850. Even so, its Geekbench score was only about 4400, which is pretty pathetic by today’s standards, even compared to a new Core i3–2350M entry-level laptop. In 2005 and 2006, it still made sense to buy a four-socket database server for most database server workloads because two socket servers simply were not powerful enough in terms of CPU, memory, or I/O.
By late 2007, you could buy a two-socket Dell PowerEdge 1950 with two, quad-core Intel Xeon E5450 processors and 32GB of RAM (with a total of eight logical cores), which provided a relatively powerful platform for a small database server. The Intel Xeon 5400 series did not have hyperthreading. A system like this would have a Geekbench score of about 8000. With only two PCIe 1.0 × 8 slots it had limited external I/O capability, but the gap compared to four socket servers was beginning to narrow.
In late 2008, you could get a four-socket Dell PowerEdge R900 with four, six-core Intel Xeon X7460 processors and 256GB of RAM (with a total of 24 logical cores). This system had seven PCIe 1.0 expansion slots, divided into four × 8 and three × 4 slots. (The × 4 and × 8 refer to the number of lanes. The more lanes, the higher the maximum bandwidth.) This was a very powerful but costly platform for a database server, with a Geekbench score of around 16,500. This was the last generation of Intel Xeon processors to use a symmetrical multiprocessing (SMP) architecture, rather than a non-uniform memory access (NUMA) architecture, so it did not scale very well when additional processor sockets were added to servers. The Intel Xeon 7400 series did not have hyperthreading. Many four-socket servers of this vintage are still in use today, even though their performance and scalability has long been eclipsed by modern two-socket servers.
By early 2009, you could get a two-socket Dell PowerEdge R710 with two, quad-core Intel Xeon X5570 processors, and 144GB of RAM (with a total of 16 logical cores with hyperthreading enabled). This system had four PCIe 2.0 expansion slots, divided into two × 8 and two × 4 slots. This provided a very powerful database server platform in a very compact package. Such a system would have a Geekbench score of around 15,000. It used the 45nm Nehalem-EP family processor, which had NUMA support. This was when the tide began to turn in favor of two-socket servers instead of four-socket servers, as this system had enough CPU, memory, and I/O capacity to compare favorably with existing four-socket servers. If you were concerned about 144GB of RAM not being enough memory in the R710, you could buy two R710s, nearly doubling the CPU capacity and the I/O capacity of a single R900. This assumes that you could split your database workload between two database servers, by moving databases or doing something such as vertical or horizontal partitioning of an existing large database.
By early 2011, you could buy that same Dell PowerEdge R710 with more powerful six-core 32nm Intel Xeon X5690 processors and up to 288GB of RAM (with a total of 24 logical cores with hyperthreading enabled), and push the Geekbench score to about 24,000. This gives you quite a bit more CPU capacity and memory than the PowerEdge R900 that you could buy in late 2008. An R710 with those processors would give you the absolute best single-threaded OLTP performance available until March 2012, when the Dell R720 with the 32nm Xeon E5–2690 became available.
In March of 2012, you could purchase a two-socket Dell PowerEdge R720 with two, eight-core 32nm Intel Xeon E5–2690 processors and up to 768GB of RAM (with 32GB DIMMs) and seven PCIe 3.0 expansion slots, split between six × 8 and one × 16 slots. This provides a total of 32 logical cores (with hyperthreading enabled) visible to Windows, and this system has a Geekbench score of about 41,000, a significant improvement over the previous generation R710 server. It also has more memory capacity, better memory bandwidth, and much more I/O capacity due to the higher number of improved PCIe 3.0 expansion slots. This two-socket system has a Geekbench score that is roughly comparable to a 2011 vintage four-socket Dell PowerEdge R910 server that is using the 32nm Xeon E7–4870 processor. We now have a two-socket server that compares extremely well with the latest model four-socket servers in nearly every respect.
This overall trend has been continuing over the past several years, with Intel introducing new processors in the two-socket space about 12–18 months ahead of introducing a roughly equivalent new processor in the four-socket space. This means that you will get much better single-threaded OLTP performance from a two-socket system than from a four-socket system of the same age (as long as your I/O subsystem is up to par). The latest model two-socket servers with the Sandy Bridge-EP Intel Xeon E5–2690 processor compare very favorably to four-socket servers with the Sandy Bridge-EP Intel Xeon E5–4650, and even more favorably to four-socket servers with the older Westmere-EX Intel Xeon E7–4870 for all but the largest workloads.
Given the choice, two, two-socket machines instead of one, four-socket machine would be preferable in almost all cases. The only major exception would be a case in which you absolutely needed far more memory in a single server than you can get in a two-socket machine (a Dell PowerEdge R720 can now handle up to 768GB if you are willing to pay for 32GB DIMMs) and you are unable to do any reengineering to split up your workload.
From a SQL Server 2012 licensing perspective, a fully loaded Dell R720 is much more affordable than a fully loaded Dell R910, as we are talking about 16 physical cores for the R720 vs. 40 physical cores for the R910. At the time of writing, the full retail cost of 16 processor core licenses for SQL Server 2012 Enterprise Edition would be $109,984, whereas the retail cost for 40 processor core licenses would be $274,960. This means that you could buy two very well equipped R720 servers and their required SQL Server licenses for significantly less money than the cost of a single well-equipped R910 and its required SQL Server licenses. If you can split your workload between two servers, you would get much better performance and scalability from two R720 servers compared to a single R910 server.
PROCESSOR VENDOR SELECTION
The critical first question is whether you want an Intel processor or an AMD processor for your database server. Unfortunately, it is very hard to make a viable case for choosing an AMD processor-based server for SQL Server 2012, for two main reasons. The first reason is performance. The cold, hard fact is that AMD has simply been unable to compete with Intel from a single-threaded performance perspective since the introduction of the Intel Nehalem microarchitecture in 2008. This gap has only increased over the past several years with the introduction of the Westmere, Sandy Bridge, and Ivy Bridge processors. The second reason is the licensing cost for SQL Server 2012 Enterprise Edition. AMD processors have higher physical core counts in their processors compared to Intel, and they provide lower performance per physical core. This forces you to pay for more SQL Server 2012 core licenses but get lower single-threaded performance, which is not a very good combination.
Because SQL Server 2012 Enterprise Edition is licensed by physical core, this makes it much more expensive to use a relatively poorly performing AMD processor for SQL Server 2012. One argument in favor of AMD is that their high-end processors are significantly less expensive than the high-end Intel models. If your primary consideration is getting the absolute lowest hardware cost, regardless of the effect on performance or scalability, then you should be considering a low core count, AMD processor-based system. In fairness to AMD, many typical SQL Server workloads would run perfectly fine on a modern AMD system; therefore, if low hardware cost is your first priority, you can buy an AMD server with a low core count processor to save some money.
Intel Processors
Until the introduction of the Intel Xeon E7 processor family in 2011 and the Intel Xeon E5 processor family in 2012, Intel had different processor families for different socket count servers. For example, the Intel Xeon 3xxx family was for single-socket servers, the Intel Xeon 5xxx family was for two-socket servers, and the Intel Xeon 7xxx family was for four-socket (or more) servers. Now you can get an Intel Xeon E5 family processor for a one-, two-, or four-socket server. You can choose a Xeon E5–2400 series processor for a one- or two-socket server, a Xeon E5–2600 series processor for a two-socket server, or a Xeon E5–4600 series processor for a four-socket server. You can also get an Intel Xeon E7 family processor for a two-, four-, or eight-socket server. You can choose a Xeon E7–2800 series processor for a two-socket server, a Xeon E7–4800 series processor for a four-socket server, or a Xeon E7–8800 series processor for an eight-socket (or more) server. These new options from Intel can be quite confusing to sort out unless you pay attention to the details.
Prior to the release of SQL Server 2012, paying the price premium for the absolute best processor available for each socket in your database server was an effective strategy for database server processor selection. The SQL Server processor license cost was pretty high (even for Standard Edition), so you wanted to get as much performance and scalability capacity as possible for each expensive processor socket license that you purchased.
This is still a valid strategy for SQL Server 2008 R2 and earlier, but the licensing changes in SQL Server 2012 Enterprise Edition dictate a few modifications to this line of thinking. In early November 2011, Microsoft announced some rather fundamental changes regarding how SQL Server 2012 will be licensed compared to previous versions. SQL Server 2012 has three main editions: Enterprise Edition, Business Intelligence Edition, and Standard Edition. The old Data Center Edition and Workgroup Edition have been eliminated, which is probably no big loss. The existing Developer and Express Editions are still available, along with Web Edition for hosting providers.
Rather than the old, familiar socket-based licensing used in SQL Server 2008 R2 and earlier, SQL Server 2012 uses a combination of core-based and Server + Client Access License (CAL) licensing, depending on which edition you buy, and which choice you make for Standard Edition. With Standard Edition, you can choose core-based licensing or Server + CAL-based licensing. With Business Intelligence Edition, you have to use Server + CAL-based licensing, while Enterprise Edition requires the use of core-based licensing. Standard Edition is the base edition, with a limit of 16 physical processor cores. Microsoft decided to maintain the 64GB RAM limit for SQL Server 2012 Standard Edition (just like the 64GB RAM limit in SQL Server 2008 R2 Standard Edition). Business Intelligence Edition includes all the functionality of Standard Edition, plus extra BI features and functionality. Enterprise Edition includes everything in BI Edition, plus all the extra Enterprise Edition features and functionality. Enterprise Edition is the top-of-the-line edition of SQL Server 2012, now including all the features that were available in SQL Server 2008 R2 Data Center Edition. As a DBA, you really want to use Enterprise Edition if you have any choice in the matter, as it offers so many useful features, such as online index operations, data compression, and AlwaysOn availability groups, to name a few.
If you are using core-based licensing (as you must for SQL Server 2012 Enterprise Edition), each physical socket in your server must use a minimum of four core licenses. That means if you have old hardware that uses dual-core processors, you still have to buy four core licenses for each socket. That is yet another reason to not use ancient hardware for SQL Server 2012. Any Intel Xeon or AMD Opteron processor that has only two physical cores was at least four to five years old by the time SQL Server 2012 was released, so it really should be retired. Keep in mind that only physical cores count for licensing purposes (on non-virtualized servers), so Intel hyperthreading is free from a licensing perspective.
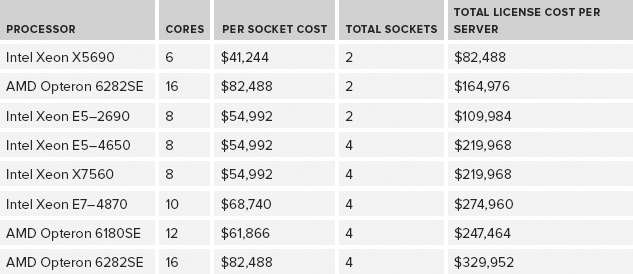
Core licenses are now sold in two-core packs, again with a minimum of four cores per physical socket. The full retail license cost per physical core is $6,874 for SQL Server 2012 Enterprise Edition. This is pretty grim news for AMD, with their higher physical core counts and lower per-socket performance compared to Intel. This situation was so obvious that Microsoft released a SQL Server 2012 Core Factor Table on April 1, 2012, that reduces the per-core license cost by 25% for a number of modern AMD processors that have six or more cores. Even with this change, the latest AMD processors are not a very cost-effective choice for SQL Server 2012. The numbers in Table 2-1 show the cost differential in pretty graphic detail, even with the .75 AMD Core Factor (see the “AMD Processors and Numbering” section later) applied to the license costs for the AMD processors.
TABLE 2-1: SQL Server 2012 License Cost Comparison
For an OLTP workload on a two-socket server, an Intel Xeon E5–2690 processor would be preferable to an Intel Xeon E7–2870 processor because of its better single-threaded performance, a result of being a newer-generation model (Sandy Bridge-EP vs. Westmere-EX), higher clock speed, better memory bandwidth, and PCIe 3.0 support. For a DSS/DW workload, the E5–2690 would be preferable for the same reasons, even though it has a lower core count and a smaller L3 cache size.
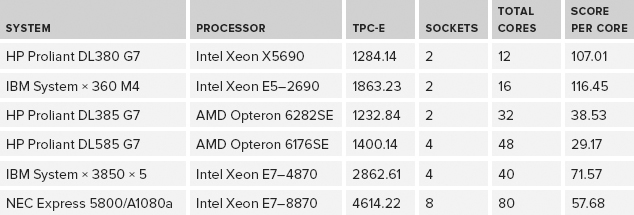
For most OLTP workloads, you would also be far better off, from a performance perspective, with an older two-socket Intel Xeon X5690 server or a two-socket Intel Xeon E5–2690 server than you would be with a four-socket AMD Opteron 6282SE server. The extremely large difference in license cost between those two options makes Intel an even more compelling choice. As shown in Table 2-2, one way to partially confirm this assessment is to look at TPC-E scores for different systems and divide them by the total physical core count for the system (not by the thread count).
TABLE 2-2: TPC-E Scores by Total Physical Cores
It is very unlikely that you would ever upgrade to a better processor in an existing database server, so you will be stuck with your processor choice for the life of the server. If you have “excess” processor capacity, consider using it to trade CPU utilization for I/O utilization by using backup compression and data compression (if you have the Enterprise Edition of SQL Server 2008 or newer). Unlike a laptop or web server, it is a mistake to buy a processor that is a couple of steps down from the top-of-the-line model for database server usage. Trading some extra CPU utilization for less I/O utilization is usually a net win, especially if you have a modern, multi-core processor that can readily handle the extra work.
Of course, a new two-socket server will have a lower total RAM limit than a new four-socket server. For example, a two-socket Xeon X5690 would be limited to 288GB of RAM, which is probably enough for most workloads. A two-socket server will also have less total I/O capacity than a new four-socket server because it has fewer PCIe expansion slots. Still, you can easily get 5–6GB/sec of sequential throughput out of a modern two-socket server, which should be plenty for most workloads. After the Intel 32nm Sandy Bridge-EP Xeon E5–2600 series was released in early 2012, the wisdom of choosing a two-socket Intel-based server was even clearer, as it has higher memory density, more I/O bandwidth, and even better per-core performance than the Xeon 5600 series did.
If you are looking at the lower end of the cost and workload spectrum, you have several options. The one-socket 22nm Intel Xeon E3–1290 v2 processors (which are basically the same as the desktop Ivy Bridge Core i7 processor) are limited to 32GB of RAM, which somewhat limits their utility for larger database usage. If 32GB of RAM is not enough for your workload, a single-socket Dell R320 server with one Intel Xeon E5–2400 series processor and up to 96GB of RAM is available. Keep in mind that the memory limit for SQL Server 2012 Standard Edition is still 64GB, which is too low considering the memory density of modern hardware. One possible way around it with good hardware (with more than 128GB of RAM) is to install more than one instance of SQL Server 2012 Standard Edition on the same physical server.
Classic Intel Processor Numbering
In order to understand older Intel processor numbers, you need to know how to decode “classic” Intel processor numbers. By classic we mean Intel Xeon processors produced from about 2006 until April 2011 (when Intel introduced a new processor numbering system for new and upcoming processors).
Knowing how to decode the processor model number is a very handy skill to have when you want to understand the capabilities, relative age, and relative performance of a particular processor. An example of an Intel processor number is shown in Figure 2-1.
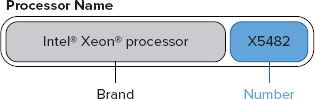
Intel Xeon processor numbers are categorized in four-digit numerical sequences, plus an alpha prefix that indicates whether it is optimized for electrical power usage or performance. The alpha prefixes are as follows:
- X, meaning performance
- E, meaning mainstream
- L, meaning power optimized
The model number starts with 3, 5, or 7, depending on the server form factor for which the processor is designed. If the processor number starts with a 3, it is designed for a single-socket server; if it starts with a 5, it is designed for a two-socket server; and if it starts with a 7, it is designed for a four-socket or more server. The second digit of the model number designates the generation, or relative age, of a processor. For example, the Xeon 5100 series was launched in Q2 2006, while the Xeon 5300 series was launched in Q4 2006, and the Xeon 5400 series was launched in Q4 2007.
For a more complete example, a Xeon X7560 is a high-end performance processor for multi-processor systems, an Intel Xeon E5540 is a mainstream processor for dual-processor systems, while an Intel Xeon L5530 is a power-optimized processor for dual-processor systems. The final three digits denote the generation and performance of the processor; for example, a Xeon X7560 processor would be newer and probably more capable than a Xeon X7460 processor. Higher numbers for the last three digits of the model number mean a newer generation in the family — for example, 560 is a newer generation than 460.
You should always choose the performance models, with the X model prefix, for SQL Server usage. The additional cost of an X series Xeon processor, compared to an E series, is minimal compared to the overall hardware and SQL Server license cost of a database server system. You should also avoid the power-optimized L series, as these can reduce processor performance by 20% to 30% while only saving 20 to 30 watts of power per processor, which is pretty insignificant compared to the overall electrical power usage of a typical database server (with its cooling fans, internal drives, power supplies, etc.). Of course, it would be a different story if you needed dozens or hundreds of web servers instead of a small number of mission-critical database servers, as the overall power savings would be pretty significant in that case.
Current Intel Processor Numbering
This section explains the current processor numbering system for Xeon processors that Intel introduced on April 5, 2011. This new system, shown in Figure 2-2, is used for the new processor families that Intel released on that date (the E3 series and the E7 series) and the E5 series that was released in March of 2012. The model numbers for the older existing Xeon processors remain unchanged in this system.
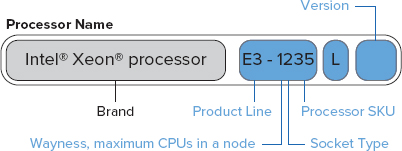
The first two digits in the processor number represent the Product Line designation, which will be E3, E5, or E7, depending on their place in the overall product lineup. After the Product Line designation is a four-digit number that provides more details about the particular processor. The first digit is the “wayness,” which is the number of physical CPUs that are allowed in a node (which is a physical server). This first digit can be 1, 2, 4, or 8. The second digit is the socket type, in terms of its physical and electrical characteristics. The last two digits are the processor SKU, with higher numbers generally indicating higher performance. Finally, an L at the end indicates energy-efficient, low electrical power processors. For SQL Server database server usage, you should avoid these power-optimized processors, as the performance impact of the reduced power usage is pretty dramatic.
The E3 Product family is for single-processor servers or workstations. The first generation of this family (E3–1200 series) is essentially the same as the desktop 32nm Sandy Bridge processors that were released in January 2011. The second generation of this family is the E3–1200 v2 series, which is basically the same as the desktop 22nm Ivy Bridge processors that were released in May 2012. They are both limited to 32GB of RAM.
The E5 Product family (the 32nm Sandy Bridge-EP) includes the E5–2600 series that was released in March 2012, and the E5–2400 series (32nm Sandy Bridge-EN) and E5–4600 series that were released in May 2012. You should probably avoid the entry-level Sandy Bridge-EN series, which has less memory bandwidth and lower clock speeds compared to the Sandy Bridge-EP series.
The E7 Product family (the 32nm Westmere-EX) has different models that are meant for two-socket servers, four-socket servers, and eight-socket and above servers. The E7–2800 series is for two-socket servers, the E7–4800 series is for four-socket servers, while the E7–8800 series is for eight-socket and above servers. Just in case you are wondering, the “EP” designation at the end of the family code word (such as Westmere-EP) stands for “efficient performance,” while the “EX” designation stands for “expandable.”
Intel’s Tick-Tock Release Strategy
Since 2006, Intel has adopted and implemented a Tick-Tock strategy for developing and releasing new processor models. Every two years, they introduce a new processor family, incorporating a new microarchitecture; this is the tock release. One year after the tock release, they introduce a new processor family that uses the same microarchitecture as the previous year’s tock release, but using a smaller manufacturing process technology and usually incorporating other small improvements, such as larger cache sizes or improved memory controllers. This is the tick release. This Tick-Tock release strategy benefits the DBA in a number of ways. It offers better predictability regarding when major (tock) and minor (tick) releases will be available. This helps you plan hardware upgrades to possibly coincide with your operating system and SQL Server version upgrades.
Tick releases are usually socket-compatible with the previous year’s tock release, which makes it easier for the system manufacturer to make the latest tick release processor available in existing server models quickly, without completely redesigning the system. In most cases, only a BIOS update is required to enable an existing model system to use a newer tick release processor. This makes it easier for the DBA to maintain servers that are using the same model number (such as a Dell PowerEdge R710 server), as the server model will have a longer manufacturing life span. For example, the Dell PowerEdge R710 was able to use the original 45nm Nehalem-EP Xeon 5500 series processors and the newer 32nm Westmere-EP Xeon 5600 series processors, so that model server was available for purchase for over three years.
As a DBA, you need to know where a particular processor falls in Intel’s processor family tree in order to meaningfully compare the relative performance of two different processors. Historically, processor performance has nearly doubled with each new tock release, while performance usually increases by around 20–25% with a tick release. Some of the recent and upcoming Intel Tick-Tock releases are shown in Figure 2-3.
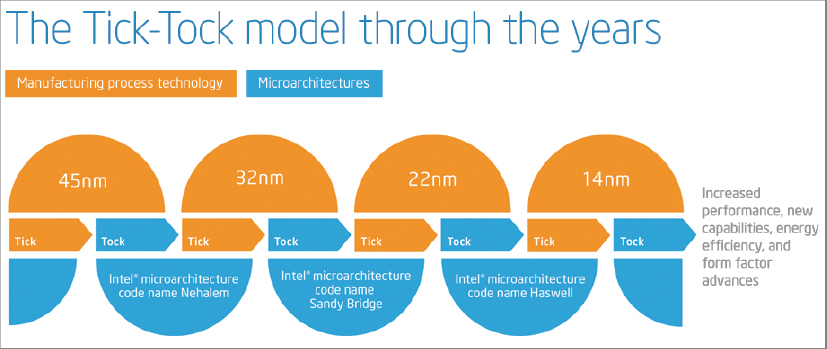
The manufacturing process technology refers to the size of the individual circuits and transistors on the chip. The Intel 4004 (released in 1971) series used a 10-micron process; the smallest feature on the processor was 10 millionths of a meter across. By contrast, the Intel Xeon “Ivy Bridge” E3–1200 v2 series (released in May 2012) uses a 22nm process. For comparison, a nanometer is one billionth of a meter, so 10 microns would be 10,000 nanometers. This ever-shrinking manufacturing process is important for two main reasons:
- Increased performance and lower power usage — Even at the speed of light, distance matters, so having smaller components that are closer together on a processor means better performance and lower power usage.
- Lower manufacturing costs — This is possible because more processors can be produced from a standard silicon wafer. This helps to create more powerful and more power-efficient processors available at a lower cost, which is beneficial to everyone but especially the database administrator.
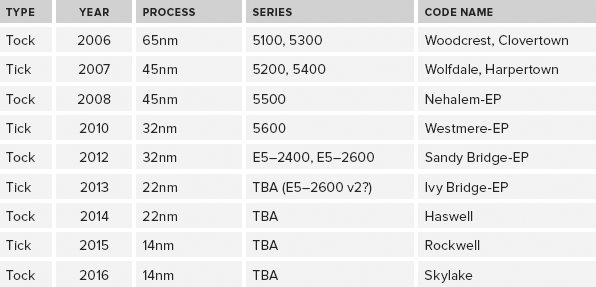
The first tock release was the Intel Core microarchitecture, which was introduced as the dual-core “Woodcrest” (Xeon 5100 series) in 2006, with a 65nm process technology. This was followed up by a shrinkage to 45nm process technology in the dual-core “Wolfdale” (Xeon 5200 series) and quad-core “Harpertown” processors (Xeon 5400 series) in late 2007, both of which were Tick releases. The next tock release was the Intel “Nehalem” microarchitecture (Xeon 5500 series), which used a 45nm process technology, introduced in late 2008. In 2010, Intel released a Tick release, code-named “Westmere” (Xeon 5600 series) that shrank to a 32nm process technology in the server space. In 2011, the 32nm “Sandy Bridge” tock release debuted with the E3–1200 series for single-socket servers and workstations. This was followed up by the “Ivy Bridge” tick release of the E3–1200 v2 series for single-socket servers and workstations that had a process shrink to 22nm. Table 2-3 shows the recent and upcoming Tick-Tock releases in the two-socket server space.
TABLE 2-3: Intel Tick-Tock Release History for Two Socket Servers
Intel Hyperthreading
Intel originally implemented a feature called hyperthreading back in 2002, as part of the NetBurst architecture in the Northwood-based Pentium 4 processors and the equivalent Xeon family. Hyperthreading was created to address the frequently wasted processor cycles that resulted when the central processor in a system waited on data from main memory. Instead of wasting processor cycles during this wait time, the idea was to have two logical processors inside a single physical core that could each work on something different when the other logical processor was stalled waiting on data from main memory.
Hyperthreading is Intel’s marketing term for its simultaneous multi-threading architecture whereby each physical processor core is split into two logical cores. The “simultaneous” term is a little misleading, as you cannot actually have two threads running simultaneously on the two logical cores in a single physical core of the same physical processor. What actually happens is that the threads run alternately, with one working while the other one is idle.
Hyperthreading works quite well for desktop applications. The classic example is running a complete anti-virus scan while the user is still able to work interactively with another application in the foreground. Unfortunately, the initial implementation of hyperthreading on the Pentium 4 NetBurst architecture did not work very well on many server workloads such as SQL Server. This was because the L2 data cache for each physical core was shared between the two logical cores, which caused performance issues because the L2 cache had to be constantly refreshed as the application context switched between the two logical processors. This behavior was known as cache thrashing, and it often led to a decrease in overall performance for SQL Server workloads. Another factor that made this situation even worse was the very deep processor pipeline that was used in the Pentium 4 architecture, which made it even more costly when the data needed by the logical processor was not found in the L2 cache.
Because of these factors, it became very common for database administrators to disable hyperthreading for all SQL Server workloads, which is really a mistake. Different types of SQL Server workloads react differently to having hyperthreading enabled, with OLTP workloads generally performing better with hyperthreading enabled, and data warehouse workloads sometimes performing worse with hyperthreading enabled. Before you decide whether to enable or disable hyperthreading, test it both ways with your actual workload.
Modern Intel processors (Nehalem, Westmere, Sandy Bridge, and Ivy Bridge) seem to work much better with hyperthreading because of larger L2 and L3 cache sizes, newer processor architectures, and faster access to main memory. Because of this, we advise you to enable hyperthreading for SQL Server, especially for OLTP workloads, unless you have done testing that actually shows a performance decrease with your workload. It is significant that every single TPC-E OLTP benchmark submission for these modern Intel processors has been done with hyperthreading enabled on the database server, which is certainly intentional.
AMD Processors and Numbering
This section discusses AMD Opteron processor numbering. Advanced Micro Devices (AMD) has various versions of the Opteron family that are meant for server use. When assessing AMD processors, it is very helpful to understand what the model numbers actually mean. Recent AMD Opteron processors are identified by a four-character model number in the format ZYXX, where the Z character indicates the product series:
- 1000 Series = 1-socket servers
- 2000 Series = Up to 2-socket servers and workstations
- 4000 Series = Up to 2-socket servers
- 6000 Series = High performance 2- and 4-socket servers
- 8000 Series = Up to 8-socket servers and workstations
The Y character differentiates products within a series:
- Z2XX = Dual-Core.
- Z3XX = Quad-Core.
- Z4XX = Six-Core.
- First-generation AMD Opteron 6000 series processors are denoted by 61XX.
- Second-generation AMD Opteron 6000 series processors are denoted by 62XX.
The XX digits indicate a change in product features within the series (for example, in the 8200 series of dual-core processors, you can find models 8214, 8216, 8218, and so on), and are not a measure of performance. It is also possible to have a two-character product suffix after the XX model number, as follows:
- No suffix — Indicates a standard power AMD Opteron processor
- SE — Performance optimized, high-powered
- HE — Low-powered
- EE — Lowest power AMD Opteron processor
For example, an Opteron 6282 SE would be a 6000 series, 16-core, performance-optimized processor; an Opteron 8439 SE would be an 8000 series, six-core, performance-optimized processor; while an Opteron 2419 EE would be a 2000 series, six-core, energy-efficient processor. For mission-critical database servers, we recommend selecting an SE suffix processor, if it is available for your server model. The reason why it isn’t available in every server model is due to its higher electrical power requirements.
It should also be noted that AMD has broken their own processor numbering rules with the most recent versions of the Opteron (including the 4100, 4200, 6100, and 6200 series), as they do not follow the standard numbering scheme just described.
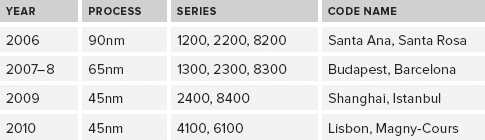
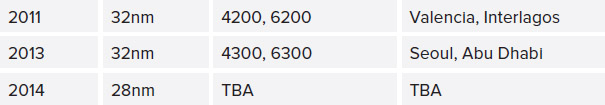
Recent Opteron AMD releases, plus planned releases, are summarized in Table 2-4. Since 2011, the 16-core Interlagos processor has been AMD’s best-performing model, even though it did not live up to expectations for that release.
TABLE 2-4: Recent AMD Processor Releases
SQL Server 2012 Core Factor Table
Looking at recent TPC-E benchmark submissions for both AMD and Intel processors, it is pretty difficult to avoid noticing how poorly the few tested AMD systems have done compared to the latest Intel systems. For example, in January 2012, a new Hewlett-Packard TPC-E benchmark submission showed a 1232.84 TpsE score for a two-socket AMD system with 32 physical cores, compared to a 1284.14 TpsE score for a two-socket Intel system with 12 physical cores. Both of these TPC-E benchmark submissions were on SQL Server 2008 R2. With these results, you would be paying 2.66 times as much for SQL Server 2012 Enterprise Edition core licenses for the AMD system compared to the Intel system (32 physical cores vs. 12 physical cores). This is rather dire news for AMD, with their higher physical core counts and lower per physical core OLTP performance compared to Intel.
Likely in response to this situation, on April 1, 2012, Microsoft released a new SQL Server 2012 Core Factor Table for AMD processors, which is shown in Table 2-5. Note that not all processors are included in the table.
TABLE 2-5: SQL Server 2012 Core Factor Table for AMD Processors
| PROCESSOR TYPE | CORE FACTOR |
| All other AMD Processors | 1 |
| AMD 31XX, 32XX, 41XX, 42XX, 61XX, 62XX Series Processors with 6 or more cores | 0.75 |
| Single-Core Processors | 4 |
| Dual-Core Processors | 2 |
The most relevant part of this table regards the newer AMD 31XX, 32XX, 41XX, 42XX, 61XX, and 62XX series of processors with six or more cores that have a core factor of 0.75. Having a core factor of 0.75 means that you multiply the actual number of physical cores times the core factor to arrive at the number of cores for SQL Server licensing purposes; for example, if you had a four-socket server, where each socket was populated with an AMD Opteron 6284 SE processor. That particular processor has 16 physical cores, so 4 times 16 would give you a result of 64 SQL Server 2012 core licenses that would be required for that server (before the Core Factor table was introduced). Using the new licensing rules from the Core Factor table, you would be able to multiply 64 times 0.75 to get a new result of 48 SQL Server 2012 core licenses that would be required for that server (after the Core Factor table was introduced). This means that AMD cores for some processors are somewhat more affordable now for SQL Server 2012 than they would be without the core factor calculation.
Based on the SQL Server 2012 Core Factor Table, you would only be paying twice as much for SQL Server 2012 Enterprise Edition licenses for the 32-core AMD system compared to the 12-core Intel system (32 AMD physical cores times 0.75 vs. 12 Intel physical cores). That is a slightly better story for AMD, but it is still a pretty hard sell.
Based on the TPC-E benchmark results, both the older Intel Xeon X5600 Westmere-EP series and the new Intel Xeon E5–2600 Sandy Bridge-EP series perform much better per physical core on OLTP workloads than the latest AMD Opteron 6200 series processors. These Intel processors simply have significantly better single-threaded performance, which is very important for OLTP workloads.
As a result of this new Core Factor Table, SQL Server 2012 processor licenses will be a little less expensive than they were previously for those AMD processor families that have more than six cores, but they will still be much more expensive in total than a better-performing Intel solution. The somewhat lower hardware cost for the AMD processor compared to the hardware cost of the Intel processor is rather trivial compared to the difference in the licensing cost. Hopefully AMD can do better with the upcoming Piledriver core-based Opteron series expected in 2013.
CHOOSING AND CONFIGURING HARDWARE FOR REDUNDANCY
This section describes the most important items that you should consider from a hardware perspective when you are trying to increase the basic resiliency and availability of an individual database server. These are some of the first steps you would take as part of designing a high-availability solution for your data tier. The basic goal here is to eliminate as many single points of failure as possible at the hardware and configuration level. Therefore, when choosing components for a database server and including them as part of the server configuration (as opposed to a web server, for example), you should consider these aspects regardless of any other high-availability techniques you decide to use.
You should always get two internal drives in a RAID 1 (mirrored) configuration for the operating system and the SQL Server binaries. These drives should be using the integrated hardware RAID controller that is available on most new rack-mounted servers. Using an integrated hardware RAID controller (which usually has a 256MB–512MB cache) provides better performance than using software RAID through Windows. Having two drives in RAID 1 offers a basic level of redundancy for the operating system and the SQL Server binaries, so the server will not stop functioning if one of the drives fails.
Try to get at least 146GB, 15K 2.5″ drives for this purpose. Using 15K drives helps Windows Server boot a little faster, and it will help SQL Server load a bit faster when the service first starts up. Using 146GB (or larger) drives provides more room to accommodate things like the Windows page file, SQL Server Error Log files, dump files, and so on, without being worried about drive space. As SSD prices continue to fall, you might want to consider using two SSDs for your mirrored boot drive. Reducing your boot time and reducing the time it takes for SQL Server to start up using SSDs could help you meet your recovery time objective (RTO) goals.
Ensure that you have dual power supplies for the database server, each plugged into separate circuits in your server room or data center. You should also be plugged into an uninterruptable power supply (UPS) on each circuit, and ideally have a backup power source, such as a diesel generator for your data center. The idea here is to protect against an internal power supply failure, a cord being kicked out of an electrical socket, a circuit breaker tripping, or loss of electrical power from the utility grid. Adding a second power supply is relatively inexpensive insurance, typically less than $300. Despite this, we have seen many battles with economizing bosses about this item over the years. Power supplies do fail, cords are accidentally unplugged, and circuit breakers do get tripped. Therefore, stick to your guns about dual power supplies for a database server. You should have multiple network ports in the server, with Ethernet connections into at least two different network switches. These network switches (which should also have dual power supplies) should be plugged into different electrical circuits in your data center. Most new rack-mounted servers have at least four gigabit Ethernet ports embedded on the motherboard. All of this is designed to prevent an outage caused by the loss of a single network port or a single network switch.
You should have multiple RAID controller cards (if you are using direct-attached or internal storage); multiple host bus adapters (HBAs) (if you are using a Fibre Channel SAN); or multiple PCIe Gigabit, or better Ethernet cards with an iSCSI SAN. This will give you better redundancy and better throughput, depending on your configuration. Again, the idea here is to try to avoid an outage caused by the loss of a single component.
Wherever your SQL Server data files, log files, tempdb files, and SQL Server backup files are located, they should be protected by an appropriate RAID level, depending on your budget and performance needs. You want to prevent your databases from going down due to the loss of a single drive. Keep in mind that RAID is not a substitute for an appropriate SQL Server backup and restore strategy! Never let anyone, whether it is a SAN vendor, a server administrator from your operations team, or your boss, talk you into not doing SQL Server backups as appropriate for your recovery point objective (RPO) and recovery time objective (RTO) requirements. This cannot be emphasized enough! There is absolutely no substitute for having SQL Server backup files, although you will undoubtedly be pressured throughout your career, by different people, into not running SQL Server database backups. Stand your ground. The old saying is true: “If you don’t have backups, you don’t have a database.”
To reduce the boot and SQL Server startup time on your database servers, note the following BIOS configuration setting. For a standalone database server, reducing your total reboot time has a direct effect on your high-availability numbers. Therefore, go into the BIOS setup for the server and disable the memory testing that normally occurs during the POST sequence, which shaves a significant amount of time off of it (often many minutes, depending on how much RAM is installed), so the server will boot faster. This carries little risk, as this testing only occurs during the POST sequence; it has nothing to do with detecting a memory problem while the server is running later, which is the job of your hardware or system-monitoring software.
While you are in the BIOS setup, also access the Power Management section and either disable the power management settings or set them to OS control. By default, Windows Server 2008 and Windows Server 2008 R2 use the Windows Balanced Power Plan. This saves electrical power usage by reducing the multiplier setting for the processors, which reduces their clock speed when the system is not under a heavy load. This sounds like a good idea, but it can actually have a very significant negative effect on performance, as some processors do not react quickly enough to an increase in workload. This is particularly important if you have an Intel Nehalem or Westmere family processor. The latest Intel Sandy Bridge and Ivy Bridge family processors react to power state changes much more quickly than Nehalem or Westmere did, which makes them much less sensitive to those changes from a performance perspective.
Regardless of what processor you have, power management can have other negative effects on your database server. One example is when you are using Fusion-io cards in your server. Some forms of hardware management can affect the PCIe slots in the server, so Fusion-io specifically recommends that you disable power management settings in your main BIOS setup and in Windows. The easy solution to all of this is to ensure that you are using the High Performance Windows Power Plan, and that you disable the power management settings in your BIOS.
Finally, after ensuring that you have followed all the guidelines described thus far, you still are not done. Depending on your RPO and RTO requirements, you should be planning and hopefully implementing some sort of overall high-availability and disaster-recovery (HA/DR) strategy to provide you with an even more robust system that will be able to handle as many different types of issues and “disasters” as possible. This strategy could include technologies such as Windows failover clustering, database mirroring, log shipping, transactional replication, and SQL Server 2012 AlwaysOn Availability Groups, along with an actual plan that outlines the policies and procedures needed to successfully handle a disaster.
HARDWARE COMPARISON TOOLS
We are firm proponents of using readily available benchmark tools and some common sense and analysis as a means of comparing different hardware types and configurations. Rather than simply guess about the relative and absolute performance of different systems, you can use the results of standardized database benchmarks and specific component benchmarks to more accurately evaluate and compare different systems and components. This section discusses two such benchmarking tools: the TPC-E OLTP benchmark and the Geekbench processor and memory performance benchmark.
TPC-E Benchmark
The TPC Benchmark E (TPC-E) is an OLTP performance benchmark that was introduced in early 2007. TPC-E is a not a replacement for the old TPC-C benchmark, but rather a completely new OLTP benchmark. Even though this newer benchmark has been available for over five years, there are still no posted results for any RDBMS other than SQL Server. Fortunately, many results are posted for SQL Server, which makes it a very useful benchmark when assessing SQL Server hardware. At the time of writing, there are 54 published TPC-E results, using SQL Server 2005, 2008, 2008 R2, and SQL Server 2012. This gives you many different systems and configurations from which to choose as you look for a system resembling one that you want to evaluate.
The TPC-E benchmark is an OLTP, database-centric workload that is meant to reduce the cost and complexity of running the benchmark compared to the older TPC-C benchmark. Unlike TPC-C, the storage media for TPC-E must be fault tolerant (which means no RAID 0 arrays). Overall, the TPC-E benchmark is designed to have reduced I/O requirements compared to the old TPC-C benchmark, which makes it both less expensive and more realistic because the sponsoring hardware vendors will not feel as much pressure to equip their test systems with disproportionately large, expensive disk subsystems in order to get the best test results. The TPC-E benchmark is also more CPU intensive than the old TPC-C benchmark, which means that the results tend to correlate fairly well to CPU performance, as long as the I/O subsystem can drive the workload effectively.
It simulates the OLTP workload of a brokerage firm that interacts with customers using synchronous transactions and with a financial market using asynchronous transactions. The TPC-E database is populated with pseudo-real data, including customer names from the year 2000 U.S. Census, and company listings from the NYSE and NASDAQ. Having realistic data introduces data skew, and makes the data compressible. The business model of the brokerage firm is organized by customers, accounts, and securities. The data model for TPC-E is significantly more complex, and more realistic, than TPC-C, with 33 tables and many different data types. The data model for the TPC-E database also enforces referential integrity, unlike the older TPC-C data model.
The TPC-E implementation is broken down into a Driver and a System Under Test (SUT), separated by a network. The Driver represents the various client devices that would use an N-tier client-server system, abstracted into a load generation system. The SUT has multiple application servers (Tier A) that communicate with the database server and its associated storage subsystem (Tier B). The TPC provides a transaction harness component that runs in Tier A, while the test sponsor provides the other components in the SUT. The performance metric for TPC-E is transactions per second, tpsE. The actual tpsE score represents the average number of Trade Result transactions executed within one second. To be fully compliant with the TPC-E standard, all references to tpsE results must include the tpsE rate, the associated price per tpsE, and the availability date of the priced configuration. The current range of published TPC-E scores ranges from a low of 144.88 tpsE to a high of 4614.22. There are scores for two-socket, four-socket, eight-socket and 16-socket systems, using several different processor families from Intel and AMD. Reflecting the performance deficit of recent AMD processors, only four AMD results have been published out of the 54 total submissions.
When assessing the OLTP performance of different server platforms using different processor families and models, you want to look for a TPC-E result that uses the same type and number of processors as the system you are considering. If you cannot find an exact match, look for the closest equivalent system as a starting point, and then adjust the results upward or downward using component benchmark results and common sense.
For example, let’s say that you are considering the potential performance of a new two-socket, 2.6GHz Intel Xeon E5–2670 system. After looking at the published TPC-E results, the nearest match that you can find is a two-socket, 2.9GHz Intel Xeon E5–2690 system that has a tpsE score of 1863.23. After looking at other component-level benchmarks for CPU and memory performance, you might feel relatively safe reducing that score by about 10% to account for the clock speed difference on the same generation and family processor(with the same number of cores, cache sizes, and memory bandwidth), coming up with an adjusted score of about 1676 tpsE.
You want to compare the potential performance of this system to an older four-socket system that uses the 2.66GHz Intel Xeon X7460 processor, and you find a TPC-E benchmark for a similar system that has a score of 671.35 tpsE. Just looking at these raw scores, you could be relatively confident that you could replace the old four-socket system with that new two-socket system and see better performance with more scalability headroom. You should also drill into the actual TPC-E submissions to better understand the details of each system that was tested. For each tested system, you want to know things such as operating system version, SQL Server version, the amount of RAM in the database server, the initial database size, the type of storage, and the number of spindles. All of this gives you a better idea of the validity of the comparison between the two systems.
When assessing the relative OLTP performance of different processors, take the raw TPC-E tpsE score for a system using the processor and divide it by the number of physical cores in the system to get an idea of the relative “per physical core performance.” Using the preceding example, the proposed new two-socket Xeon E5–2670 system would have 16 physical cores. Taking your adjusted score of 1676 and dividing by 16 would give you a figure of 104.75. The old four-socket Xeon X7460 system has 24 physical cores, so taking the actual raw score of 671.35 and dividing it by 24 gives you a figure of 27.97, which is a pretty dramatic difference between the two processors for single-threaded OLTP performance.
Geekbench Benchmark
Geekbench is a cross-platform, synthetic benchmark tool from a company called Primate Labs. It offers a rather comprehensive set of benchmarks designed to measure the processor and memory performance of a system, whether it is a laptop or a multi-processor database server. There is no measurement of I/O performance in this benchmark. One convenient feature of Geekbench is that there are no configuration options to worry about. You simply install it and run it, and within about three minutes you will see the scores for the system you have tested. These are broken down into an overall Geekbench score and a number of scores for processor and memory performance. This is very useful for comparing the relative processor and memory performance of different processors and different model servers that may be configured in a variety of ways.
This test can be a very reliable and useful gauge of processor and memory performance. Thousands of Geekbench score reports have been submitted to the online Geekbench database, which is available at http://browser.primatelabs.com. It is highly likely that you can find a score in their database for nearly any processor or model server that you want to compare. This is very handy, especially if you don’t have a large dedicated testing lab with a lot of different model servers and processors.
For example, suppose you have an older Dell PowerEdge 2950 server with two Intel Xeon E5440 processors and 32GB of RAM. It turns out that a system like this has a Geekbench score of around 7950. You are trying to justify the purchase of a new Dell PowerEdge R720 server with two Intel Xeon E5–2690 processors and 128GB of RAM, and you discover a result in the online database that shows a Geekbench score of about 41,000. That’s a rather dramatic increase compared to a score of 7950. Using Geekbench scores in conjunction with TPC-E scores is a fairly reliable way to compare relative processor and memory performance, especially for OLTP workloads. Using these two benchmarks together is a very useful technique that will likely serve you well.
SUMMARY
As you go through the process of evaluating, selecting, sizing, and configuring your database hardware and storage subsystem, it is extremely important that you are familiar with the characteristics of the type(s) of workload that your system will be handling. Different types of workloads and mixed workloads place varying demands on your server hardware and storage subsystem. You need to take this into account early in the process, as it influences many of your decisions.
After considering your workload, you need to decide whether you want an Intel or an AMD-based database server, as that dictates which model servers from your selected system vendor are eligible for consideration. Unfortunately, given the relatively poor single-threaded performance and high physical core counts of the last two generations of AMD Opteron processors, it is very hard to justify their use with SQL Server 2012 Enterprise Edition, even after considering the SQL Server 2012 Core Factor Table license discounts. If AMD continues to be unable to compete in the high end of the market, it will reduce the incentives for Intel to maintain their aggressive product release cycle, and slow the pace of innovation. This will be bad for the IT industry in the long run.
After selecting your processor vendor, you need to decide whether your workload and volume requirements dictate the use of a one-, two-, four-, or eight-socket database server. With the latest generation of processors and improved memory and storage densities, many smaller SQL Server workloads may be able to run quite well on a single-socket database server.
Because processors have become much more powerful, and memory and storage density have improved over the past several years, it has become increasingly feasible to use two-socket servers for database usage. Intel continues to release newer-generation processors more quickly in the two-socket space, and the equivalent generation Intel two-socket processors have better single-threaded performance than their Intel four-socket counterparts. This means that you may be able to run a much higher percentage of SQL Server workloads on a two-socket server, rather than a four-socket server, and save a great deal of money in SQL Server license costs. Despite these improvements in the two-socket space, some workloads still require more resources than you can obtain from a two-socket server. If you need even more RAM, PCIe expansion slots, or total processor cores than you can get in a two-socket server, you have to make the jump to a four-socket or larger server.
With the new core-based licensing in SQL Server 2012 Enterprise Edition, you need to pay much closer attention to your physical core counts and the relative performance and scalability you get for each physical core. You are likely to be stuck with the processor(s) you choose for the lifetime of the server, which is probably several years, so choose wisely. Choosing wisely means getting the most performance and scalability with the lowest total physical core count in the server. Choosing poorly means getting less performance and scalability but paying the same or a higher total cost for your SQL Server licenses. Put some serious thought into your processor decision, using benchmark results to help justify it.
Because server RAM is relatively inexpensive, with costs continuing to decline, it makes sense to get a large amount of RAM, subject to any SQL Server license limits. Both SQL Server 2008 R2 Standard Edition and SQL Server 2012 Standard Edition have a license limit of 64GB. Physical RAM is an inexpensive, partial substitute for I/O capacity. If you have enough physical RAM that your entire database fits into memory, that’s an ideal situation. In many cases you may not have that luxury, but you should still try to get as much RAM as you can afford or as much as will fit in your server.
Finally, take advantage of the readily available component and application-level benchmarks to compare and evaluate different systems and components, rather than just guess. This approach will give you much more accurate estimates about different systems; and no matter what else you do, make an effort to learn more about hardware and stay current with new developments over time. This knowledge is critical to your career as a database professional.