
![]()
Exadata Smart Flash Cache
Oracle marketing must really like the term smart. They have applied it to numerous different features on the Exadata platform. They also seem to like the term flash, which is associated with at least a half dozen features as well. To add to the confusion, there are two features in Oracle Database 12c Release 1 that have almost exactly the same names—Database Smart Flash Cache (DBFC) and Exadata Smart Flash Cache (ESFC). While both features make use of flash-based memory devices, they are very different. In this chapter, we will focus on ESFC and the OLTP optimizations and only mention DBFC in passing.
One of the initial goals with Exadata V2, the first version to feature ESFC, was to expand Exadata’s capabilities to improve its performance with OLTP workloads. To accomplish this goal, ESFC was the key component that was added to the V2 configuration. Features based on the ESFC—such as the Exadata Smart Flash Logging (ESFL) and later Write-back Flash Cache (WBFC) as well as Flash Cache compression among others—were introduced with subsequent releases. Except for the step from V2 to X2, every new generation of Exadata hardware had more flash memory available. With the current hardware generation at the time of writing, the Exadata X5-2, you can have approximately 90TB of cache in a full rack with high-capacity storage servers. Flash Cache is handled slightly differently on the all-flash, X5-2 High Performance cells. You can read more about that later in the chapter. It is important to understand that this cache is managed by Oracle software, and the software is aware of how the data is being used by the databases that the storage layer is supporting. Oracle has been working on software for effectively managing database caches for over 30 years. Since the storage software knows what the database is asking for, it has a much better idea of what should and shouldn’t be cached than a conventional storage array.
DBFC VS. ESFC
DBFC and ESFC are two completely different things. DBFC is an extension of the buffer cache on the database server. It is a standard part of 11g and is implemented as a tier 2 buffer cache for an instance. It is only supported on Solaris and Oracle Linux. It is enabled by adding Flash disks (SSD) to a database server and telling a single instance to use it. If a user needs a block that is not in the buffer cache, it will look in the DBFC to see if it is there before requesting an I/O. When blocks are aged out of the buffer pool, they are moved to the DBFC instead of being simply flushed. ESFC is, of course, the disk cache on the Exadata storage servers. It caches data for all instances that access the storage cell.
Hardware
Describing hardware has been easier before the release current Exadata generation. Beginning with the V2 and up to, but not including the X5-2, every Exadata storage server can be described in the same way. Each cell has four PCI Express Cards for Smart Flash Cache plus 12 hard disks, regardless if it is a High Performance (HP) or High Capacity (HC) model. With the X5s, you need to distinguish between the HC and HP cells with regards to the number of Flash cards. The latter do not come with any hard disks, for the first time in the Exadata product history, but instead feature 8 of next generation PCIe cards for a raw capacity of 12.8TB per cell. Since the X5-2 High Performance Storage Servers do not have any hard disks for database storage, the Flash devices will be used to store database files persistently in addition to acting as a storage layer cache for the RDBMS layer I/O requests.
Each Exadata X5-2 High Capacity Storage Server has four Flash Accelerator PCIe Cards with 1.6TB raw capacity each, for a total of 6.4TB raw space per cell. Apart from the larger capacity of the Flash device used, the HC model follows the same design principles as earlier generations of the hardware.
Looking at the raw numbers of storage space per card, you need to know that these are the ones quoted in the specifications. The amount that is available for use is slightly less. The hardware design of the cards has changed over time, and the space permits us to discuss the X4 and X5 generation only in this chapter. Where applicable, references are made to the earlier hardware generations. For this chapter, the focus will be on the HC cell since this might be the more common of the two hardware choices.
Flash Memory in Exadata X4-2 Storage Servers
You have just read that the Flash Memory in both high-capacity and high-performance models of the X4-2 storage servers were identical: four cards in each. They are connected as PCI Express (version 2) expansion cards. The PCIe slots the cards sit in have eight lanes each. Oracle calls the Flash cards F80, or Sun Flash Accelerator F80 PCIe card to be more precise. The useable capacity is easy to remember at 800GB—,it is hinted at in the product name. Internally, the card is made up of four so-called Flash (memory) Modules or FMODs of 200 GB each. As a result of this, a single of the F80 cards presents itself to the operating system as four individual block devices. You can see this in the output of the lsscsi command, executed on an X4-2 cell:
[root@enkx4cel01 ~]# lsscsi
[0:0:0:0]    disk    ATA      2E256-TU2-510B00 UIO3  /dev/sda
[0:0:1:0]    disk    ATA      2E256-TU2-510B00 UIO3  /dev/sdb
[0:0:2:0]    disk    ATA      2E256-TU2-510B00 UIO3  /dev/sdc
[0:0:3:0]    disk    ATA      2E256-TU2-510B00 UIO3  /dev/sdd
[1:0:0:0]    disk    ATA      2E256-TU2-510B00 UIO3  /dev/sde
[1:0:1:0]    disk    ATA      2E256-TU2-510B00 UIO3  /dev/sdf
[1:0:2:0]    disk    ATA      2E256-TU2-510B00 UIO3  /dev/sdg
[1:0:3:0]    disk    ATA      2E256-TU2-510B00 UIO3  /dev/sdh
[2:0:0:0]    disk    ATA      2E256-TU2-510B00 UIO3  /dev/sdi
[2:0:1:0]    disk    ATA      2E256-TU2-510B00 UIO3  /dev/sdj
[2:0:2:0]    disk    ATA      2E256-TU2-510B00 UIO3  /dev/sdk
[2:0:3:0]    disk    ATA      2E256-TU2-510B00 UIO3  /dev/sdl
[3:0:0:0]    disk    ATA      2E256-TU2-510B00 UIO3  /dev/sdm
[3:0:1:0]    disk    ATA      2E256-TU2-510B00 UIO3  /dev/sdn
[3:0:2:0]    disk    ATA      2E256-TU2-510B00 UIO3  /dev/sdo
[3:0:3:0]    disk    ATA      2E256-TU2-510B00 UIO3  /dev/sdp
[4:0:20:0]   enclosu ORACLE   CONCORD14        0d03  -
[4:2:0:0]    disk    LSI      MR9261-8i        2.13  /dev/sdq
[4:2:1:0]    disk    LSI      MR9261-8i        2.13  /dev/sdr
[4:2:2:0]    disk    LSI      MR9261-8i        2.13  /dev/sds
[4:2:3:0]    disk    LSI      MR9261-8i        2.13  /dev/sdt
[4:2:4:0]    disk    LSI      MR9261-8i        2.13  /dev/sdu
[4:2:5:0]    disk    LSI      MR9261-8i        2.13  /dev/sdv
[4:2:6:0]    disk    LSI      MR9261-8i        2.13  /dev/sdw
[4:2:7:0]    disk    LSI      MR9261-8i        2.13  /dev/sdx
[4:2:8:0]    disk    LSI      MR9261-8i        2.13  /dev/sdy
[4:2:9:0]    disk    LSI      MR9261-8i        2.13  /dev/sdz
[4:2:10:0]   disk    LSI      MR9261-8i        2.13  /dev/sdaa
[4:2:11:0]   disk    LSI      MR9261-8i        2.13  /dev/sdab
[11:0:0:0]   disk    ORACLE   UNIGEN-UFD       PMAP  /dev/sdac
[root@enkx4cel01 ~]#
The first devices are the FMODs, four per card. The first card’s modules, for example, is addressed as 0:0:0:0 through 0:0:0:3. If you want all the glorious detail, you need to check the output of dmesg. A case-insensitive egrep for “sas|scsi” will show you how these devices show up during the boot phase under the mpt2sas kernel module (“Fusion MPT SAS Host”). This is matched by the output from cellcli:
CellCLI>  list physicaldisk attributes name,deviceName,diskType,makeModel -
> where deviceName like '/dev/sd[a-p]'

         FLASH_1_0         /dev/sdi         FlashDisk         "Sun Flash Accelerator F80 PCIe Card"
         FLASH_1_1         /dev/sdj         FlashDisk         "Sun Flash Accelerator F80 PCIe Card"
         FLASH_1_2         /dev/sdk         FlashDisk         "Sun Flash Accelerator F80 PCIe Card"
         FLASH_1_3         /dev/sdl         FlashDisk         "Sun Flash Accelerator F80 PCIe Card"
         FLASH_2_0         /dev/sdm         FlashDisk         "Sun Flash Accelerator F80 PCIe Card"
         FLASH_2_1         /dev/sdn         FlashDisk         "Sun Flash Accelerator F80 PCIe Card"
         FLASH_2_2         /dev/sdo         FlashDisk         "Sun Flash Accelerator F80 PCIe Card"
         FLASH_2_3         /dev/sdp         FlashDisk         "Sun Flash Accelerator F80 PCIe Card"
         FLASH_4_0         /dev/sde         FlashDisk         "Sun Flash Accelerator F80 PCIe Card"
         FLASH_4_1         /dev/sdf         FlashDisk         "Sun Flash Accelerator F80 PCIe Card"
         FLASH_4_2         /dev/sdg         FlashDisk         "Sun Flash Accelerator F80 PCIe Card"
         FLASH_4_3         /dev/sdh         FlashDisk         "Sun Flash Accelerator F80 PCIe Card"
         FLASH_5_0         /dev/sda         FlashDisk         "Sun Flash Accelerator F80 PCIe Card"
         FLASH_5_1         /dev/sdb         FlashDisk         "Sun Flash Accelerator F80 PCIe Card"
         FLASH_5_2         /dev/sdc         FlashDisk         "Sun Flash Accelerator F80 PCIe Card"
         FLASH_5_3         /dev/sdd         FlashDisk         "Sun Flash Accelerator F80 PCIe Card"
The cards are addressed by the kernel as regular block devices, just as spinning hard disks since the days of the IDE disks would be. They are visible, just like any other block device in Linux. In fact, the devices starting with /dev/sdq are regular, spinning hard disks. There is nothing wrong with that; it has been the standard way directly attached NAND Flash has been addressed in many devices until the introduction of the Non-Volatile Memory Host Controller Interface Specification (NVMHCI) or NVMe for short. You find these on the X5-2 storage servers you can read about in the next section.
Flash Memory in Exadata X5-2 Storage Servers
Every Exadata storage server up to the X5 featured the multi-FMOD Flash cards similar to the one shown in the section above. The capacity has, of course, been different, but the design of the card remained the same. The X5-2 is the first storage server generation that changes a few of these truths:
- The new Flash cards—F160— are not made up of multiple FMODs.
- The Flash cards are addressed differently by the operating system.
- You can choose to use an all-Flash model of the storage server.
When you check the output from the cellcli command on the X5-2 High Capacity cell you quickly realize that there is indeed just one “card,” no more modules:
CellCLI> list physicaldisk attributes name,deviceName,diskType,makeModel
   8:0             /dev/sda        HardDisk        "HGST    H7240AS60SUN4.0T"
   8:1             /dev/sdb        HardDisk        "HGST    H7240AS60SUN4.0T"
   8:2             /dev/sdc        HardDisk        "HGST    H7240AS60SUN4.0T"
   8:3             /dev/sdd        HardDisk        "HGST    H7240AS60SUN4.0T"
   8:4             /dev/sde        HardDisk        "HGST    H7240AS60SUN4.0T"
   8:5             /dev/sdf        HardDisk        "HGST    H7240AS60SUN4.0T"
   8:6             /dev/sdg        HardDisk        "HGST    H7240AS60SUN4.0T"
   8:7             /dev/sdh        HardDisk        "HGST    H7240AS60SUN4.0T"
   8:8             /dev/sdi        HardDisk        "HGST    H7240AS60SUN4.0T"
   8:9             /dev/sdj        HardDisk        "HGST    H7240AS60SUN4.0T"
   8:10            /dev/sdk        HardDisk        "HGST    H7240AS60SUN4.0T"
   8:11            /dev/sdl        HardDisk        "HGST    H7240AS60SUN4.0T"
   FLASH_1_1       /dev/nvme3n1    FlashDisk       "Oracle Flash Accelerator F160 PCIe Card"
   FLASH_2_1       /dev/nvme2n1    FlashDisk       "Oracle Flash Accelerator F160 PCIe Card"
   FLASH_4_1       /dev/nvme0n1    FlashDisk       "Oracle Flash Accelerator F160 PCIe Card"
   FLASH_5_1       /dev/nvme1n1    FlashDisk       "Oracle Flash Accelerator F160 PCIe Card"
If you look at the output carefully, you will undoubtedly notice that not only are there fewer Flash disks, but also their device names are quite different. This has to do with the new NVMHCI interface (NVMe, for short) these devices can use. For the longest time, high-performance Flash memory was addressed more or less in the same way as mechanical disk. With all the progress made with recent processor generations, this model of addressing Flash memory became increasingly outdated from a performance perspective, especially when connecting the storage device to the PCIe bus that has a very fast link with the processor itself. The most visible difference is the massively increased queue depth and increased number of interrupts that can be handled via NVMe devices. Just to prove the point, you will not see the NVMe devices listed under the lsscsi command output. So they truly represent the next generation of Flash memory in x86-64.
In addition, the F160 cards are true PCIe v3 cards, unlike the F80 that were PCIe v2 cards. The main difference is the increased bandwidth offered by PCIe v3, which almost doubled compared to the previous generation.
According to the documentation, the storage servers, theoretically, allow PCIe cards to be replaced while the system is running. However, the Oracle Exadata Storage Software User’s Guide and My Oracle Support note 1993842.1 recommend powering down the storage server before replacing one of these cards. Fortunately, you can accomplish this without experiencing an outage, as ASM redundancy allows entire storage cells to be offline without affecting the databases they are supporting. Note that replacing one of the Flash cards should not require any reconfiguration.
Flash Cache vs. Flash Disk
All of the Exadata storage servers, except for the X5-2 High Performance model, allow you to define how you want to use the Flash cards in the server. This section describes the non X5-2 High Performance cells—you can read more about the all-Flash or High Performance model later. On all the other (non-X5-2 High Performance) models, the Flash memory on the storage servers can be used in two ways. It can be configured as a disk cache (ESFC), or it can be carved up and presented as solid-state (grid) disks for use with ASM for database storage. These two modes are not mutually exclusive. The Flash memory can be allocated to either format in whatever percentages are desired. The recommended configuration is to use all the Flash memory as Flash Cache. This configuration significantly speeds up random access reads and, since Exadata version 11.2.3.3, this functionality extends to multi-block reads, too. Flash Cache can be used in two configurations: write-back and write-through, both of which will be described later in the chapter. For now, it suffices to say that the default mode of operation for ESFC is write-through.
In many systems, the approach of allocating all the available Flash memory as write-through cache works very well. However, for systems that are very write-intensive, starting with Exadata storage software version 11.2.3.2.1, it may be beneficial to change from write-through to Write-back Flash Cache (WBFC). Operating in write-back mode provides the ability to cache write I/Os to the Flash device in addition to the read IOs. Enabling this feature will give you far more write IOPS than the combined local hard disks can provide.
You can also use some of the Flash memory as a grid disk. Keep in mind that depending on the ASM redundancy level used (Normal or High), choosing this option will consume two or three times the amount of Flash storage that the objects actually occupy. This fact alone makes the option less palatable, especially on Exadata hardware that does not have the same abundance of Flash memory as the X4 and later generations. Also keep in mind that writes to data files are done in the background by the DBWR processes. So choosing to use part of the Flash-based storage as a grid disk may not provide as much benefit as you might have hoped for, especially since the introduction of WBFC. Fortunately, it is pretty easy to reallocate Flash storage, so testing your specific situation should not prove too difficult unless, of course, you do not have a dedicated test environment. However, since this chapter focuses on the Exadata Smart Flash Cache feature, we will only briefly cover using the F160s as grid disks outside the X5-2 High Performance model.
![]() Note A common misconception is that putting online redo logs on Flash storage will significantly speed up writes to redo logs and thus increase the throughput of high-transaction systems. We have come across this on Exadata systems, as well as on non-Exadata hardware. While it’s true that small random writes are faster on SSD-based storage than on traditional disks, writes to redo logs on high-transaction systems generally do not fall into that bucket and actually do not benefit that much from being stored on SSD storage. In fact, these writes should just go to the array’s cache and complete very quickly. In addition, SSD write mechanics can cause a lot of variability in individual write times. There may be individual writes that take orders of magnitude longer than the average, a fact known as write cliff. This can cause problems on very busy systems as well. To mitigate this problem, Oracle introduced Smart Flash Logging, which you will read about later.
Note A common misconception is that putting online redo logs on Flash storage will significantly speed up writes to redo logs and thus increase the throughput of high-transaction systems. We have come across this on Exadata systems, as well as on non-Exadata hardware. While it’s true that small random writes are faster on SSD-based storage than on traditional disks, writes to redo logs on high-transaction systems generally do not fall into that bucket and actually do not benefit that much from being stored on SSD storage. In fact, these writes should just go to the array’s cache and complete very quickly. In addition, SSD write mechanics can cause a lot of variability in individual write times. There may be individual writes that take orders of magnitude longer than the average, a fact known as write cliff. This can cause problems on very busy systems as well. To mitigate this problem, Oracle introduced Smart Flash Logging, which you will read about later.
The all-flash X5-2 High Performance cells differ from the High Capacity model. The most striking difference is the absence of mechanical, spinning disk. Each of the new cells has eight F160 cards. The F160 cards have 1.6TB capacity each for a total raw capacity of 12.8TB. In a full rack, this amounts to 179.2 TB, which is a little less capacity than the previous X4-2 High Performance cell. Although the individual disks in the X4-2 cell are smaller at 1.2TB vs. 1.6TB of the F160 card, the X4-2 cell has 12 hard disks (plus four F80 cards for caching) for approximately 200TB raw capacity on hard disk. Without spinning disk, you have no choice but to create grid disks for ASM on Flash memory. You might be asking yourself if the all-Flash cell has a cache as well and the answer is yes. When you receive shipment of the system, Oracle reserves 5% of the Flash devices for Smart Flash Cache for reasons described in the next section.
Using Flash Memory as Cache
A very simplified description of how a disk cache works goes something like this: When a read request comes in, the I/O subsystem checks the cache to see if the requested data exists in cache. If the data is in the cache, it is returned to the requesting process. If the requested data doesn’t reside in the cache, it is read from disk and returned to the requesting process. In the case of uncached data, the data is later copied to the cache (after it is returned to the requesting process). This is done to ensure that populating the cache doesn’t slow down I/O processing.
In most enterprise storage arrays, “the cache” is implemented in battery or otherwise protected DRAM, fronting the disks. On the Exadata platform, a different concept is implemented. Supplementing DRAM on the disk controller, Flash cards will act as cache—albeit a smart one. Figure 5-1 shows the I/O path of reads using Oracle’s ESFC.
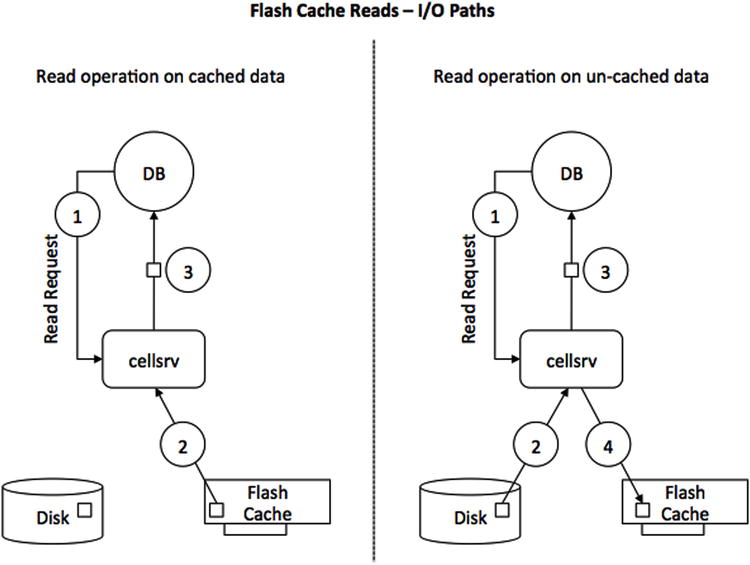
Figure 5-1. Conceptual model of read operation I/O path
When reading data from the persistency layer, the database session indicated as “DB” in Figure 5-1 issues a read operation, which ends up as a request in the multi-threaded cellsrv binary. Ignoring I/O resource management, offload servers, and the cell’s ability to read from a secondary mirror copy of the extent in case of read I/O outliers for the sake of simplicity, the cellsrv software knows where a given block is to be read—either from Flash or from spinning disk. Depending on the data location, a read is issued. The difference between the two scenarios shown in Figure 5-1 is the non-cached read. If a chunk of data is not found in Flash Cache, the read operation is issued against the hard disk where the data resides. If it makes sense to cache the data for further operations (maybe because it can be expected to be reused in a subsequent read), the chunk of data is moved into Flash Cache, but only after it has been sent back to the requesting session.
In an ideal situation where the majority of the segment to be scanned is in Flash Cache, you can see this reflected in the sometimes drastically reduced response time for single-block reads and table scans. Regarding scans, the speedup is not limited to Smart Scans by the way. If a segment is cached in ESFC, other I/O access methods that are not offloaded will benefit as well since Exadata version 11.2.3.3.
Writes are different from the situation just described. Consider Figure 5-2, which covers both operating modes of the Smart Flash Cache: the default write-through mode as well as the write-back mode.
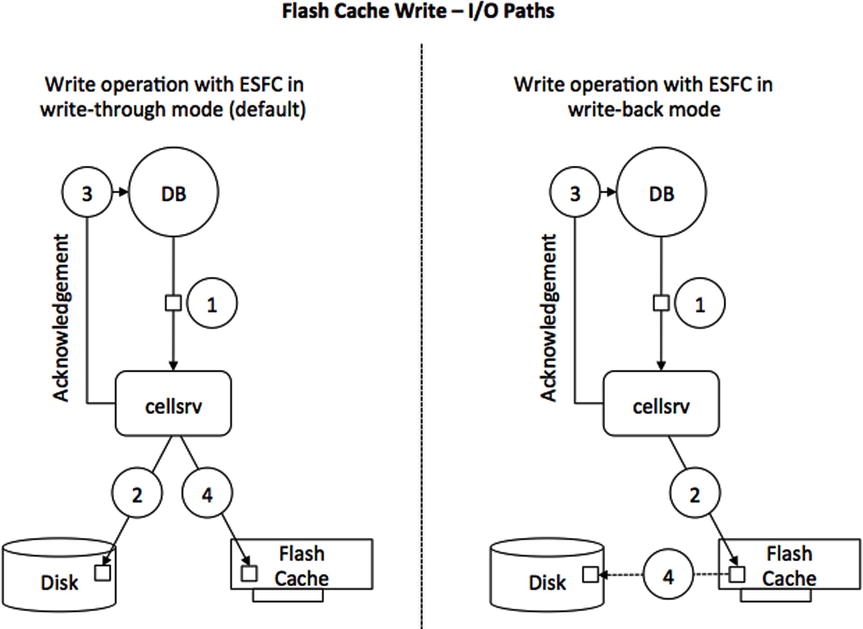
Figure 5-2. Conceptual model of write operation I/O path in write-though and write- back mode
![]() Note The X5-2 High Performance cell is different again: The default mode of operation for Flash Cache is write-back. Switching back to write-through is possible, but doing so means giving up on Fast Data File Creation, for example, as the feature requires WBFC to be enabled.
Note The X5-2 High Performance cell is different again: The default mode of operation for Flash Cache is write-back. Switching back to write-through is possible, but doing so means giving up on Fast Data File Creation, for example, as the feature requires WBFC to be enabled.
Assuming here that ESFC operates in the default write-through mode, writes bypass the (Flash) cache and go directly to disk. However, after sending an acknowledgement back to the database server, Oracle’s storage software then copies the data into the cache, assuming it is suitable for caching. This is a key point. The metadata that is sent with the write request lets the storage software know if the data is likely to be used again, and, if so, the data is also written to the cache. This step is done after sending an acknowledgement to the database tier in order to ensure that the write operation can complete as quickly as possible.
You can read more about the Write-back Flash Cache mode later in this section, but since it is such an important concept, the high-level steps are shown here nevertheless. When operating in write-back mode, all I/Os will go to the Flash devices first, and not to disk, at least initially. Think of the Flash Cache just as you would about the cache in an enterprise class storage array. If the Flash Cache is depleted, an algorithm will evaluate the contents and de-stage data from Flash Cache to disk. Another difference between write-through and write-back mode is that the contents of the cache is persistent across reboots. Since data may be on the Flash cards and not yet de-staged to disk, it needs to be protected from failure using ASM redundancy as well.
Beginning with Exadata software version 11.2.3.3.0, Oracle changed the way that data is scanned fundamentally. Up until then, there was a clear distinction between which component was responsible for what task. The split was as follows: The Smart Flash Cache was primarily used for single-block I/O. Smart Scans were satisfied from spinning disk. If you absolutely wanted to make use of Flash Cache for Smart Scans, you had to change the storage clause of the segment in question. The logic behind this is compelling: Different devices have different I/O queues in the operating system and, by separating single block I/O typical for OLTP applications from large, multi-block I/O operations, allowed the placement of applications with different I/O workload characteristics on the same Exadata hardware. Add in I/O Resource Manager and everyone has a well-behaved system. This worked especially well in the days of the V2 and X2, which both had very little Flash memory available compared to today’s X5 system. What capacity you had was in the majority of cases probably best used for OLTP workloads. You can see this in the AWR “Wait Event Histogram” for the event “cell single block physical read.” In the vast majority of cases. you should see an average wait around 1ms or less.
There is just one caveat with this: Hard-disk performance has not increased at the same speed as Flash performance, which are capable of thousands of IOPS per device with sustained throughput many times that of a hard disk. Since Flash memory is based on silicone and not magnetic recording, Flash memory undergoes much faster development cycles than hard disk, leading to faster, more resilient components that are smaller than their previous generation. In summary, Flash memory allows for larger and larger capacity, which is represented in the Exadata platform. The F160 card available in the X5 has twice the capacity of its predecessor. The amount of Flash in the X4 and X5 and to a lesser extent on the X3 now gives the architect more headroom to cache data even for full scans. All it required was a change in the cellsrv software, which arrived with 11.2.3.3.0.
As soon as you use this particular version (or a more recent release, of course), cellsrv will automatically cache popular data worth caching, full scans included. There is no change to the way small I/Os are cached as part of the new release. The main difference is that popular data can be cached and made available to Smart Scan in addition to the single block I/Os without having to change the default storage clause of a segment.
In the first edition of the book, we featured an example demonstrating how much faster a Smart Scan can be when it uses both disk and Flash Cache, but that required changing the storage clause of the segment to CELL_FLASH_CACHE KEEP. Since the default has changed, the demonstration has to change with it. In this example, it was necessary to explicitly forbid the use of Flash Cache for a table scan to show the difference. To this effect, two tables have been created, BIGT and BIGT_ESFC.
SQL> select table_name, num_rows, partitioned, compression, cell_flash_cache
  2  from tabs where table_name in ('BIGT','BIGT_ESFC'),

TABLE_NAME                       NUM_ROWS PAR COMPRESS CELL_FL
------------------------------ ---------- --- -------- -------
BIGT_ESFC                       100000000 NO  DISABLED DEFAULT
BIGT                            100000000 NO  DISABLED NONE

2 rows selected.

SQL> select segment_name, blocks, bytes/power(1024,3) g
  2  from user_segments where segment_name in ('BIGT','BIGT_ESFC'),

SEGMENT_NAME                       BLOCKS          G
------------------------------ ---------- ----------
BIGT                             16683456 127.284668
BIGT_ESFC                        16683456 127.284668

2 rows selected.
Table BIGT will act as the reference here; the first scan will make use of as little of ESFC as possible. Here is the result:
SQL> select /*+ gather_plan_statistics without_ESFC */ count(*) from bigt;

  COUNT(*)
----------
 100000000

Elapsed: 00:00:36.23
If you record the performance counters you have seen in a few places already (and can read more about in Chapter 11), you will find these interesting metrics:
STAT    cell IO uncompressed bytes                                         136,533,385,216
STAT    cell blocks helped by minscn optimization                               16,666,678
STAT    cell blocks processed by cache layer                                    16,666,678
STAT    cell blocks processed by data layer                                     16,666,673
STAT    cell blocks processed by txn layer                                      16,666,678
STAT    cell num smartio automem buffer allocation attempts                              1
STAT    cell physical IO bytes eligible for predicate offload              136,533,377,024
STAT    cell physical IO interconnect bytes                                  2,690,691,224
STAT    cell physical IO interconnect bytes returned by smart scan           2,690,650,264
STAT    cell scans                                                                       1
...
STAT    physical read IO requests                                                  130,346
STAT    physical read bytes                                                136,533,417,984
STAT    physical read total IO requests                                            130,346
STAT    physical read total bytes                                          136,533,417,984
STAT    physical read total multi block requests                                   130,340
STAT    physical reads                                                          16,666,677
STAT    physical reads cache                                                             5
STAT    physical reads direct                                                   16,666,672
Bear with us a minute—it will all become a lot clearer! After a few scans against the table with the default storage clause—all of them Smart Scans—Flash Caching becomes very apparent in the execution time:
SQL> select /*+ gather_plan_statistics with_ESFC */ count(*) from bigt_esfc;

  COUNT(*)
----------
 100000000

Elapsed: 00:00:13.23
This is a lot quicker than the 36 seconds in the non-cached table example, and the nice thing about this is that no developer or administrator had to do anything. The speedup is entirely due to the fact that Exadata decided that the object is popular and cached it. Looking at the performance counters again, you can see how many I/O operations were satisfied from Flash Cache:
STAT    cell IO uncompressed bytes                                         136,533,958,656
STAT    cell blocks helped by minscn optimization                               16,668,279
STAT    cell blocks processed by cache layer                                    16,668,279
STAT    cell blocks processed by data layer                                     16,666,743
STAT    cell blocks processed by txn layer                                      16,668,279
STAT    cell flash cache read hits                                                 113,612
STAT    cell num smartio automem buffer allocation attempts                              1
STAT    cell physical IO bytes eligible for predicate offload              136,533,377,024
STAT    cell physical IO interconnect bytes                                  2,690,662,344
STAT    cell physical IO interconnect bytes returned by smart scan           2,690,662,344
STAT    cell scans                                                                       1
...
STAT    physical read IO requests                                                  130,411
STAT    physical read bytes                                                136,533,377,024
STAT    physical read requests optimized                                           113,612
STAT    physical read total IO requests                                            130,411
STAT    physical read total bytes                                          136,533,377,024
STAT    physical read total bytes optimized                                118,944,309,248
STAT    physical read total multi block requests                                   130,343
STAT    physical reads                                                          16,666,672
STAT    physical reads direct                                                   16,666,672
If you compare both listings, you can see that the amount of work was almost exactly the same. The difference between the two listings can be found in the cell Flash Cache read hits and the “%physical read%optimized” statistics. Out of 130,411 I/O requests, 113,612 were optimized. The demonstration explicitly did not feature a WHERE clause to force full scans without further optimizations, such as predicate filtering or storage indexes to isolate the performance gain. Chapter 11 has a lot more information about all these counters, while Chapter 2 explains the different kinds of optimizations during a Smart Scan.
Mixed Workload and OLTP Optimizations
When the first version of the Exadata Database Machine—the so-called Exadata V1—debuted, it was very much a high performance solution to support Decision Support Systems. Flash memory, as you just read about, was absent from the very first hardware version. This has been discovered as a limitation so that the next hardware release, Exadata V2, was the first version to introduce the Flash cards. Thanks to the Flash cards and other features you read about in this book, Exadata can deliver high performance and scalability for many different types of workloads. These do not necessarily have to be uniform—the combination of high-end hardware and the optimizations found in the storage server software form a balanced combination. The key drivers for enabling OLTP workloads are the Exadata Storage Server Software and the ESFC Flash memory. Once the hardware specification is in place, the components can be put to good use. In the case of Exadata, new functionality is constantly added to the storage server software. One important OLTP optimization introduced in version 11.2.2.4.x is named Smart Flash Log.
Using Flash Memory for Database Logging
The aim of the Exadata Smart Flash Log (ESFL) is to optimize database log writes. Many DBAs with a background of managing OLTP-style applications know only too well that a low log write latency is critical. A small “hiccup” in latency can greatly impact the overall performance of an OLTP environment. Smart Flash Logging helps eliminating high-latency outliers by making use of both on-disk redo logs and a small space that is allocated on the Flash hardware for ESFC, called Flashlog. Ideally, the sequential redo log writes should all go to the disk controller’s cache. Non-Exadata environments frequently use enterprise-class arrays that are fronted by more or less gracious amounts of DRAM to cache writes before they are eventually de-staged to disk. To avoid data corruption in case of power failure, these caches are backed-up by batteries or more recently, super-capacitors.
The Exadata Database Machine does not have the same amount of cache on the controller. Up to the X5-2, every disk controller had 512MB of cache, while the X5-2 has 1GB. As long as the cache is not filled up to capacity, write I/O should be able to benefit from it. In some situations, however, it is possible to deplete the cache, causing future I/O requests to pass straight through to the attached disks. This can also happen in all Exadata generations with battery-backed caches when the batteries go into a learning cycle. Long story short, it is possible that the write-back cache in the disk controllers falls back to write-through mode, which can have performance implications for (redo) writes. Smart Flash Logging is a technology developed by Oracle to counter the negative side effect of this by making the Flash cards available as alternative targets for redo log writes.
Smart Flash Logging requires Exadata Storage Software version 11.2.2.4 or later, and Oracle Database version 11.2.0.2 with Bundle Patch 11. For Oracle Database version 11.2.0.3, you need Bundle Patch 1, or a later one. The Flash Logging feature is not intrusive, even on systems with less Flash memory. On each cell, 512MB will be set aside for the temporary storage location for redo.
The Smart Flash Logging feature works as shown in Figure 5-3. When the database issues a redo log write request, the cellsrv software will issue the write in parallel to both the on-disk redo log and ESFL. As soon as the first write completes, cellsrv will send the write acknowledgement to the requesting process and the database will continue processing further transactions. In the cases where the disk controller cache is not saturated, writes to hard disk should be faster than writes to the Flash Log.
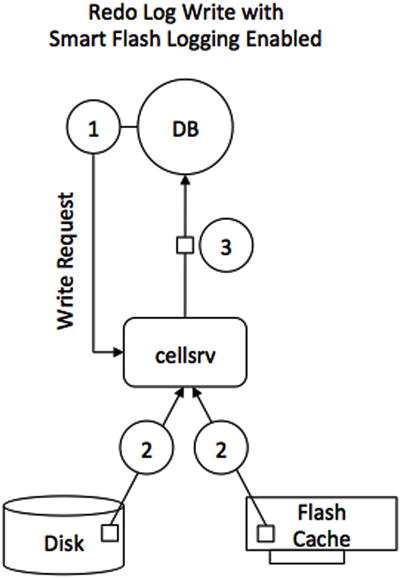
Figure 5-3. The I/O path for redo writes with Smart Flash Log
Thanks to the Exadata instrumentation, you can see exactly how the Flash Log was used (or not). The method to learn about the Flash Log usage is to request that information from each cell, ideally via dcli:
[oracle@enkdb03 ~]$ dcli -l cellmonitor -g ./cell_group
> cellcli -e "list metriccurrent where name like 'FL_.*_FIRST'"
enkcel04: FL_DISK_FIRST          FLASHLOG         10,441,253 IO requests
enkcel04: FL_FLASH_FIRST         FLASHLOG               426,834 IO requests
enkcel05: FL_DISK_FIRST          FLASHLOG         11,127,644 IO requests
enkcel05: FL_FLASH_FIRST         FLASHLOG            466,456 IO requests
enkcel06: FL_DISK_FIRST          FLASHLOG         11,376,268 IO requests
enkcel06: FL_FLASH_FIRST         FLASHLOG            456,559 IO requests
This is best demonstrated with an example. Figure 5-4 shows the redo log write latency before and after implementing ESFL. The data points on the graph shows 2 a.m. and 7 a.m. workload periods of one insert statement.
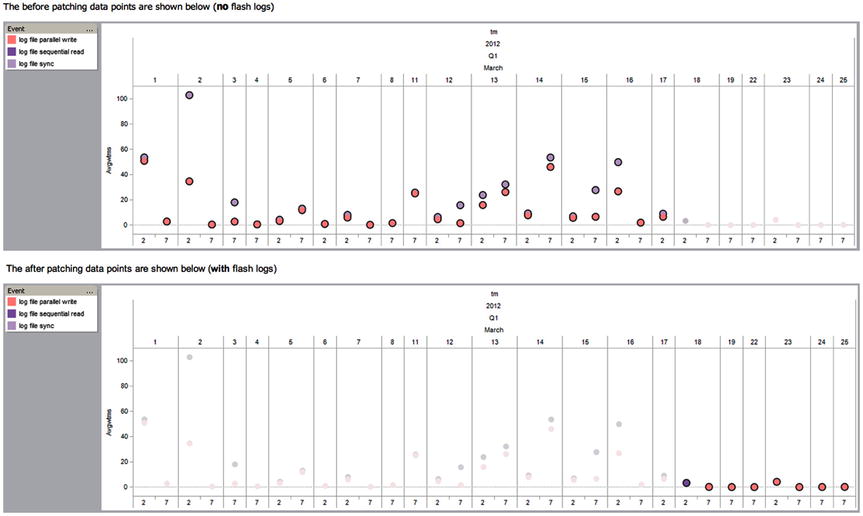
Figure 5-4. Redo Log write latency before and after implementing Exadata Smart Flash Logging
As you can see, the log-writer-related data points are much more in line with what you would expect. The comforting news here is that the vast majority—if not all Exadata systems—should be using Smart Flash Logging by the time this book is in print. The Smart Flash Log has removed one of the arguments for supporters of Flash used as Grid Disks for redo, allowing you to use Flash for the really important things instead. The next myth to address is that Exadata “is slow for writes.” Configured correctly, it most likely is not slow, as you can read in the next section.
Using Flash Memory to Accelerate Writes
So far, this chapter has focused primarily on the default mode of operation for the Smart Flash Cache: write-through (except again, the X5-2 High Performance cell where write-back caching is the default). The cache can optionally be configured to operate in write-back mode. The Write-Back Flash Cache (WBFC) significantly increases the write IOPS capability of your current Exadata configuration. This OLTP optimization feature initially introduced in Exadata’s X3 generation is backward compatible to previous generations of the Exadata Database Machine. The WBFC serves as the primary device for all write I/O requests from the database, and the cache contents are now persistent across restarts. The failure of a Flash card device is transparent to the users, as this will be automatically handled by the combination of ASM redundancy and Exadata Storage Software.
The Exadata Storage Software Version 11.2.3.2.1 is the minimum required version to enable the WBFC. My Oracle Support note 888828.1 lists further requirements for the Grid Infrastructure home and the RDBMS home. Make sure to apply these patches if you need them! Figure 5-5 and the following steps show how the WBFC works.
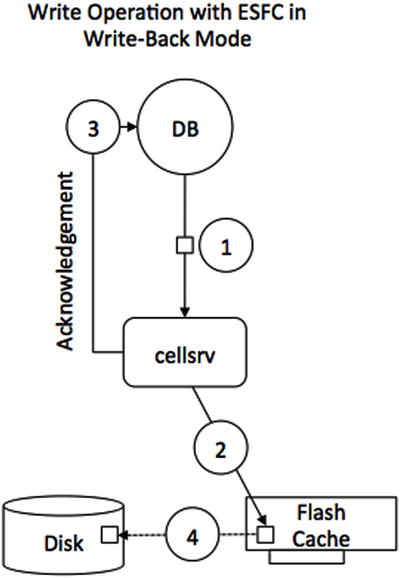
Figure 5-5. Schematic display of the use of Flash Cache in write-back mode
The sequence of steps as shown in Figure 5-5 is as follows:
- When the database issues a write request, the cellsrv will send the write I/O directly to the Flash device (numbers 1 and 2).
- Once the write completes, the database will immediately acknowledge the write (number 3).
- All of the dirty blocks will be kept in the cache, which could be used for future read or write I/O. ASM provides redundancy for the Flash cards to protect the system from failure.
- Once the block is no longer being accessed, it will eventually be aged out of the cache and written to the disk if space pressure arises (number 4). This process is generally referred to as de-staging data from cache to disk.
In order to assess the usefulness of Write-Back Flash Cache, you need to define a write-heavy I/O benchmark. The Swingbench suite is best known for the order entry benchmark. There are many more benchmarks provided in the suite worth exploring. After some more investigation, a suitable test case for this demonstration was found in the form of the stress test. The stress test is a relatively simple benchmark where four different potential transactions are launched against a table, aptly named STRESSTESTTABLE. The transactions unsurprisingly cover inserts, delete, updates, and selects. As it is typical for Swingbench, you can define each transaction’s contribution to the load individually. If you would like to follow the testing, we defined 15% of all transactions to be inserts, 10% selects, 55% updates, and 20% deletes. As with all storage benchmarks, you need a reasonably small buffer cache to mitigate the effects of Oracle’s excellent caching mechanism.
To see the benefit of what the Exadata system—in this particular case our X2-2 quarter rack—is capable of, you need to work out what the system is theoretically able to achieve. In this case, the data sheet for the X2-2 quarter rack quotes about 6,000 disk IOPS. If the benchmark, which is not RAC-optimized, can drive more than that, we can conclude that the Write-Back Flash Cache has helped. This could indeed be confirmed after executing the benchmark. Here is the I/O profile taken from the AWR report covering the benchmark’s execution. The test has been conducted on a single instance of a 12.1.0.2 database using the 12.1.2.1.0 Exadata software on the X2-2 quarter rack.
IO Profile                  Read+Write/Second     Read/Second    Write/Second
~~~~~~~~~~                  ----------------- --------------- ---------------
            Total Requests:          22,376.6        11,088.3        11,288.3
         Database Requests:          20,799.2        11,083.9         9,715.4
        Optimized Requests:          20,684.8        11,023.8         9,661.0
             Redo Requests:           1,570.1             0.0         1,570.1
                Total (MB):             219.5            86.7           132.7
             Database (MB):             194.2            86.7           107.5
      Optimized Total (MB):             187.2            86.2           101.1
                 Redo (MB):              18.4             0.0            18.4
         Database (blocks):          24,853.6        11,094.4        13,759.3
 Via Buffer Cache (blocks):          24,844.1        11,094.3        13,749.7
           Direct (blocks):               9.5             0.0             9.5
As you can see, the AWR report recorded 22,376 I/O operations per second in the “total requests” category driven by a single database instance, without even optimizing the workload for use with multi-instance RAC. This is more than the data sheet quoted. Had we invested more time in tuning the benchmark, we are confident that we could have been able to create more load. Please remember from the introduction, though, that the ratio of reads to writes in this particular benchmark is 10:90, which is not necessarily your I/O distribution! The fact that there are so many reads in the I/O profile has to do with the way the update statement is performed by means of an index unique scan on the table’s primary key. Later in the chapter, you can read more about monitoring the use of Flash Cache, and you will see that the STRESSTESTTABLE and its associated indexes are the most heavily cached objects in the Flash Cache.
Miscellaneous Other WBFC-related Optimizations
Separate space for a cache offers other benefits as well, which is the reason you still get a cache by default even on the all-Flash High Performance X5-2 cell servers. On these cells on the X5-2, the Flash Cache is set up as WBFC and it occupies about 5% of the available Flash space. One of the benefits is the advantage of Fast Data File Creation. Here is an example of the creation of a 20GB tablespace. In non-Exadata systems, your session will have to perform the data file initialization in a single thread, and that thread is at the mercy of the I/O subsystem. On Exadata, the operation is parallelized by design across all storage servers. Fast Data File Creation takes this process a step further. Using it, only the metadata about the blocks allocated in the tablespace is persisted in the Write-Back Flash Cache, the actual formatting does not take place immediately.
SQL> create tablespace testdata datafile size 20g;

Tablespace created.

Elapsed: 00:00:00.89
The elapsed time is not too bad for the creation of a 20GB data file. The session-level statistics “cell physical write bytes saved by smart file initialization” and “physical write total bytes” give you an idea about the saving you made. This feature was delivered as part of Exadata version 11.2.3.3.0.
Another interesting feature pertaining to the Write-Back Flash Cache is the ability of the storage cell to cap write-I/O outliers. According to the documentation set, write outliers caused by aging or dying Flash cards can cause slower I/O response times and can be redirected to a different card instead. You benefit from this feature with Exadata software 12.1.2.1.0 and 11.2.0.4 BP 8 or later.
How ESFC and ESFL Are Created
The Exadata Smart Flash Cache is created and managed using the cellcli utility on each storage server. This section merely features an example for the use of the cellcli command to manage Smart Flash Cache and Smart Flash Log. If you would like to learn more about these commands, please refer to Appendix A. Instead of executing cellcli commands locally on each cell, you can make use of the dcli utility, which executes commands across multiple systems (and does a lot more).
When working with the Flash disks on the storage servers, it is important to execute the commands in sequence. You start by creating the Flash Log before Flash Cache (and most Exadata users would stop there). The first example, therefore, shows you how to configure Exadata Smart Flash Log. You create it using the CREATE FLASHLOG ALL command, as shown here:
[root@enkx3cel01 ~]# cellcli -e create flashlog all
Flash log enkx3cel01_FLASHLOG successfully created
[root@enkx3cel01 ~]# cellcli -e list flashlog attributes name,size
         enkx3cel01_FLASHLOG     512M
The previous command automatically allocates 512MB of storage from the Exadata Flash, leaving the rest of the available space to ESFC. Remember that ESFL has to be created before ESFC or else the Flash space will only be allocated to ESFC leaving no space for the Flash Log.
The next step is to create the Flash Cache using the CREATE FLASHCACHE command. Here is the example for the default write-through-mode on an X3-2 storage server:
CellCLI> create flashcache all

Flash cache enkx3cel01_FLASHCACHE successfully created
This form of the command instructs the storage software to spread the cache across all the FMods on all the Flash cards. If you really, really need it and want to ignore the advice given in MOS note 1269706.1, you can specify a size instead of “all” to leave some space on the Flash cards available for use as a Flash disk. Note that the Flash Cache is automatically assigned a name that includes the name of the storage cell. To see the size of the Flash Cache, you can issue the LIST FLASHCACHE DETAIL command, shown here on the X3-2 cell. Remember from the introduction that the current Exadata X5-2 generation has fewer FMODs and significantly larger Flash disks. The output is reformatted for better readability. in your terminal session you will see all the Flash disks (FD) in one line:
[root@enkx3cel01 ~]# cellcli -e list flashcache detail
         name:                   enkx3cel01_FLASHCACHE
         cellDisk:               FD_13_enkx3cel01,FD_14_enkx3cel01,FD_12_enkx3cel01,
                                 FD_03_enkx3cel01,FD_09_enkx3cel01,FD_15_enkx3cel01,
                                 FD_11_enkx3cel01,FD_05_enkx3cel01,FD_08_enkx3cel01,
                                 FD_02_enkx3cel01,FD_04_enkx3cel01,FD_06_enkx3cel01,
                                 FD_10_enkx3cel01,FD_00_enkx3cel01,FD_01_enkx3cel01,
                                 FD_07_enkx3cel01
         creationTime:           2014-01-30T22:21:18-06:00
         degradedCelldisks:
         effectiveCacheSize:     1488.75G
         id:                     15b9e304-586c-4730-910f-0e16de67f751
         size:                   1488.75G
         status:                 normal
Up to the X5-2 storage server, the Flash Cache is spread across 16 cell disks. A cell disk exists for each FMod on each Flash card. To get more information about the cell disks that make up the Flash Cache, you can use the LIST CELLDISK command, shown here for an X3-2 system:
[root@enkx3cel01 ~]# cellcli -e list celldisk attributes name,
> diskType, size where name like 'FD.*'
         FD_00_enkx3cel01        FlashDisk       93.125G
         FD_01_enkx3cel01        FlashDisk       93.125G
         FD_02_enkx3cel01        FlashDisk       93.125G
         FD_03_enkx3cel01        FlashDisk       93.125G
         FD_04_enkx3cel01        FlashDisk       93.125G
         FD_05_enkx3cel01        FlashDisk       93.125G
         FD_06_enkx3cel01        FlashDisk       93.125G
         FD_07_enkx3cel01        FlashDisk       93.125G
         FD_08_enkx3cel01        FlashDisk       93.125G
         FD_09_enkx3cel01        FlashDisk       93.125G
         FD_10_enkx3cel01        FlashDisk       93.125G
         FD_11_enkx3cel01        FlashDisk       93.125G
         FD_12_enkx3cel01        FlashDisk       93.125G
         FD_13_enkx3cel01        FlashDisk       93.125G
         FD_14_enkx3cel01        FlashDisk       93.125G
         FD_15_enkx3cel01        FlashDisk       93.125G
Since the Flash Cache is created on cell disks, the cell disks must be created before the Flash Cache, which they usually have during the initial configuration. If not, this can be done with the CREATE CELLDISK command:
CellCLI> create celldisk all flashdisk
CellDisk FD_00_enkx3cel01 successfully created
CellDisk FD_01_enkx3cel01 successfully created
CellDisk FD_02_enkx3cel01 successfully created
CellDisk FD_03_enkx3cel01 successfully created
CellDisk FD_04_enkx3cel01 successfully created
CellDisk FD_05_enkx3cel01 successfully created
CellDisk FD_06_enkx3cel01 successfully created
CellDisk FD_07_enkx3cel01 successfully created
CellDisk FD_08_enkx3cel01 successfully created
CellDisk FD_09_enkx3cel01 successfully created
CellDisk FD_10_enkx3cel01 successfully created
CellDisk FD_11_enkx3cel01 successfully created
CellDisk FD_12_enkx3cel01 successfully created
CellDisk FD_13_enkx3cel01 successfully created
CellDisk FD_14_enkx3cel01 successfully created
CellDisk FD_15_enkx3cel01 successfully created
You can also create a Flash Cache on a limited set of FMods by specifying a specific list of cell disks. In most cases, this is not necessary, but it is possible. With only a single FMod per Flash card, this is less practical with the X5-2. Here is an example, still on the X3-2:
CellCLI> create flashcache celldisk='FD_00_enkx3cel01, FD_01_enkx3cel01', size=40G
Flash cache enkx3cel01_FLASHCACHE successfully created

CellCLI> list flashcache detail
         name:                   enkx3cel01_FLASHCACHE
         cellDisk:               FD_01_enkx3cel01,FD_00_enkx3cel01
         creationTime:           2014-11-09T15:29:28-06:00
         degradedCelldisks:
         effectiveCacheSize:     40G
         id:                     ad56aa9d-0de4-4713-85f2-19713a13vn3ebb
         size:                   40G
         status:                 normal
Once again, using cellcli is covered in more detail in Appendix A, but this section should give you a basic understanding of how the Flash Cache is created.
Enabling the Write-back Flash Cache
The Write-back Flash Cache (WBFC) is usually enabled in situations where during the average representative workload, the ratio of reads to writes tips in favor of writes. Traditionally, one would assume a workload where the number of reads has the edge over the number of writes. Another reason to enable WBFC is when you find “free buffer waits” take up a significant percentage of your wait events. Finding the event in your AWR reports or traces indicates that (one of the) database writer processes cannot keep up writing dirty blocks to disk in order to free new buffers being read into the buffer cache.
It is probably safe to say that most users operate Smart Flash Cache in the default write-through mode. Changing from write-through to write-back involves the steps explained in this section (that is, unless you are on the all-Flash cells—known as the X5-2 High Performance storage server—where write-back is already enabled by default). You can either perform the switch in a rolling or a non-rolling fashion. As a prerequisite, you have to ensure that all grid disks in the cluster are online and available:
[root@enkx3db01 ~]# dcli -g cell_group -l root cellcli -e list griddisk attributes
> asmdeactivationoutcome, asmmodestatus, name, status
The following listings show the steps executed in order to enable the WBFC in a rolling fashion. After the first command verifying the disks on the cluster returned no problems, you should proceed by checking the status of the existing Flash Cache and Flash Log as shown. The status must not indicate any problems:
[root@enkx3db01 ~]# dcli -g ./cell_group -l root
> cellcli -e list flashcache attributes name,size,status
enkx3cel01: enkx3cel01_FLASHCACHE      1488.75G        normal
enkx3cel02: enkx3cel02_FLASHCACHE      1488.75G        normal
enkx3cel03: enkx3cel03_FLASHCACHE      1488.75G        normal

[root@enkx3db01 ~]# dcli -g ./cell_group -l root
> cellcli -e list flashlog attributes name,size,status
enkx3cel01: enkx3cel01_FLASHLOG        512M    normal
enkx3cel02: enkx3cel02_FLASHLOG        512M    normal
enkx3cel03: enkx3cel03_FLASHLOG        512M    normal
In the following example, the Smart Flash Cache is changed from write-through to write-back mode. Here is proof that the Flash Cache is in write-through mode:
[root@enkx3db01 ~]# dcli -g cell_group -l root
> "cellcli -e list cell detail" | grep "flashCacheMode"
enkx3cel01: flashCacheMode:            WriteThrough
enkx3cel02: flashCacheMode:            WriteThrough
enkx3cel03: flashCacheMode:            WriteThrough
Next ,you need to drop the Flash Cache, connected as root to the first cell:
[root@enkx3cel01 ~]# cellcli -e drop flashcache
Flash cache enkx3cel01_FLASHCACHE successfully dropped
As part of the operation, ASM should stay up, tolerating the loss of the cell, thanks to the ASM normal or even high-redundancy configuration. The output of the next listing should show YES for all the disks. To keep the chapter reasonably short, the output is truncated:
[root@enkx3cel01 ~]# cellcli -e list griddisk attributes name,asmmodestatus,asmdeactivationoutcome
         DATA_CD_00_enkx3cel01           ONLINE  Yes
   ...
         DATA_CD_11_enkx3cel01           ONLINE  Yes
         DBFS_DG_CD_02_enkx3cel01        ONLINE  Yes
   ...
         DBFS_DG_CD_11_enkx3cel01        ONLINE  Yes
         RECO_CD_00_enkx3cel01           ONLINE  Yes
   ...
         RECO_CD_11_enkx3cel01           ONLINE  Yes
Following the verification, you change the grid disks to become inactive on the cell. Again, the output is abridged for readability, and you will see one line per grid disk:
[root@enkx3cel01 ~]# cellcli -e alter griddisk all inactive
GridDisk DATA_CD_00_enkx3cel01 successfully altered
...
GridDisk DATA_CD_11_enkx3cel01 successfully altered
GridDisk DBFS_DG_CD_02_enkx3cel01 successfully altered
...
GridDisk DBFS_DG_CD_11_enkx3cel01 successfully altered
GridDisk RECO_CD_00_enkx3cel01 successfully altered
...
GridDisk RECO_CD_11_enkx3cel01 successfully altered
Now there are not too many steps remaining on the cell. In summary, you shut down the cellsrv process, drop the Flash Cache, set the flashCacheMode attribute to “WriteBack,” create the Flash Cache, and bring everything back online. But, first, let’s verify that the Flash Cache is really gone, using another session with a root connection on the first node in RDBMS cluster:
[root@enkx3db01 ~]# dcli -g ./cell_group -l root
> cellcli -e list flashcache attributes name,size,status
enkx3cel02: enkx3cel02_FLASHCACHE      1488.75G        normal
enkx3cel02: enkx3cel03_FLASHCACHE      1488.75G        normal
And indeed, the first cell does not report the presence of Smart Flash Cache. The Flash Log remains unaffected, as you can see here:
[root@enkx3db01 ~]# dcli -g ./cell_group -l root
> cellcli -e list flashlog attributes name,size,status
enkx3cel01: enkx3cel01_FLASHLOG        512M    normal
enkx3cel02: enkx3cel02_FLASHLOG        512M    normal
enkx3cel03: enkx3cel03_FLASHLOG        512M    normal
At this stage, you shut down the cell software and change the attribute to enable write-back caching before starting the service again:
[root@enkx3cel01 ~]# cellcli -e alter cell shutdown services cellsrv

Stopping CELLSRV services...
The SHUTDOWN of CELLSRV services was successful.

[root@enkx3cel01 ~]# cellcli -e alter cell flashCacheMode=WriteBack
Cell enkx3cel01 successfully altered

[root@enkx3cel01 ~]# cellcli -e alter cell startup services cellsrv

Starting CELLSRV services...
The STARTUP of CELLSRV services was successful.
Following the successful start of the cellsrv daemons, you bring the grid disks back into ASM:
[root@enkx3cel01 ~]# cellcli -e alter griddisk all active
GridDisk DATA_CD_00_enkx3cel01 successfully altered
...
GridDisk DATA_CD_11_enkx3cel01 successfully altered
GridDisk DBFS_DG_CD_02_enkx3cel01 successfully altered
...
GridDisk DBFS_DG_CD_11_enkx3cel01 successfully altered
GridDisk RECO_CD_00_enkx3cel01 successfully altered
...
GridDisk RECO_CD_11_enkx3cel01 successfully altered
This is not an instantaneous operation—you have to be patient for a little while and wait for the status to become ONLINE for every single grid disk. Do not proceed until every single disk is online. Here is some sample output from grid disks that are still being brought back into online state:
[root@enkx3cel01 ~]# cellcli -e list griddisk attributes name, asmmodestatus
         DATA_CD_00_enkx3cel01           SYNCING
         DATA_CD_01_enkx3cel01           SYNCING
         DATA_CD_02_enkx3cel01           SYNCING
         DATA_CD_03_enkx3cel01           SYNCING
         DATA_CD_04_enkx3cel01           SYNCING
         DATA_CD_05_enkx3cel01           SYNCING
         DATA_CD_06_enkx3cel01           SYNCING
         DATA_CD_07_enkx3cel01           SYNCING
         DATA_CD_08_enkx3cel01           SYNCING
         DATA_CD_09_enkx3cel01           SYNCING
         DATA_CD_10_enkx3cel01           SYNCING
         DATA_CD_11_enkx3cel01           SYNCING
         DBFS_DG_CD_02_enkx3cel01        ONLINE
         ...
         RECO_CD_11_enkx3cel01           ONLINE
After the disks are all back ONLINE, you can re-create the Flash Cache on the cell:
[root@enkx3cel01 ~]# cellcli -e create flashcache all
Flash cache enkx3cel01_FLASHCACHE successfully created
The result of the hard work is cell using Write-Back Flash Cache:
[root@enkx3db01 ~]# dcli -g cell_group -l root
> "cellcli -e list cell detail" | grep "flashCacheMode"
enkx3cel01: flashCacheMode:            WriteBack
enkx3cel02: flashCacheMode:            WriteThrough
enkx3cel03: flashCacheMode:            WriteThrough
Unfortunately, you are not done yet—you have to repeat the above steps on the next Exadata storage cell node. Before taking additional cells down, however, you must be sure that this will not have an impact on the database availability. Use the command you saw in the introduction to this section listing the grid disks and ensure that the attributes asmmodestatus and asmdeactivationoutcome allow you to change the grid disk status to inactive in preparation to dropping the cell’s Flash Cache. This procedure might change for future releases so please ensure you check on My Oracle Support for the latest documentation.
![]() Note It is, of course, possible to revert back from write-back to write-through. My Oracle Support note 1500257.1 explains how to perform these steps.
Note It is, of course, possible to revert back from write-back to write-through. My Oracle Support note 1500257.1 explains how to perform these steps.
Flash Cache Compression
The Oracle Exadata software 11.2.3.3.0 was the first to introduce Flash Cache compression. The F40 and F80 cards found in Exadata X3 and X4 storage cells have a built-in compression engine that allows user data to be compressed when being written into Flash Cache. Since the compression technology is built into the card’s hardware, there should be less overhead associated with it compared to a software solution.
As with any compression technology, the savings are dependent on the data you want to compress. The worst compression ratio will likely be achieved with HCC Compression Units (CUs). Since these contain already compressed information, there is very little left to be squeezed out of them. Likewise, OLTP (now called “advanced”) compressed blocks are not the best candidates for compression if they are already in a state where most of the block is de-duplicated. On the other hand, uncompressed blocks are good candidates for compression.
At the time of writing, My Oracle Support note 1664257.1 “EXADATA Flash Cache Compression - FAQ” states that only the F40 and F80 cards can use the compression feature and, as a prerequisite, the Advanced Compression Option must be licensed. The F160 cards in the X5-2 do not support the Flash Compression as described in this section. You should consult this note to make sure your patch levels match the minimum required. The procedure to enable Flash Cache compression is similar to enabling Write-back Flash Cache just described. In order not to repeat ourselves, we would like to refer you to the My Oracle Support note for the procedure.
When you enabled Flash Cache Compression, your Flash Cache will be reported as a lot larger than the physical device. Consider the Flash Cache on the X4-2 storage server with compression enabled:
[root@enkx4cel01 ~]# cellcli -e list flashcache detail
         name:                       enkx4cel01_FLASHCACHE
         cellDisk:                   FD_04_enkx4cel01,FD_06_enkx4cel01,FD_11_enkx4cel01,
                                     FD_02_enkx4cel01,FD_13_enkx4cel01,FD_12_enkx4cel01,
                                     FD_00_enkx4cel01,FD_14_enkx4cel01,FD_03_enkx4cel01,
                                     FD_09_enkx4cel01,FD_10_enkx4cel01,FD_15_enkx4cel01,
                                     FD_08_enkx4cel01,FD_07_enkx4cel01,FD_01_enkx4cel01,
                                     FD_05_enkx4cel01
         creationTime:               2015-01-19T21:33:37-06:00
         degradedCelldisks:
         effectiveCacheSize:         5.8193359375T
         id:                         3d415a32-f404-4a27-b9f2-f6a0ace2cee2
         size:                       5.8193359375T
         status:                     normal
With a very keen eye, you will see that the size of the Flash Cache is 5.8TB. This is the logical cache size since the X4-2 storage server has four Flash cards of 800 GB size each for a total of 3.2 TB. In order to get these numbers, you must have Flash Cache compression enabled:
CellCLI> list cell attributes FlashCacheCompress
         TRUE
In normal circumstances, the cell disks on Flash are 186GB each, but with compression enabled will report more. This space is virtual, and Oracle manages space in the Flash Cache internally:
CellCLI> list celldisk attributes name,diskType,freeSpace,size,status where name like 'FD.*'
         FD_00_enkx4cel01         FlashDisk         0         372.515625G         normal
         FD_01_enkx4cel01         FlashDisk         0         372.515625G         normal
         FD_02_enkx4cel01         FlashDisk         0         372.515625G         normal
         FD_03_enkx4cel01         FlashDisk         0         372.515625G         normal
         FD_04_enkx4cel01         FlashDisk         0         372.515625G         normal
         FD_05_enkx4cel01         FlashDisk         0         372.515625G         normal
         FD_06_enkx4cel01         FlashDisk         0         372.515625G         normal
         FD_07_enkx4cel01         FlashDisk         0         372.515625G         normal
         FD_08_enkx4cel01         FlashDisk         0         372.515625G         normal
         FD_09_enkx4cel01         FlashDisk         0         372.515625G         normal
         FD_10_enkx4cel01         FlashDisk         0         372.515625G         normal
         FD_11_enkx4cel01         FlashDisk         0         372.515625G         normal
         FD_12_enkx4cel01         FlashDisk         0         372.515625G         normal
         FD_13_enkx4cel01         FlashDisk         0         372.515625G         normal
         FD_14_enkx4cel01         FlashDisk         0         372.515625G         normal
         FD_15_enkx4cel01         FlashDisk         0         372.515625G         normal
Flash Cache compression is a nice feature to logically extend the Flash Cache on certain models of the Exadata family.
Controlling ESFC Usage
Generally speaking, objects will be cached in the ESFC based on the storage software’s automatic caching policy. However, you can override the automatic policy for individual database objects by using the CELL_FLASH_CACHE storage clause attribute, although you should probably refrain from doing so. As you have read a few times by now, the automatic caching works very well since Exadata 11.2.3.3.1 and later. If you insist on pinning objects in Flash Cache for a select few justified cases, you can set the attribute the these three valid values:
- NONE: Never cache this object.
- DEFAULT: The automatic caching mechanism is in effect. This is the default value.
- KEEP: The object should be given preferential status. Note that this designation also changes the default behavior of Smart Scans, allowing them to read from both the cache and disk.
You can specify the storage clause when an object is created. Some options of the storage clause can be modified using the ALTER command as well. Here is an example of changing the CELL_FLASH_CACHE storage clause using the ALTER command:
SQL> alter table martin.bigt storage (cell_flash_cache keep);
You can also see whether objects have been designated for more aggressive caching by looking at the cell_flash_cache column of dba_tables or dba_indexes and their partitioning-related cousins:
SQL> @esfc_keep_tables
SQL> select owner, table_name, status, last_analyzed,
  2  num_rows, blocks, degree, cell_flash_cache
  3  from dba_tables
  4  where cell_flash_cache like nvl('&cell_flash_cache','KEEP'),
Enter value for cell_flash_cache:
old   4: where cell_flash_cache like nvl('&cell_flash_cache','KEEP')
new   4: where cell_flash_cache like nvl('','KEEP')

OWNER                TABLE_NAME      STATUS   LAST_ANAL   NUM_ROWS     BLOCKS DEGREE   CELL_FL
-------------------- --------------- -------- --------- ---------- ---------- -------- -------
MARTIN               BIGTAB_QL       VALID    28-JAN-15  256000000     890768 1        KEEP
You read previously that pinning objects in Flash Cache is not really needed anymore since cellsrv 11.2.3.3.1 and later. Upgrading to a more recent version of the storage software is a good opportunity to test if it is possible to allow Oracle to cache objects autonomously based on its algorithm. Pinning objects can be counterproductive, too, especially in the earlier Exadata hardware generations (such as the V2 and X2) due to the limited amount of Flash memory available. We still see X2 and V2 systems on sites we visit.
In Chapter 7, you can read about Resource Management. I/O Resource Manager allows the Exadata administrator to limit or even forbid the use of Smart Flash Cache.
Monitoring
You can monitor the use of Exadata Smart Flash cache in a number of places. Roughly speaking, you have the option to query certain Automatic Workload Repository (AWR) views or other dynamic performance views introduced recently. The other option is to interrogate the cell software for more information. This section can only be a teaser for the database-accessible information, you can read a lot more in Chapter 11 for session statistics and Chapter 12 for graphical monitoring solutions based on Enterprise Manager 12c.
Metrics available at both cell and database level have been greatly enhanced since the first edition of this book went to print. At the end of the day the graphical tools- AWR reports, Enterprise Manager 12c and Enterprise Manager 12c Express cannot make up the numbers out of thin air-they have a clever interface to display the metrics provided by the system. To make it easier for the reader storage-server related metrics available via cellcli will be discussed first before changing the focus to the database layer.
At the Storage Layer
Each Exadata storage server will record its own metrics that can eventually be passed up to the RDBMS layer. If you want to dive into diagnostics based on the command line, you can do so either by connecting to each cell or alternatively by using the dcli tool on the compute node to harvest information from each storage server. The first option available to the performance engineer is exposed using the cellcli utility in the metriccurrent category. Regarding the Flash-related performance metrics, a number of different object types can be queried. Connected to an Exadata 12.1.2.1 storage cell, the following metric categories can be identified:
[root@enkx4cel01 ~]# cellcli -e list metriccurrent attributes objecttype | sort | uniq | nl
     1                 CELL
     2                 CELLDISK
     3                 CELL_FILESYSTEM
     4                 FLASHCACHE
     5                 FLASHLOG
     6                 GRIDDISK
     7                 HOST_INTERCONNECT
     8                 IBPORT
     9                 IORM_CATEGORY
    10                 IORM_CONSUMER_GROUP
    11                 IORM_DATABASE
    12                 IORM_PLUGGABLE_DATABASE
    13                 SMARTIO
For the purpose of this discussion only, the objectType highlighted in bold typeface is of interest. Since these metrics keep changing with every release, you should have a look at the output of the list metricdefinition command to see if there are any new ones of interest. Still connected to a 12.1.2.1 cell server, you can find the following Flash Cache related metrics:
CellCLI> LIST METRICDEFINITION attributes name, description WHERE objectType = 'FLASHCACHE'
Table 5-1 shows the output of the command limited to those statistics that had actual values associated with them. There are 111 Flash-Cache-related metrics in cellsrv 12.1.2.1, out of which some 54 are shown here that had values > 0 in our environment. Table 5-1 provides a brief description for each statistic tracked at the storage layer that you can report on.
Table 5-1. A Selection of Flash Cache Metric Definitions
|
Metric |
Description |
|---|---|
|
FC_BYKEEP_USED |
Number of megabytes used for keep objects on Flash Cache |
|
FC_BY_ALLOCATED |
Number of megabytes allocated in Flash Cache |
|
FC_BY_DIRTY |
Number of unflushed megabytes in Flash Cache |
|
FC_BY_STALE_DIRTY |
Number of unflushed megabytes in Flash Cache that cannot be flushed because cached disks are not accessible |
|
FC_BY_USED |
Number of megabytes used on Flash Cache |
|
FC_IO_BYKEEP_R |
Number of megabytes read from Flash Cache for keep objects |
|
FC_IO_BY_ALLOCATED_OLTP |
Number of megabytes allocated for OLTP data in Flash Cache |
|
FC_IO_BY_DISK_WRITE |
Number of megabytes written from Flash Cache to hard disks |
|
FC_IO_BY_R |
Number of megabytes read from Flash Cache |
|
FC_IO_BY_R_ACTIVE_SECONDARY |
Number of megabytes for active secondary reads satisfied from Flash Cache |
|
FC_IO_BY_R_ACTIVE_SECONDARY_MISS |
Number of megabytes for active secondary reads not satisfied from Flash Cache |
|
FC_IO_BY_R_DW |
Number of megabytes of DW data read from Flash Cache |
|
FC_IO_BY_R_MISS |
Number of megabytes read from disks because not all requested data was in Flash Cache |
|
FC_IO_BY_R_MISS_DW |
Number of megabytes of DW data read from disk |
|
FC_IO_BY_R_SEC |
Number of megabytes read per second from Flash Cache |
|
FC_IO_BY_R_SKIP |
Number of megabytes read from disks for IO requests that bypass Flash Cache |
|
FC_IO_BY_R_SKIP_NCMIRROR |
Number of megabytes read from disk for IO requests that bypass Flash Cache as the IO is on non-primary, non-active secondary mirror |
|
FC_IO_BY_R_SKIP_SEC |
Number of megabytes read from disks per second for IO requests that bypass Flash Cache |
|
FC_IO_BY_W |
Number of megabytes written to Flash Cache |
|
FC_IO_BY_W_FIRST |
Number of megabytes that are first writes into Flash Cache |
|
FC_IO_BY_W_FIRST_SEC |
Number of megabytes per second that are first writes into Flash Cache |
|
FC_IO_BY_W_OVERWRITE |
Number of megabytes that are overwrites into Flash Cache |
|
FC_IO_BY_W_OVERWRITE_SEC |
Number of megabytes per second that are overwrites into Flash Cache |
|
FC_IO_BY_W_POPULATE |
Number of megabytes that are population writes into Flash Cache due to read miss |
|
FC_IO_BY_W_SEC |
Number of megabytes per second written to Flash Cache |
|
FC_IO_BY_W_SKIP |
Number of megabytes written to disk for IO requests that bypass Flash Cache |
|
FC_IO_BY_W_SKIP_LG |
Number of megabytes written to disk for IO requests that bypass Flash Cache due to the large IO size |
|
FC_IO_BY_W_SKIP_LG_SEC |
Number of megabytes written per second to disk for IO requests that bypass Flash Cache due to the large IO size |
|
FC_IO_BY_W_SKIP_SEC |
Number of megabytes written to disk per second for IO requests that bypass Flash Cache |
|
FC_IO_RQKEEP_R |
Number of requests read for keep objects from Flash Cache |
|
FC_IO_RQ_DISK_WRITE |
Number of requests written from Flash Cache to hard disks |
|
FC_IO_RQ_R |
Number of requests read from Flash Cache |
|
FC_IO_RQ_REPLACEMENT_ATTEMPTED |
Number of requests attempted to find space in the Flash Cache |
|
FC_IO_RQ_REPLACEMENT_FAILED |
Number of requests failed to find space in the Flash Cache |
|
FC_IO_RQ_R_ACTIVE_SECONDARY |
Number of requests for active secondary reads satisfied from Flash Cache |
|
FC_IO_RQ_R_ACTIVE_SECONDARY_MISS |
Number of requests for active secondary reads not satisfied from Flash Cache |
|
FC_IO_RQ_R_DW |
Number of DW IOs read data from Flash Cache |
|
FC_IO_RQ_R_MISS |
Number of read requests that did not find all data in Flash Cache |
|
FC_IO_RQ_R_MISS_DW |
Number of DW IOs read data from disk |
|
FC_IO_RQ_R_SEC |
Number of requests read per second from Flash Cache |
|
FC_IO_RQ_R_SKIP |
Number of requests read from disk that bypass Flash Cache |
|
FC_IO_RQ_R_SKIP_NCMIRROR |
Number of requests read from disk that bypass Flash Cache as the IO is on non-primary, non-active secondary mirror |
|
FC_IO_RQ_R_SKIP_SEC |
Number of requests read from disk per second that bypass Flash Cache |
|
FC_IO_RQ_W |
Number of requests that resulted in Flash Cache being populated with data |
|
FC_IO_RQ_W_FIRST |
Number of requests that are first writes into Flash Cache |
|
FC_IO_RQ_W_FIRST_SEC |
Number of requests per second that are first writes into Flash Cache |
|
FC_IO_RQ_W_OVERWRITE |
Number of requests that are overwrites into Flash Cache |
|
FC_IO_RQ_W_OVERWRITE_SEC |
Number of requests per second that are overwrites into Flash Cache |
|
FC_IO_RQ_W_POPULATE |
Number of requests that are population writes into Flash Cache due to read miss |
|
FC_IO_RQ_W_SEC |
Number of requests per second that resulted in Flash Cache being populated with data |
|
FC_IO_RQ_W_SKIP |
Number of requests written to disk that bypass Flash Cache |
|
FC_IO_RQ_W_SKIP_LG |
Number of requests written to disk that bypass Flash Cache due to the large IO size |
|
FC_IO_RQ_W_SKIP_LG_SEC |
Number of requests written to disk per second that bypass Flash Cache due to the large IO size |
|
FC_IO_RQ_W_SKIP_SEC |
Number of requests written to disk per second that bypass Flash Cache |
Depending on the metrics in Table 5-1, the value can be either cumulative or instantaneous since cellsrv was started. The LIST METRICCURRENT command shows the current values of the metrics for a single storage cell. Following is an example of a cellcli command showing all Flash-Cache-related metrics that are currently reported with a value other than 0:
CellCLI> list metriccurrent attributes name,metricType,metricValue –
> where objectType = 'FLASHCACHE' and metricValue not like '0.*'
         FC_BYKEEP_USED                         Instantaneous         4,395 MB
         FC_BY_ALLOCATED                        Instantaneous         313,509 MB
         FC_BY_DIRTY                            Instantaneous         28,509 MB
         FC_BY_STALE_DIRTY                      Instantaneous         1,052 MB
         FC_BY_USED                             Instantaneous         342,890 MB
         FC_IO_BY_ALLOCATED_OLTP                Instantaneous         327,733 MB
         FC_IO_BY_DISK_WRITE                    Cumulative            39,456 MB
         FC_IO_BY_R                             Cumulative            233,829 MB
         FC_IO_BY_R_ACTIVE_SECONDARY            Cumulative            17.445 MB
         FC_IO_BY_R_ACTIVE_SECONDARY_MISS       Cumulative            5.000 MB
         FC_IO_BY_R_DW                          Instantaneous         82,065 MB
         FC_IO_BY_R_MISS                        Cumulative            19,303 MB
         FC_IO_BY_R_MISS_DW                     Instantaneous         59,824 MB
         FC_IO_BY_R_SKIP                        Cumulative            36,943 MB
         FC_IO_BY_R_SKIP_NCMIRROR               Cumulative            14,714 MB
         FC_IO_BY_W                             Cumulative            344,600 MB
         FC_IO_BY_W_FIRST                       Cumulative            86,593 MB
         FC_IO_BY_W_OVERWRITE                   Cumulative            216,326 MB
         FC_IO_BY_W_POPULATE                    Cumulative            41,680 MB
         FC_IO_BY_W_SKIP                        Cumulative            532,343 MB
         FC_IO_BY_W_SKIP_LG                     Cumulative            401,333 MB
         FC_IO_RQKEEP_R                         Cumulative            11 IO requests
         FC_IO_RQ_DISK_WRITE                    Cumulative            202,358 IO requests
         FC_IO_RQ_R                             Cumulative            20,967,497 IO requests
         FC_IO_RQ_REPLACEMENT_ATTEMPTED         Cumulative            1,717,959 IO requests
         FC_IO_RQ_REPLACEMENT_FAILED            Cumulative            427,146 IO requests
         FC_IO_RQ_R_ACTIVE_SECONDARY            Cumulative            2,233 IO requests
         FC_IO_RQ_R_ACTIVE_SECONDARY_MISS       Cumulative            80 IO requests
         FC_IO_RQ_R_DW                          Cumulative            328,018 IO requests
         FC_IO_RQ_R_MISS                        Cumulative            307,935 IO requests
         FC_IO_RQ_R_MISS_DW                     Cumulative            83,356 IO requests
         FC_IO_RQ_R_SEC                         Rate                  15.8 IO/sec
         FC_IO_RQ_R_SKIP                         Cumulative            1,513,946 IO requests
         FC_IO_RQ_R_SKIP_NCMIRROR                Cumulative            1,350,743 IO requests
         FC_IO_RQ_R_SKIP_SEC                    Rate                  4.6 IO/sec
         FC_IO_RQ_W                              Cumulative             26,211,256 IO requests
         FC_IO_RQ_W_FIRST                        Cumulative             5,961,364 IO requests
         FC_IO_RQ_W_OVERWRITE                    Cumulative             19,887,434 IO requests
         FC_IO_RQ_W_OVERWRITE_SEC               Rate                  5.0 IO/sec
         FC_IO_RQ_W_POPULATE                    Cumulative            362,458 IO requests
         FC_IO_RQ_W_SEC                         Rate                  5.0 IO/sec
         FC_IO_RQ_W_SKIP                         Cumulative             14,121,057 IO requests
         FC_IO_RQ_W_SKIP_LG                     Cumulative            864,020 IO requests
         FC_IO_RQ_W_SKIP_SEC                    Rate                  8.8 IO/sec
In addition to the performance metrics, you can also see what objects are in the cache. The LIST FLASHCACHECONTENT command can be used to this effect. This command shows a single entry for each cached object, the amount of space it is occupying, and various other statistics. Here is an example of looking at the Flash Cache content on a particular cell. The output of the command will list the top 20 cached objects:
CellCLI> list flashcachecontent where dbUniqueName like 'MBACH.*' -
>  attributes objectNumber, cachedKeepSize, cachedSize, cachedWriteSize, hitCount, missCount -
>  order by hitcount desc limit 20
         103456             0         2845298688          2729680896         6372231         23137
         103457             0         320430080           318562304          2031937         2293
         94884              0         32874496            12853248           664676          6569
         103458             0         103858176           101097472          662069          3051
         4294967294         0         1261568             1032192            346445          2
         4294967295         0         11259322368         5793267712         25488           440
         102907             0         404414464           154648576          21243           551
         93393              0         65232896            64184320           20019           53
         103309             0         383328256           137814016          19930           342
         102715             0         362323968           141139968          19585           273
         93394              0         73457664            71581696           19148           48
         93412              0         55427072            53739520           19122           55
         103365             0         388464640           146743296          18938           335
         103367             0         390332416           151314432          18938           347
         103319             0         385581056           149807104          18908           408
         102869             0         373628928           142901248          18596           383
         103373             0         383008768           141934592          18515           288
         103387             0         375513088           139116544          18194           427
         103323             0         354279424           129171456          18117           313
         103313             0         397303808           154607616          18018           318

CellCLI>
Unfortunately, the object name is still not included in the list of attributes. This means you must go back to the database to determine which object is which (by querying dba_objects, for example). Note that the ObjectNumber attribute in cellcli is equivalent to the data_object_id in the database views such as dba_objects. Here is an example how to match the cell’s output with the database:
SQL> select owner, object_name, object_type
  2 from dba_objects where data_object_id = 103456;

OWNER      OBJECT_NAME                    OBJECT_TYPE
---------- ------------------------------ ------------------------------
SOE        STRESSTESTTABLE                TABLE
Given all the benchmarking performed as part of this chapter’s preparation, it is not surprising that the Swingbench stress test table and its two indexes (data object IDs 103457 and 103458) are the most heavily hit and (write) cached segments.
Another useful addition of some more recent Exadata versions is the cellsrvstat tool. It is covered in detail in Chapter 11, but it is useful to mention it here as well. The command line tool allows the performance analyst to limit the output to so-called statistic groups. There are quite a few available to you, but if you would like to limit your investigation to Flash Cache, the flashcache group unsurprisingly is of most use. Here is an example of cellsrvstat output:
[root@enkcel04 ~]# cellsrvstat -stat_group flashcache
===Current Time===                                      Wed May  6 15:23:37 2015

== FlashCache related stats ==
Number of read hits                                             0       21065931
Read on flashcache hit(KB)                                      0      241004568
Number of keep read hits                                        0             11
Read on flashcache keep hit(KB)                                 0             88
Number of read misses                                           0         307947
Total IO size for read miss(KB)                                 0       19767368
Number of keep read misses                                      0              0
Total IO size for keep read miss(KB)                            0              0
Number of no cache reads                                        0        1547921
Total size for nocache read(KB)                                 0       38403468
Number of keep no cache reads                                   0              0
Number of partial reads                                         0          26596
Total size for partial reads(KB)                                0        6897768
Number of optimized partial reads                               0          26528
Number of keep partial reads                                    0              0
Number of cache writes                                          0       25900731
Total size for cache writes(KB)                                 0      311166944
Number of partial cache writes                                  0          15155
Number of redirty                                               0       19923003
Number of keep cache writes                                     0              0
Total size for keep cache writes(KB)                            0              0
Number of partial keep cache writes                             0              0
Number of keep redirty                                          0              0
[and many more]
The output of the tool is cumulative. On the left-hand side you see the metric and its name. The column of zeros here is the current value, and the large value is the one that indicates the cumulative value for the statistic. In best UNIX tradition, you can also use cellsrvstat to measure ongoing activity. To do so, you need to specify the interval and count parameters. If you specify an interval of, let’s say, 15 seconds and a repeat count of two, you should focus on the output produced after the initial performance metrics were displayed. Similar to iostat and related tools, the first output represents the cumulative data since startup, whereas the second really measures the current activity during the interval specified.
At the Database Layer
Up until Oracle Database 12c, the database did not really provide much visibility into how Flash Cache is used. Worse yet, in 11.2.0.3, there were no metrics that distinguished writes from reads to (Write-back) Flash Cache—it was all a bit mixed up. Oracle 12.1.0.2.x offers the most information, closely followed by 11.2.0.4, although most of what you will read about in this section only applies to 12.1.0.2.
You can query the database in the following locations about Flash usage:
- Session statistics as seen in v$mystat, v$sesstat, and related views
- V$CELL% family of dynamic performance views
- AWR reports
These will be discussed in the following sections.
Flash-Cache-Related Performance Counters
Performance counters are covered in Chapter 11, yet it is important to briefly list them here to give you a basic understanding of monitoring performance of Flash storage on the Exadata platform. If you need more information about any of these counters or related ones, please flip over to Chapter 11.
Before the introduction of the Write-back Flash Cache, there were really just a couple of statistics available for Flash Cache usage or efficiency: cell Flash Cache read hits and two statistics related to physical I/O. They are called physical read requests optimized and the closely related physical read total bytes optimized. The latter two can be a bit misleading since optimized I/O requests can be optimized (a)because the I/O requests benefited from a storage index and (b) when they were served from Flash Cache. Storage index savings as well as Flash Cache benefits are both rolled up in the same physical I/O statistic. If your query can make use of Flash Cache only, the statistic is relevant. Here is an example. The user in session 264 executed the following statement:
SQL> select /* fctest001 */ count(*) from SOE.ORDER_ITEMS where order_id < 0;

  COUNT(*)
----------
         0

Elapsed: 00:00:16.45
The performance analyst filtered the following statistics from the instancewide v$sesstat performance view:
SQL> select sid, name, value from v$sesstat natural join v$statname
  2  where sid = 264
  3  and name in (
  4    'cell flash cache read hits',
  5    'cell overwrites in flash cache',
  6    'cell partial writes in flash cache',
  7    'cell physical IO bytes saved by storage index',
  8    'cell writes to flash cache',
  9    'physical read IO requests',
 10    'physical read requests optimized',
 11    'physical read total bytes optimized',
 12    'physical write requests optimized',
 13    'physical write total bytes optimized')
 14  order by name;

       SID NAME                                                                  VALUE
---------- ---------------------------------------------------------------- ----------
       264 cell flash cache read hits                                             5895
       264 cell overwrites in flash cache                                            0
       264 cell partial writes in flash cache                                        0
       264 cell physical IO bytes saved by storage index                             0
       264 cell writes to flash cache                                                0
       264 physical read IO requests                                              6042
       264 physical read requests optimized                                       5895
       264 physical read total bytes optimized                               810237952
       264 physical write requests optimized                                         0
       264 physical write total bytes optimized                                      0

10 rows selected.
Please ignore the fact that writes statistics are part of the list of statistic names—the script is generic and can be used to query foreground and background processes. As you can see from the output, the execution of the query did not benefit from a storage index, which is why the statistic cell physical IO bytes saved by storage index is not populated. What you can derive from the other I/O statistics, though, is that out of 6042 physical read I/O requests, 5895 or approximately 97% of all I/O requests were served from Flash Cache. If you go back a little bit to look at the statement, you can see that it queries data from the SOE schema, part of the Swingbench suite. If you have used Swingbench before, you will know that Swingbench simulates an OLTP-style workload, based on lots of indexes. And indeed, using the fsx (find SQL execution) and dplan scripts, you can see that the query was not offloaded:
SQL> @fsx4.sql
Enter value for sql_text: %fctest001%
Enter value for sql_id:

SQL_ID         CHILD OFFLOAD IO_SAVED_%  AVG_ETIME SQL_TEXT
------------- ------ ------- ---------- ---------- ----------------------------------------
2s4ff4z9f8q7c      0 No             .00      16.45 select /* fctest001 */ count(*) from SOE

SQL> @dplan
Enter value for sql_id: 2s4ff4z9f8q7c
Enter value for child_no: 0

PLAN_TABLE_OUTPUT
-------------------------------------------------------------------------------------------
SQL_ID  2s4ff4z9f8q7c, child number 0
-------------------------------------
select /* fctest001 */ count(*) from SOE.ORDER_ITEMS where order_id < 0

Plan hash value: 643311209

---------------------------------------------------------------------------------------
| Id  | Operation             | Name          | Rows  | Bytes | Cost (%CPU)| Time     |
---------------------------------------------------------------------------------------
|   0 | SELECT STATEMENT      |               |       |       | 26355 (100)|          |
|   1 |  SORT AGGREGATE       |               |     1 |     6 |            |          |
|*  2 |   INDEX FAST FULL SCAN| ITEM_ORDER_IX |     3 |    18 | 26355   (1)| 00:00:02 |
---------------------------------------------------------------------------------------

Predicate Information (identified by operation id):
---------------------------------------------------

   2 - filter("ORDER_ID"<0)


19 rows selected.
Hold on-why is that query not offloading? Aren’t Index Fast Full Scans candidates? They are indeed, but what you cannot see here is that ITEM_ORDER_IX is a reverse key index, which is not offloadable in 12.1.2.1.x at least.
SQL> select owner, index_name, index_type, table_owner, table_name
  2  from dba_indexes
  3  where index_name = 'ITEM_ORDER_IX'
  4  and owner = 'SOE';

OWNER      INDEX_NAME           INDEX_TYPE                     TABLE_OWNER     TABLE_NAME
---------- -------------------- ------------------------------ --------------- ---------------
SOE        ITEM_ORDER_IX        NORMAL/REV                     SOE             ORDER_ITEMS
To finally demonstrate that the physical IO statistics can include Flash Cache hits as well as storage index savings a full scan has been forced using a hint:
SQL> select /*+ full(oit) */ /* fctest004  */ count(*) from SOE.ORDER_ITEMS oit
  2  where order_id < 0;

  COUNT(*)
----------
         0

Elapsed: 00:00:00.11
Using a slight variation of the query you saw before, you can see a different picture:
SQL> select sid, name, value from v$sesstat natural join v$statname
  2  where sid = (264)
  3  and name in (
  4    'cell physical IO bytes eligible for predicate offload',
  5    'cell flash cache read hits',
  6    'cell overwrites in flash cache',
  7    'cell partial writes in flash cache',
  8    'cell physical IO bytes saved by storage index',
  9    'cell writes to flash cache',
 10    'physical read IO requests',
 11    'physical read bytes',
 12    'physical read requests optimized',
 13    'physical read total bytes optimized',
 14    'physical write requests optimized',
 15    'physical write total bytes optimized')
 16  order by name;

       SID NAME                                                                           VALUE
---------- ---------------------------------------------------------------- ------------------
       264 cell flash cache read hits                                                     61.00
       264 cell overwrites in flash cache                                                   .00
       264 cell partial writes in flash cache                                               .00
       264 cell physical IO bytes eligible for predicate offload               3,050,086,400.00
       264 cell physical IO bytes saved by storage index                       3,048,513,536.00
       264 cell writes to flash cache                                                       .00
       264 physical read IO requests                                                  23,365.00
       264 physical read bytes                                                 3,050,496,000.00
       264 physical read requests optimized                                           23,364.00
       264 physical read total bytes optimized                                 3,050,487,808.00
       264 physical write requests optimized                                                .00
       264 physical write total bytes optimized                                             .00

12 rows selected.
Instead of 97% of I/O requests served by Flash, there are very few read hits. Some of these are actually caused by recursive SQL. On the other hand, you can see that out of 23,365 IO requests, 23,364 were optimized as well. Clearly, these optimizations are caused by the storage index savings.
So far in this section, you have seen cell Flash Cache read hits, but no statistics related to writes. These cannot be found in foreground processes as writes to data files are performed in batches by the database writer processes. Here is an example for the database writer statistics found on the same instance:
SQL> select sid, name, value from v$sesstat natural join v$statname
  2    where sid in (select sid from v$session where program like '%DBW%')
  3    and name in (
  4      'cell flash cache read hits',
  5      'cell overwrites in flash cache',
  6      'cell partial writes in flash cache',
  7      'cell physical IO bytes saved by storage index',
  8      'cell writes to flash cache',
  9      'physical read IO requests',
 10      'physical read requests optimized',
 11      'physical read total bytes optimized',
 12      'physical write requests optimized',
 13      'physical write total bytes optimized')
 14  order by name;

       SID NAME                                                                  VALUE
---------- ---------------------------------------------------------------- ----------
        65 cell flash cache read hits                                                0
         1 cell flash cache read hits                                                1
      1473 cell flash cache read hits                                              556
         1 cell overwrites in flash cache                                    344868411
        65 cell overwrites in flash cache                                    344836755
      1473 cell overwrites in flash cache                                    344936768
         1 cell partial writes in flash cache                                      665
        65 cell partial writes in flash cache                                      518
      1473 cell partial writes in flash cache                                      643
        65 cell physical IO bytes saved by storage index                             0
      1473 cell physical IO bytes saved by storage index                             0
         1 cell physical IO bytes saved by storage index                             0
        65 cell writes to flash cache                                        353280230
         1 cell writes to flash cache                                        353317405
      1473 cell writes to flash cache                                        353382073
      1473 physical read IO requests                                                11
        65 physical read IO requests                                                 0
         1 physical read IO requests                                                 1
         1 physical read requests optimized                                          1
        65 physical read requests optimized                                          0
      1473 physical read requests optimized                                        556
         1 physical read total bytes optimized                                    8192
      1473 physical read total bytes optimized                                 8994816
        65 physical read total bytes optimized                                       0
         1 physical write requests optimized                                 176644066
        65 physical write requests optimized                                 176625494
      1473 physical write requests optimized                                 176676770
      1473 physical write total bytes optimized                             1.5990E+12
        65 physical write total bytes optimized                             1.5981E+12
         1 physical write total bytes optimized                             1.5986E+12

30 rows selected.
Here you can see the Write-back Flash Cache at work.
The V$CELL% Family of Dyamic Performance Views
This section can only be an introduction to the V$CELL% family of views. They are covered in Chapter 11 as well, where you can read that the views have been greatly enhanced in Oracle 12.1.0.2 and cellOS 12.1.2.1.x and later. The most interesting views from the point of view of analyzing Flash Cache are listed in Table 5-2.
Table 5-2. List of V$CELL Views Useful for Monitoring Flash Cache
|
View Name |
Contents |
|---|---|
|
V$CELL_DB |
Lists the I/O requests against all cells on a global level. Limit your queries to a source database to get an idea about its share on all the I/O requests. |
|
V$CELL_DISK |
Lists all the I/O-related statistics that can possibly be measured for cell disks. You should limit your query to either individual cells or, better still, individual cell disks whose name begins with FD for Flash disks. If you are using an all-Flash storage server, you should not rely on the information in this view to measure Flash Cache performance. Due to the absence of hard disks, all grid disks are created on the Flash devices and you cannot easily separate Flash Cache from grid-disk-related I/O in the view. For all other Exadata users, it is likely that all of the Flash cards are used for Flash Cache (minus the 512MB used for Flash Logging), in which case the view can show you some interesting figures about the number of I/O requests, their size, and latencies. |
|
V$CELL_GLOBAL |
One of the most interesting views in this table as it provides output very similar to the cellcli command “list metriccurrent” and cellsrvstat shown earlier. It is best explained using an example, following this table. |
V$CELL_DISK and V$CELL_GLOBAL have some historization of their information in the V$CELL_DISK_HISTORY and V$CELL_GLOBAL_HISTORY, respectively. Here is the example query against V$CELL_GLOBAL to show Flash-Cache-related metrics.
SQL> select metric_name, metric_value, metric_type
  2  from V$CELL_GLOBAL
  3  where lower(metric_name) like '%flash cache%'
  4  and cell_name = '192.168.12.10';

METRIC_NAME                                          METRIC_VALUE METRIC_TYPE
-------------------------------------------------- -------------- -----------------
Flash cache read bytes                               358836707328 bytes
Flash cache write bytes (first writes, overwrites,   500606863872 bytes
 partial writes)

Flash cache bytes used                               360777785344 bytes
Flash cache bytes used (keep objects)                  4966318080 bytes
Flash cache keep victim bytes                                   0 bytes
Flash cache write bytes - first writes               107450368000 bytes
Flash cache write bytes - overwrites                 392564908032 bytes
Flash cache write bytes - population writes due to    50094088192 bytes
 read misses
[and many more]
You can find the metric definition in V$CELL_METRIC_DESC. At the time of writing, not all the metrics exposed on the cell via cellcli are equally exposed in the database layer, but as with all Exadata features this might change in the future.
AWR Reports
The Exadata documentation features an appendix “What’s new in the Oracle Exadata Database Machine” in the Database Machine System Overview document. You should probably have a look at it from time to time—the contents are very valuable, especially since the wealth of Exadata features sometimes makes it hard to remember when a given feature was introduced. With version 12.1.2.1.0, Oracle introduced Exadata performance-related information in AWR reports. The AWR report might be better suited to display and present the performance related data. In addition to performance data, you are shown more detail about the system’s configuration and a health report. The nice fact about the report is that a lot of information is applicable at a global level, so you can see information about the entire system rather than staying confined to a single database.
Summary
Exadata Smart Flash Cache provides yet another way to pare down the I/O cost associated with Oracle databases. Most of the optimizations that the Exadata platform provides require the use of Smart Scans (full table or fast full index scans). ESFC does not depend on Smart Scans and, in fact, is most useful for speeding up access on random reads of single blocks. Thanks to the transparent caching of full-scanned data introduced in Exadata 11.2.3.3.0, multi-block reads can now benefit from the Flash Cache as well. Single-block read operations are generally associated with OLTP workloads, and, as such, ESFC is the key component of Exadata for OLTP or mixed workloads. In the previous edition of this book, we argued that the fact that ESFC does not provide a write-back cache severely limited its effectiveness with systems that are bottlenecked on writes. Exadata 11.2.3.3.1 addressed this concern, and now you can operate the Flash Cache in write-back mode. This is true even for the all-Flash X5-2 arrays that come with a portion of their capacity dedicated as (write-back) Flash Cache. Write-back Flash Cache provides significant improvements with write-intensive workloads. The Flash cards in the Exadata systems provide better IOPS numbers for writes than the combined set of disks together. On an X2-2 quarter rack, that—according to the data sheet—supports 6,000 disk IOPS we managed to scale up to 22,000 IOPS without trying very hard at all. This number greatly surpasses the pure disk-based IOPS capability of the system.
The large cache and the intelligent caching algorithms used by the Oracle storage software allow ESFC to provide read performance similar to solid-state-based disk systems. Offloading large portions of random read activity from the hard disks also provides an indirect benefit to processing involving such as not-yet-cached Smart Scans. Generally speaking, the generous amount of cache available in the X4-2 and X5-2 hardware has made life a lot easier for Exadata administrators, and so has the automatic caching of data, one of this author’s favorite recent Exadata features.
While ESFC was initially thought of as purely an optimization aimed at reducing latency for small reads, it now is also quite effective for large DW-type queries. In fact, the large throughput numbers that Oracle quotes depend on disk and Flash Cache being scanned concurrently when possible. The Flash Cache actually shoulders the lion’s share of the burden in this case. Tweaking the storage clause to modify the caching policy should no longer be needed. Since Flash Cache has become a crucial component to the Exadata platform, it must be controlled in some form. Oracle has realized this and allows Flash Cache to be controlled using I/O Resource Manager.