
Without any further ado, lets kick-start the engine and start our foray into the world of predictive analytics. However, you need to remember that our fuel is data. In order to do any predictive analysis, one needs to access and import data for the engine to rev up.
I assume that you have already installed Python and the required packages with an IDE of your choice. Predictive analytics, like any other art, is best learnt when tried hands-on and practiced as frequently as possible. The book will be of the best use if you open a Python IDE of your choice and practice the explained concepts on your own. So, if you haven't installed Python and its packages yet, now is the time. If not all the packages, at-least pandas should be installed, which are the mainstay of the things that we will learn in this chapter.
After reading this chapter, you should be familiar with the following topics:
- Handling various kind of data importing scenarios that is importing various kind of datasets (
.csv,.txt), different kind of delimiters (comma,tab,pipe), and different methods (read_csv,read_table) - Getting basic information, such as dimensions, column names, and statistics summary
- Getting basic data cleaning done that is removing NAs and blank spaces, imputing values to missing data points, changing a variable type, and so on
- Creating dummy variables in various scenarios to aid modelling
- Generating simple plots like scatter plots, bar charts, histograms, box plots, and so on
From now on, we will be using a lot of publicly available datasets to illustrate concepts and examples. All the used datasets have been stored in a Google Drive folder, which can be accessed from this link: https://goo.gl/zjS4C6.
Note
This folder is called "Datasets for Predictive Modelling with Python". This folder has a subfolder dedicated to each chapter of the book. Each subfolder contains the datasets that were used in the chapter.
The paths for the dataset used in this book are paths on my local computer. You can download the datasets from these subfolders to your local computer before using them. Better still, you can download the entire folder, at once and save it somewhere on your local computer.
Before we delve deeper into the realm of data, let us familiarize ourselves with a few terms that will appear frequently from now on.
A data frame is one of the most common data structures available in Python. Data frames are very similar to the tables in a spreadsheet or a SQL table. In Python vocabulary, it can also be thought of as a dictionary of series objects (in terms of structure). A data frame, like a spreadsheet, has index labels (analogous to rows) and column labels (analogous to columns). It is the most commonly used pandas object and is a 2D structure with columns of different or same types. Most of the standard operations, such as aggregation, filtering, pivoting, and so on which can be applied on a spreadsheet or the SQL table can be applied to data frames using methods in pandas.
The following screenshot is an illustrative picture of a data frame. We will learn more about working with them as we progress in the chapter:
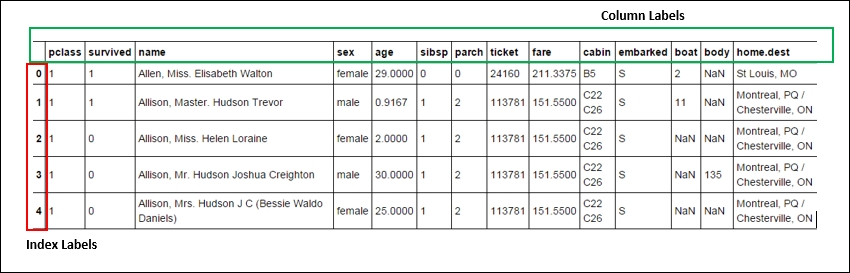
Fig. 2.1 A data frame
A delimiter is a special character that separates various columns of a dataset from one another. The most common (one can go to the extent of saying that it is a default delimiter) delimiter is a comma (,). A .csv file is called so because it has comma separated values. However, a dataset can have any special character as its delimiter and one needs to know how to juggle and manage them in order to do an exhaustive and exploratory analysis and build a robust predictive model. Later in this chapter, we will learn how to do that.