Chapter 11
Consolidating Data Capture with SQLdiag
WHAT’S IN THIS CHAPTER?
- Collecting data for analyzing SQL Server performance
- Getting friendly with SQLdiag
- Using SQLdiag Configuration Manager
- Employing Best Practices
WROX.COM CODE DOWNLOADS FOR THIS CHAPTER
There are no code downloads for this chapter.
THE DATA COLLECTION DILEMMA
One of the biggest issues a SQL Server professional faces when troubleshooting a complex SQL Server problem is the data collection task. The classic catch-22 situation always presents itself: installing data collection utilities on the server versus not collecting all the required data to address the root cause of the problem at hand.
The most common dilemma encountered is using a single tool to capture the required set of data simultaneously when faced with a critical production issue. Unless and until there are tools that enable quick configuration capabilities, we are left gambling with the prospect of continued service unavailability and missing service-level agreements while trying to configure the data collection tools. Seasoned SQL Server professionals have their own toolset handy, which they consider to be their equivalent of a superhero’s utility belt and which serves them well at the time of a crisis situation.
Once you have successfully fought the demons inside your SQL Server environment that were wreaking havoc and causing the problems, you will be tasked with identifying the root cause of the issue. Identifying the root cause in itself is not a bad thing. However, this noble task may soon take an ill-fated turn when you realize that the data required to perform a complete post-mortem analysis is missing. When battling with a critical production service-related issue, it is possible that the data necessary for post-mortem analysis is not collected, as the need of the moment is to restore service as soon as possible. This makes it highly pertinent to have a data collection utility in place, one which not only collects all the necessary data required given a particular situation but also is easily configurable at the drop of a hat!
The SQLdiag, which started shipping with SQL Server 2005, is a utility used to collect diagnostic data from a SQL Server instance. It is a general-purpose diagnostics utility that can be run as a console application or a service. SQLdiag can help you collect SQL Server Profiler traces, Windows Performance Monitor logs, and outputs of various VBScript, T-SQL, and DOS scripts through an extensible interface exposed by the SQLdiag Configuration Manager. This close knit integration of data collection capabilities makes SQLdiag a “must have” tool in the SQL Server professional’s repertoire.
The data that is collected by the SQLdiag utility can be imported into a SQL Server database using SQL Nexus, a GUI tool for providing an aggregated view of the data collected in a report format. Chapter 12 explains how you can derive maximum benefit from SQL Nexus.
AN APPROACH TO DATA COLLECTION
In this section, we will delve into specifics of how data can be collected to analyze the performance of your SQL Server instance. Basically, SQL Server data analysis can be done in the following ways:
- Baseline Analysis — A baseline of your SQL Server instance will tell you what the resource usage for the SQL Server instance in question looks like on an average at a particular time of the day. You will know if the delta difference that you see for a particular set of data has a positive or a negative connotation only if you the appropriate baselines established for your SQL Server instance. When you have an existing baseline available, then it makes sense to capture data during the problem period for a short period of time in order to establish a comparative study between the current start and an established baseline. This enables you to look for seemingly innocuous patterns in the data that might prove to be the root cause of your SQL Server troubles. This is what is referred to as a baseline analysis.
- Bottleneck Analysis — The second option, bottleneck analysis, is the approach to which most SQL Server professionals are accustomed. This is used when a baseline is not readily available or an available baseline is not pertinent to the current state of the environment. In such a situation, you need to collect data both for a period when the issue is not occurring and during the period when the problem manifests itself. Then the two sets of data are compared to weed out the difference and the symptoms that were exhibited when the problem occurred. The ideal scenario for a bottleneck analysis is to start data collection a little before the problem manifests itself, capturing the transition period from a serenely functional SQL Server environment to an environment that raises all sorts of red lights on service-level scorecards. Sometimes, we have to be content with a comparative analysis and compare two sets of data collection, which may not even belong to the same environment. This may sound appalling but is a harsh reality in the production world scenario where it is not always feasible to add additional workload or bring in new executables to collect diagnostic data. Bottleneck analysis helps you arrive at the top N bottlenecks that your SQL Server instance is experiencing by identifying the road-blocks which are preventing the smooth functioning of your SQL Server instance.
This requires some precise data collection capabilities, along with various other requirements like knowing which system catalogs to query, what tools to run to collect the required data, etc. The next few pages in this chapter will help you understand how developing a friendship with SQLdiag can prove beneficial when a SQL Server crisis arises. The following section will explain how SQLdiag can be used to configure and collect diagnostic data within a few minutes.
GETTING FRIENDLY WITH SQLDIAG
There are two times when you collect data for troubleshooting a SQL Server issue:
- You are faced with a critical problem in your production environment and the data collection is being done to identify and fix the root cause.
- You are trying to reproduce an issue for which sufficient data was not collected initially to ascertain a definitive root cause.
The latter scenario is always a cumbersome process because you might end up playing the waiting game for intermittent issues. The frustration of such waiting for the actual issue to occur can become more excruciating due to the overhead of managing the data that diagnostics tools collect when left running.
This is where SQLdiag becomes a SQL Server professional’s best friend, living up to the adage that “a friend in need is a friend indeed.” SQLdiag is a command-line utility that is available by default in C:Program FilesMicrosoft SQL Server110ToolsBinn. This assumes that the binary installation path of the SQL Server instance on the machine was done on the C: drive.
You can run SQLdiag in three modes:
- Snapshot mode using the /X command line parameter
- As a command-line application by specifying one or more command-line parameters
- As a service
Each of the aforementioned modes is explained in detail in the following sections of the chapter along with the scenario which suits the data collection mode.
Using SQLdiag in Snapshot Mode
When SQLdiag is run in snapshot mode, it collects a snapshot of all the configured diagnostic data (mentioned in the SQLdiag configuration file discussed in the next section) and then shuts down automatically. If you execute SQLDIAG /X from a command prompt window, the SQLdiag utility creates a SQLDIAG folder in the Binn folder, containing all the data it collected. You will additionally find an “internal” folder containing log files created by the utility, along with the XML configuration file that it used to collect the data, among other files. This method of collecting data is quite useful when you want a quick snapshot of the state of the SQL Server instance. You get a plethora of information ranging from SQL Server and Windows configuration, errors encountered recently, waits experienced by the database engine and much more.
After data collection is completed, the utility shuts down automatically with the message SQLDIAG Collection complete. Collector exiting. A default snapshot data collection collects the following information:
- SQL Server default traces
- MSINFO32 output in a text file
- A <MachineName>_<InstanceName>_sp_sqldiag_Shutdown.OUT text file, which contains the following data:
- All Errorlogs
- Output of various system stored procedures, such as sp_configure, sp_who, sp_lock, sp_helpdb, to obtain the SQL Server instance and database configuration details
- Output of various DMVs and system catalogs, such as sys.sysprocesses, sys.dm_exec_sessions, and sys.dm_os_wait_stats, to obtain additional information, with the following being of key importance:
- Insight into the instance’s memory usage
- A snapshot of the current values for all the SQL Server PerfMon counters
- A snapshot of the SQL Server wait statistics
- Status of the sessions and requests active on the SQL Server instance. along with the associated input buffers
- Status of the SQL Server schedulers
Using SQLdiag as a Command-line Application
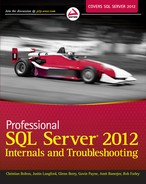
Before looking at the basics of running a SQLdiag data collection, you should first understand the anatomy of the SQLdiag configuration file in order to appropriately configure the various data collectors for capturing diagnostic data. Figure 11-1 shows a screenshot of the key elements in the SQLDIAG.XML configuration file.
SQLdiag Configuration File Key Elements
- The full-stop (.) for the Machine Name value signifies that the data collection is to be done from the local machine (i.e., the machine from where the SQLdiag execution was initiated).
- The asterisk (*) for the Instance Name value specifies that the utility should collect data from all instances installed on the machine.
- The EventlogCollector element specifies whether the Windows Event Logs need to be collected and if so, whether they should be collected when the utility starts up or shuts down, or both.
- The PerfmonCollector element specifies whether PerfMon data will be collected, and the pollinginterval and maxfilesize parameter values define the time interval between two consecutive samples and the maximum size of the .blg PerfMon file, respectively.
- The SqldiagCollector element specifies whether the utility will collect the SQLdiag output file, discussed earlier in the “Using SQLdiag in Snapshot Mode” section.
- The ProfilerCollector element specifies the SQL Server Profiler events to be captured, along with all the Profiler trace configuration settings. Note that SQLdiag always captures a server-side Profiler trace to ensure minimal impact of a Profiler trace capture on the SQL Server instance.
- The BlockingCollector element enables trace flag 1222 to facilitate the capture of deadlock graphs in the SQL Server Error Log.
You can control the collectors used by SQLdiag using the XML templates. Every collector can be enabled or disabled using <enabled=true> or <enabled=false> within the configuration file. Use either your favorite text editor to modify the XML configuration file or even Management Studio, which supports XML document editing.
If you are wondering what happened to the CustomDiagnostics variable explanation, it is covered in the section “Using SQLdiag Configuration Manager.” The following code snippet shows all the parameters that the SQLdiag utility can accept.
Usage: sqldiag [START | STOP | STOP_ABORT] [/O outputpath] [/I cfgfile] [/M machine1[machine2 machineN]|@machinelistfile] [/Q] [/C #] [/G] [/R] [/U] [/N #] [/A appname][/T {tcp[,port]|np|lpc|via}] [/X] [/L] [/B YYYYMMDD_HH:MM:SS] [/E YYYYMMDD_HH:MM:SS]Now take a look at how each of these parameters is used, along with some best practices to prevent the data collection effort from becoming an accessory to a performance degradation crime.
SQLdiag Parameter List
- START | STOP | STOP_ABORT — START and STOP are used to start and stop the data collection, respectively. STOP_ABORT is used when data collection needs to be terminated immediately without waiting for all the collectors to complete, which proves quite useful when your data collection might start competing for resources with a production workload or your data collection has exceeded your intended data collection time window.
- /O outputpath — This specifies the directory in which the utility will write the collected data. It is advisable to use a local disk on which SQL Server database files do not reside.
- /I cfgfile — This specifies the configuration file to be used for the data collection. The default configuration file is always SQLDiag.Xml.
- /M machinename or machinelist file — This is a comma-separated list indicating the machines from which the utility should collect data. This parameter is rarely used, as remote data collection should be avoided. A machine name provided using this parameter overrides the machine name value in the configuration file.
- /Q — Runs in quiet mode and prevents any prompts
- /C — This specifies the compression option, which can be useful when you are collecting diagnostic data for long periods of time, especially for the large PerfMon and Profiler trace files. /C 1 directs SQLdiag to compress the output folder files using NTFS compression.
- /G — Connectivity checks are skipped when this switch is specified, and data collection is prevented only due to lack of permission or connectivity issues. SQLdiag will not collect data by default if the user running the utility is not a member of the Windows Administrators group on the server.
- /R — Registers the utility as a service
- /U — Unregisters the utility as a service
- /N — This parameter defines how SQLdiag controls management of the output folder. /N 2 renames the existing output folder (if present) and instead writes to the output path specified. This can be a helpful option when you perform a data collection for a specific period of time and the captured data is analyzed later. This scenario requires preservation of the output folder and not an overwrite of the existing data. The default option is to overwrite.
- /A appname — Provides an application name for the utility and enables the option of running multiple concurrent data collection executables with different application names.
- /T — Tells SQLdiag to connect to the SQL Server instance using a specified protocol such as TCP, Named Pipes, Local Procedure Call, or Virtual Interface Adapter. Various environments are secure and only allow connections using a specific port or protocol. In such scenarios, this parameter comes to the rescue and facilitates the important data connection required to collect diagnostic information.
- /L — Specifies running the data collection in continuous mode. This has to be defined in conjunction with either a start time or an end time using the /B or /E parameters. This parameter enables collecting data around the clock when you don’t know when the problem will occur or it occurs intermittently. This ensures that SQLdiag collects the data even if you are not around monitoring the server during the data collection period.
- /B and /E — These specify the starting and ending times of the data collection, respectively. These two parameters can be used together to collect data while troubleshooting an issue that occurs during a specific time period. They enable you to schedule your data collection without being logged onto the server when the issue occurs at inconvenient hours of the day. The date and time format for these parameters is YYYYMMDD_HH:MM:SS and you can even specify the time using a + sign. For example, /B +02:00:00 specifies that data collection should start two hours from the time the command is issued.
- /P — Sets the support folder path. By default, /P is set to the folder in which the SQLdiag executable resides. This folder contains SQLdiag support files, such as the XML configuration file, Transact-SQL scripts, and other files that the utility uses during diagnostics collection.
Now that you are familiar with the parameters, a few examples of their values and behaviors are shown when used in conjunction with other parameters:
The following command tells SQLdiag to start data collection at 12:01AM on 25th December, 2012, and terminate data collection after two hours with a specific output folder. /G parameter will skip connectivity checks.
SQLDIAG /O D:SQLDIAG_Data /G /B 20121225_00:01:00 /E +02:00:00The command prompt window will display the following line on successful execution of the above code indicating that SQLdiag is successfully initialized:
SQLDIAG Begin time 20121225_00:01:00 specified. WaitingThe following command instructs SQLdiag to collect data using a configuration file with file compression. The application name will be shown as DemoDiag with quiet mode enabled to suppress any prompts.
SQLDIAG /O D:SQLDIAG_Data /A DemoDiag /Q /I D:SQLDIAG_Custom.xmlThe following lines are what you will see in the command prompt window when SQLdiag initializes successfully:
DIAG$DemoDiag Collector version

IMPORTANT:  Please wait until you see ‘Collection started’ before attempting to
reproduce your issueThe time required for SQLdiag to initialize varies according to the state of the Windows machine from which the data is being collected. Because some of the servers used to collect diagnostic data may be under severe stress in terms of physical resources, it may take a little more time than usual to complete the initialization phase. Even the shutdown of the SQLdiag utility is extended due to custom diagnostics configured. The most common sources of delays are as follows:
- Large SQL Server Error Logs collected during shutdown
- The long time taken to collect MSINFO32 output
- T-SQL scripts captured during shutdown, which take a long time to execute
The SQLdiag console output and the verbose log of the utility can be found in the internal folder of the output directory in the files ##console.log and ##SQLDIAG.LOG, respectively. When the utility experiences a failure or does not behave as expected, these two files can provide you with additional insight about why the failure occurred.
Using SQLdiag as a Service
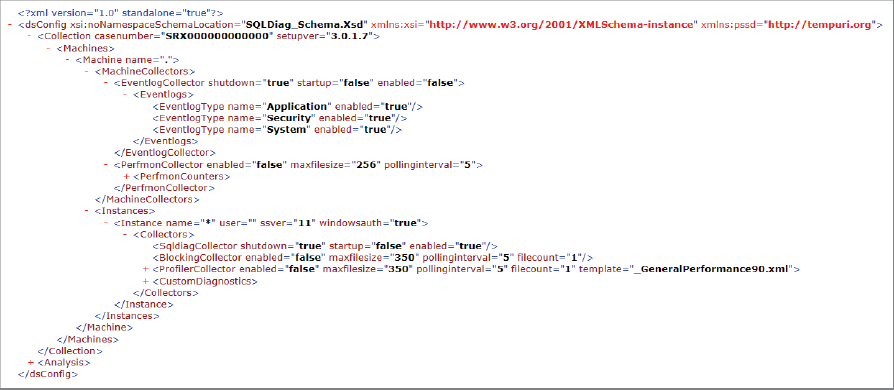
The third way you can collect data using SQLdiag is with a Windows service. You can use the /R parameter to register the utility as a service, and /U to unregister the tool as a service. You can use the /A switch to register SQLdiag as a service with a unique name. Figure 11-2 shows the properties of the SQLdiag utility registered as a service. The following command registers SQLdiag as a service with the name DIAG1:
SQLDIAG /R /A DIAG1As you can see, the SQLdiag service registration appends DIAG$ to the service name when the /A parameter is used to provide the application name. If you choose to only use the /R switch, then the service is named SQLDIAG as shown in Figure 11-3.

Note that service registration is done using the Log On As account as Local System. The majority of environments in which you will be using SQLdiag as a service will likely not have SQL Server sysadmin privileges granted to the Local System account. Therefore, after registering the utility as a service, you will need to change the service account to an account that has Administrator rights on the Windows machine and sysadmin privileges on the SQL Server instance(s) to which the service will connect.
The next decision you need to make is which parameters you want to specify for the service. While registering the service, you can provide parameters as appropriate. In the following example, SQLdiag is being registered as a service:
'C:Program FilesMicrosoft SQL Server110ToolsBinnsqldiag.exe' /R /I
C:SQLDIAG_DataSQLDIAG_Custom.XML /O 'C:SQLDIAG_Data'
A successful service registration reports the message “SQLDIAG Service installed. Exiting.” Note that in the above command, we needed to specify the path of the configuration file and the output folder, as well as to ensure that the right set of configuration options are used and the diagnostic data collected is captured in the correct folder.
SQLDIAG . Function result: 87. Message: The parameter is incorrect.
SQLDIAG Invalid SQL Server version specified. SQL Server version
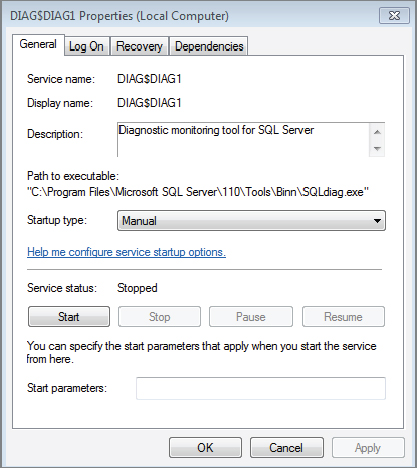
11 is not supported by this version of the collectorThe above message signifies that an older version of SQLdiag was used to connect to a SQL Server 2012 instance. When you start the SQLdiag service, it uses the parameters specified during service registration to collect the required data based on information present in the configuration file. You can view events reported by the SQLdiag service by looking at the Windows Application Event Log, shown in Figure 11-4.
Configuring and Running SQLdiag on a Failover Cluster
When configuring a data collection package for a SQL Server failover cluster instance with Diag Manager, you need to remember a few salient points:
- Specify the SQL virtual server name as Machine Name.
- Specify the SQL Server instance name in the Instance Name text box. For a default failover cluster instance, enter MSSQLSERVER.
- Once you have the package configured, it is a best practice to run the SQLdiag data collection utility from the node that is the current owner of the SQL Server resource.
When running SQLdiag in the default configuration on a multi-instance failover cluster, the command window will show numerous errors in red. This is because the default configuration file, SQLDIAG.XML, has not been changed to collect data from a specific failover cluster instance. SQLdiag automatically detects the cluster and gathers logs and configuration information for every virtual server and instance. Errors are displayed in the command window because SQLdiag attempts to connect to each instance at every virtual server, resulting in several failures.
In this case, either configure the SQLDiag.XML file with the required target’s virtual server name or ignore these errors. If any errors are displayed, they can be safely ignored. Likewise, the log file (##SQLDIAG.LOG) is usually easier to read and interpret to identify errors that can be safely ignored. A few of the ignorable messages actually have the text “you can usually safely ignore this” enclosed in parentheses.
USING SQLDIAG CONFIGURATION MANAGER
If you recognize the term PSSDIAG, then you have been around the SQL Server world for quite some time now and have worked on various SQL Server issues that required Microsoft engineers to collect diagnostic data using the PSSDIAG tool. You would also be familiar with saving PSSDIAG in a secure location and going through the XML configuration file to review the additional data that the PSSDIAG tool collects. In 2011, the Microsoft SQL Server Support team released a public version of the coveted Configuration Manager used for setting up data collection using SQLdiag, available on the CodePlex website, Microsoft’s free open source project hosting site, under the name Pssdiag/Sqldiag Manager. This means that you no longer need to painstakingly modify XML configuration files in a text editor. This tool is provided on an as-is basis by Microsoft. This tool provides you with the capability of using a graphical user interface to configure your data collection rather than having to painstakingly modify a XML configuration file.
The tool has the following prerequisites:
- .NET Framework 2.0
- Windows 2003 Server/XP or above
In order to understand why this tool, hereafter referred to as Diag Manager, is so important to data collection related to SQL Server issues, the following list describes the many ways in which it extends your data collection capabilities:
- It relies on the SQLdiag collector engine to provide a collection of PerfMon, Profiler trace, msinfo32, error logs, Windows event logs, T-SQL script output, and registry exports.
- It ships with a ready-to-use set of custom collectors.
- It provides an interface for cutomization of the PerfMon and Profiler trace collection along with the capability to add your own custom collectors.
- It will package all your files into a single cab file for the machine from which you intend to collect data.
- The custom collectors shipped will collect data that can be analyzed by the SQL Nexus tool.
Diag Manager is a 32-bit tool whose default installation location is as follows:
- 64-bit — C:Program Files (x86)MicrosoftPssdiag
- 32-bit — C:Program FilesMicrosoftPssdiag
Once you have installed Diag Manager, you can find the program under All Programs ⇒ PSSDIAG ⇒ PSSDIAG Configuration Manager.
Configuring SQLdiag Data Collection Using Diag Manager
After launching the tool, the GUI will provide various configuration options, as shown in Figure 11-5.

The arrows in Figure 11-5 show the different configuration options in the UI that enable you to easily customize your data collection. Some of the configuration options will be familiar to you from the “SQLdiag Configuration File Key Elements” list of this chapter.
Now take a look at what the Diag Manager UI allows you to customize. The first task is to select the platform: x86, x64, or IA64 (arrow 10 in Figure 11-5). Then you can choose the SQL Server version using the appropriate tabs. SQL Server 7.0 and SQL Server 2000 configurations (arrow 9 in Figure 11-5) are not supported by this tool.
Now that you know how to select the right platform and SQL Server version, consider some key areas in the tool. The Issue Type section (arrow 3 in Figure 11-5) available in the leftmost pane of the UI is the list of templates you can use for configuring the data collection, with some events and collectors pre-configured. You could start with the sql_default_2008 collector and edit them as appropriate for your data collection needs.
The Connection Info (arrow 1 in Figure 11-5) box is where you provide the machine name and the SQL Server instance name from which you intend to collect the diagnostic data. The full-stop (.) and asterisk (*) for the machine name and instance name, respectively, direct the configured SQLdiag package to collect data from all the SQL Server instances installed on the local machine. The best configuration practice here is to always provide a machine name and an instance name. The considerations mentioned in the section “Configuring and Running SQLdiag on a Failover Cluster” for configuring SQLdiag on a cluster apply here as well.
After providing the machine name and instance name, you can select the authentication used to permit collection of the data, Windows or SQL Server authentication. If you choose SQL Server authentication, you can only provide the username (arrow 2 in Figure 11-5). You will be prompted for the password at runtime. The ##SQLDIAG.log file will contain the following information when you use SQL Server authentication for logging into the SQL Server instance:
Password:
User prompted for password at runtime
SQLDIAG Initialization starting...
The next section is Machine-wide Diagnostics (see Figure 11-6 and arrow 4 in Figure 11-5), which enables you to configure the PerfMon data collection by specifying the following:

- The different PerfMon counters (arrow 4 in Figure 11-5) that you want to collect — By default, a set of counters is pre-populated based on the information present in the selected template. You can enable additional counters that you deem necessary for analyzing your problem scenario. It is always a good practice to collect all the SQL Server Performance Monitor counters so that you do not miss any relevant information required for your data analysis. Furthermore, the overhead of collecting PerfMon data is the lowest compared to the other data collectors.
- The maximum file size and interval at which you want to collect the data samples
- Configuration of the Windows Event Log collection
The next step is to configure the Profiler trace. This can be done using the Instance-specific Diagnostics (arrow 7 in Figure 11-5) section of the tool, used for configuring database engine/analysis server trace (arrow 6 in Figure 11-5) and collection of SQLdiag output. Here you can configure a trace for the database engine and SQL Server Analysis Services instance. Based on the SQL Server version selected, you will see the Profiler trace events populated in the list, which you can configure for your data collection along with the Profiler trace rollover size. Collection of the SQLdiag diagnostic script can be enabled or disabled from this section.
The last section in the Diag Manager is Custom Diagnostics (arrow 5 in Figure 11-5), which provides a list of pre-built custom collectors that are already available for data collection. In addition to this, you can extend the data collection, as described in more detail in the section “Understanding the Custom Diagnostics.” The Instructions (arrow 8 in Figure 11-5) tab at the bottom of the Diag Manager UI provides an explanation of all the Custom Diagnostics options when you click on them.
Adding Trace Filters to a SQLdiag Configuration
Normally, Profiler trace filters are added to a SQL Server data collection to reduce the amount of diagnostic data that is collected by SQLdiag. For example, you could add a filter on SPID to collect only trace events which pertain to a particular Session ID. Note that the text filters add CPU overhead to the data collection as there is a significant CPU overhead for evaluating text-based filters as opposed to integer filters. However, if you collect a Profiler trace using a SQLdiag configuration XML file, then you need to follow these steps:
The following T-SQL Commands can be used toSet a Filter for SPID = 52 for TraceID = 2 once the SQLdiag has been initialized:
select * from sys.traces — To get the trace id
EXEC sp_trace_setstatus 2,0 — Stops the trace but doesn’t delete the trace definition
from the server
EXEC sp_trace_setfilter 2, 12, 0, 0, 52 — Add a filter for SPID = 52
EXEC sp_trace_setstatus 2,1 — Start the trace again
select * from fn_trace_getfilterinfo(2) — Get information about the filters set for the
trace
Understanding the Custom Diagnostics in SQLdiag
This section looks at the different categories of custom diagnostics available out-of-the-box in the Diag Manager. The extensibility of SQLdiag using Diag Manager is a very compelling reason for all SQL Server professionals to add this tool to their repertoire. The T-SQL, VBScript and DOS commands used by the custom diagnostics configurations are available in the C:Program FilesMicrosoftPssdiagCustomDiagnostics folder.
General Custom Diagnostics
The SQL Base custom collector is used to add tasks that should be executed for every type of SQL Server data collection. This custom collector runs before any other custom collector task. One of the group’s primary purposes is to define global parameters that may be of general use in other task groups. This collector also collects basic configuration information from the registry, system configuration information, the status of the PAE switch, and the trace flags active on the target SQL Server instance.
All the output files have the prefix “SERVER_SQL_Base_*.”
The MSINFO custom collector collects the msinfo32 output from the target machine.
The SQL Best Practices custom collector collects outputs of various scripts to check the following:
- NTFS compression on SQL Server database files
- Hypothetical indexes on the databases (if any)
- Use of the /3GB and /PAE switch in the BOOT.INI file
- Information about all the SQL Server Profiler traces active on the target SQL Server instance
All the output files have the prefix “SERVER_SQL_Best_Practices_*.”
SQL 2008 Perf Stats
The most common customization that SQL Server professionals and Microsoft engineers add to SQLdiag is to collect SQL Server blocking diagnostics. You might already be familiar with the configuration option to capture blocking information. This information can be collected using the SQL 2008 Perf Stats custom diagnostic option. This section describes why this custom diagnostic is not just about collecting blocking information on your SQL Server instance as seen below. Note that the scripts available in the download section work for SQL Server 2012 instances as well.
However, if you intend to capture the SQL Perf Stats script manually, then you need to get the latest Perf Stats script, available from CodePlex at http://sqlnexus.codeplex.com/wikipage?title=Sql2005PerfStatsScript&ProjectName=sqlnexus. After downloading it, follow these steps:
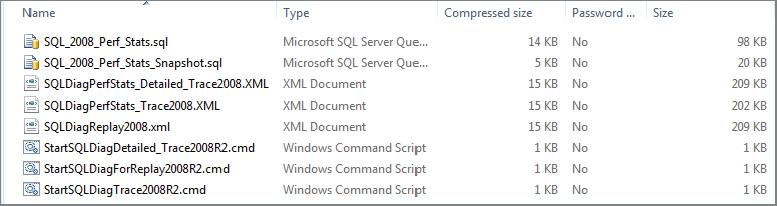
The SQL_2008_Perf_Stats_Snapshot.sql script collects information about your SQL Server instance’s top resource-consuming queries, missing indexes information with the CREATE INDEX scripts along with resource consuming query hashes. Query hash was a new feature added in SQL Server 2008 and later versions to create a hash value for the queries which use different literal parameter values. The output of this script is collected twice: once when SQLdiag starts and once when it is stopped.
The SQL_2008_Perf_Stats.sql script captures various DMV outputs and blocking information periodically using a delay of ten seconds with the WAITFOR DELAY command.
The output of both aforementioned scripts can be imported into a SQL Server database using the SQL Nexus tool for data analysis. The bonus here is the fact that this custom diagnostic also collects the output of the System Health Session Extended Event session, which is an Extended Event session that runs by default on SQL Server 2008 instances and later.
Backing Up Diagnostic Data Already Available
The SQL 2008 Backup MDW custom collector performs a backup of any Management Data Warehouse database that you might have configured on the SQL Server instance. When you Save the SQLdiag configuration, a pop-up window will prompt you for the Management Data Warehouse database name, as show in Figure 11-8.

The SQL Dumps custom collector collects all the mini-dump (SQLDumpXXXX.mdmp) files, symptom dump text files (SQLDump*.txt) and the exception log file. The collector skips any dump file larger than 10MB and limits the dumps collected to 70MB. The dump files skipped will be the older dump files.
Analysis Services Custom Collectors
The Diag Manager provides four different types of collectors for Analysis Services. Three collectors are specific to a given Analysis Services version, and the fourth is a shared collector that collects general diagnostics from an Analysis Services instance:
- Analysis Services 2000
- Analysis Services 2005
- Analysis Services 2008
- Analysis Services Shared
The Analysis Services 2008 and Analysis Services Shared works for SQL Server 2012 Analysis Services installed in the multi-dimensional model. If you are interested in viewing what these collectors collect, you can find details by right-clicking on the collector and selecting the Details option as shown in Figure 11-9.

Feature-Specific Custom Diagnostics
The Diag Manager also provides you with some feature-specific custom collectors that can be very helpful when you are troubleshooting a particular SQL Server scenario or feature.
The Database Mirroring custom collector collects information from various system DMVs and catalogs for the database mirroring configuration and status of the mirrored databases. In addition, the database mirroring collector connects the database mirroring partner and witness to collect the configuration data that it collected from the target instance on which SQLdiag is running. To ensure that all the data is collected, you would need to ensure that the account running the SQLdiag has permissions to collect the database mirroring configuration information from the mirror and witness. Note that there are no new custom collectors available for collecting data specific to Availability Groups for SQL Server 2012 as yet. However, you can write your own collector by defining a new custom collector under the _MyCollectors option discussed later in this chapter.
The Full Text Search custom collector collects the full-text search configuration and the full-text catalog details for each database that is full-text enabled.
The Linked Server Configuration custom collector collects information about the available linked server providers on the target machine, and configuration information about all the linked servers configured on the target SQL Server instance.
The SQL 2005 tempdb Space and Latching custom collector can be used to troubleshoot SQL Server issues pertaining to tempdb contention. The T-SQL script used by this collector collects tempdb usage and statistics in a loop during the entire duration of the SQLdiag data collection. The collector uses the following DMVs and system catalogs to collect the diagnostic information:
- sys.dm_db_file_space_used
- sys.dm_db_session_file_usage
- sys.dm_db_task_space_usage
- sys.sysprocesses
- sys.dm_os_waiting_tasks
The SQL Blocking custom collector enables the trace flag 1222 during the initialization phase of SQLdiag, which ensures that deadlock information is written to the SQL Server Error Log. Note that this collector does not collect blocking information from the target SQL Server instance. Information about the blocking chains observed need to be captured by using the SQL 2008 Perf Stats custom collector.
The SQL Memory Error custom collector collects diagnostic information about the target SQL Server instance’s memory usage, which can be useful while troubleshooting SQL out-of-memory issues.
The SQL Agent custom collector collects all the SQL Server Agent logs and the backup of the MSDB database from the target SQL Server instance. This can result in the output folder becoming very large, and can dramatically increase the time it takes for the SQLdiag shutdown phase, which would be directly proportional to the size of the MSDB database. It is probably a good idea to collect the relevant data from the MSDB database tables if the MSDB database is quite large.
Capturing Extended Events
The XEvents Waits custom collector enables you to configure Extended Events (XEvents) data collection on the target SQL Server instance. By default, the collector has three XEvent sessions for capturing information for page latch waits experienced on the target instance. You can view configuration details of the collector by right-clicking on the XEvent Waits custom collector and clicking Details as shown in Figure 11-10.

For example, assume there is a need to capture wait information for all PAGEIOLATCH waits. PAGEIOLATCH_* waits are encountered when the SQL Server database engine experiences an I/O sub-system related wait condition. Most commonly high wait-times experienced by these wait types signify storage sub-system related latencies. Figure 11-11 shows what the final configuration would look like. This would require the addition of two custom events:

- A startup event that will execute a T-SQL script to create and start the XEvent session that will capture the wait information for all PAGEIOLATCH waits
- A utility-type collector that will execute a T-SQL script when the SQLdiag utility is shut down to collect the data captured by the XEvent session into an XML file
One of the new additions to SQL Server 2012 Management Studio is the UI for Extended Events. You can use the UI to configure your custom Extended Events session. Once the session is configured, it will be available under the Sessions folder, as shown in Figure 11-12.
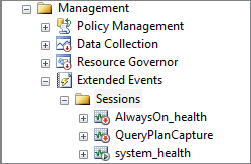
This new addition to Management Studio enables you to extend your customization options by adding an Extended Event collection to your SQL Server data collection arsenal. Once you have configured the required set of events, you can script out the Extended Event session and use the acquired T-SQL script to set up your own XEvent collection while configuring a SQLdiag collection using the _MyCollectors custom collector described in the following section.
Adding Your Own Custom Collectors
Now that you have looked at the myriad of pre-configured data collectors for various scenarios and features, you might be wondering what happened to the specific data collection that was required for an issue you were troubleshooting in your SQL Server environment. If the previously described custom collectors do not satisfy your data collection requirements, then you can configure your own custom collector using the _MyCollectors custom collector.
Consider an example in which you needed to collect the space usage of the folders in the default data folder of SQL Server. This information was to be collected during startup of the data collection using a PowerShell script. The following PowerShell Script will capture the disk space usage for all the folders in the folder specified below:
$startFolder = 'C:Program FilesMicrosoft SQL ServerMSSQL11.MSSQLSERVERMSSQLDATA'
$colItems = (Get-ChildItem $startFolder | Measure-Object -property length -sum)
'$startFolder -- ' + '{0:N2}' -f ($colItems.sum / 1MB) + ' MB'

$colItems = (Get-ChildItem $startFolder -recurse | Where-Object
{$_.PSIsContainer -eq $True} | Sort-Object)
foreach ($i in $colItems)
    {
        $subFolderItems = (Get-ChildItem $i.FullName |
        Measure-Object -property length -sum)
        $i.FullName + ' -- ' + '{0:N2}' -f ($subFolderItems.sum / 1MB) + ' MB'
    }
Assume that the preceding code was saved into a file called space.ps1. Then you would right-click on _MyCollectors and add a Utility task as shown in Figure 11-13.

When data collection is completed, a file named <Machine Name>__MyCollectors_Get_Disk_Space_Shutdown_DiskSpace.OUT would appear in the output folder. If you looked at the configuration file after saving the settings using Diag Manager, you would find that the XML node that has the custom collector configuration would look like the following code snippet:
<CustomDiagnostics>
<CustomGroup name=’_MyCollectors’ enabled=’true’ />
<CustomTask enabled=’true’ groupname=’_MyCollectors’ taskname=’Get Disk
Space’ type=’Utility’ point=’Shutdown’ wait=’OnlyOnShutdown’ cmd=’powershell.exe -File
".space.ps1" -NoLogo -NonInteractive > "PShell_DiskSpace.OUT" ’
pollinginterval=’0’ />
</CustomDiagnostics>Saving and Using a SQLdiag Configuration
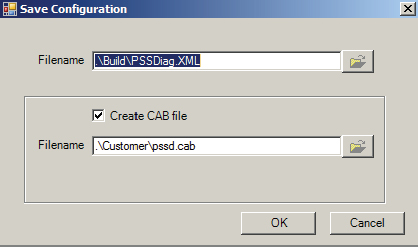
Now that you know how to configure the SQLdiag collection based on the data you need to collect, this section describes how to save the configuration package, as this tool was released to work with SQL Server 2008 R2, 2008, and 2005 versions. When you click the Save button, the dialog shown in Figure 11-14 will appear, providing the location of the cabinet (.cab) file and the XML configuration file. You can change the path of the two files as appropriate.
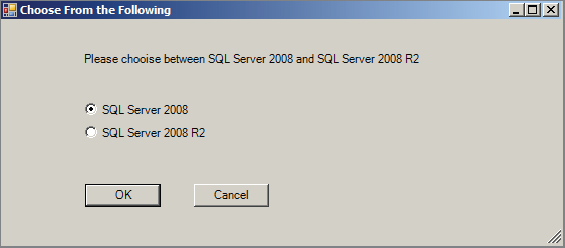
When you click OK, the dialog shown in Figure 11-15 will appear for selecting either SQL Server 2008 R2 or SQL Server 2008, in case you were configuring the data collection using the SQL Server 2008 tab in the Diag Manager.
By default, the cabinet file generated is located at C:Program FilesMicrosoftPssdiagCustomer with the name pssd.cab. This cabinet file stores all the necessary supporting files required to collect the data for all the enabled data collectors configured by you. The pssd.cab file can now be copied to the target machine from which you want to collect the diagnostic data.
When you extract the cabinet file, you will find a pssdiag.cmd file, which calls the SQLdiag executable to collect data using the PSSDIAG.XML configuration file. Before you start the data collection, you need to modify the PSSDIAG.XML file, changing the ssver value to 11 from 10.50, as shown in the following example. This directs the SQLdiag utility to collect diagnostic data from a SQL Server 2012 instance.
<Instance name='MSSQLSERVER' windowsauth='true' ssver="11" user=''>Now you are all ready to collect diagnostic data using SQLdiag by executing the pssdiag.cmd , which is a DOS batch command file, to start the data collection.
EMPLOYING BEST PRACTICES
Now that you have learned the intricacies of using SQLdiag, this section describes a set of best practices that will not only help you collect the right set of data, but also help you minimize the performance overhead of data collection on the target SQL Server instance(s).
One common best practice is to keep multiple configurations of the pssd.cab file already configured for various scenarios, such as high CPU usage, SQL Server timeouts, long-running queries, and so on. This enables you to avoid the hassle of configuring the data collection during a crisis situation. All you would need to do is extract the contents of the cabinet file into a folder and make changes to the PSSDIAG.XML configuration file for the Machine Name, Instance Name, and ssver values. After this quick modification is done, you are ready to collect your required diagnostic data.
Gearing Up for Long-Term Data Collection
Sometimes there is a need to collect data for prolonged periods for intermittent issues whose occurrence is hard to predict. You are forced to run data collection around the clock to ensure that all relevant data is captured for the next occurrence of the issue. This raises the question of when the data collection should be started or stopped. The Diag Manager provides such an option through another custom diagnostic option called Delete Old Trace Files. This custom diagnostic deletes all but the N most recent Profiler (.trc) files and PerfMon (.blg) files. When you click Save in the Diag Manager UI, you are prompted to provide the number of trace and PerfMon files that should be retained, as shown in Figure 11-16. This gives you the flexibility to run data collection for long periods without running out of drive space.
In addition to this, you can exercise other options for long-term data collection that enable you to retain more trace files without running out of disk space:
- Reduce the set of Profiler events being captured. The following section elaborates on this topic.
- Use the /C2 command-line parameter to enable background NTFS compression of the output files generated.
- Consider using the /N, /E, and /L command-line parameter to restart data collection at a specific time every day, with a new output folder created for each restart of the data collection. The older folder can be deleted if the issue for which the data collection was initiated did not occur.
- Consider using SQLdiag’s built-in NT service support. This can be quite helpful when you cannot keep a remote desktop session open on your server for a long period of time. If you are using the command line option to initialize SQLdiag, then you will end up needing to keep a session active so that the console window doesn’t close. By running SQLdiag as a service, you do not have to worry about any such restrictions!
- Add more local disk space. This is an obvious option but it’s not always viable or possible.
The following are not recommended as methods to deal with space constraints on the target machine where you are capturing data:
- Attempting to trace to a network drive or UNC path or using the client-side Profiler UI from a remote machine — This method of tracing is highly detrimental to SQL Server performance and should be avoided at all costs! SQLdiag always captures a server-side Profiler trace. The destination output folder should always be a local drive!
- Attempting to run SQLdiag remotely in an attempt to minimize space usage on the server — This isn’t useful because Profiler traces are always captured locally on the server (even if SQLdiag is running remotely).
Filtering Out the Noise
The prime reason why the size of a SQLdiag data collection balloons out of proportion or the target SQL Server performance degrades while capturing diagnostic data is the high number of redundant or irrelevant Profiler events added to the data collection configuration.
The following list provides guidelines on when to avoid certain Profiler event categories which generate a high number of events when added to the set of profiler events being captured by SQLdiag. This can lead to a high amount of chatter in the trace files captured without adding value to the analysis:
- Broker — None of the events in the Broker category are required unless you are troubleshooting an issue related to Database Mail or Service Broker in SQL Server 2005 or above. However, the Broker event category can generate a lot of noise if you have Service Broker/Database Mail configured on the server and are using it heavily.
- Cursors — If the client application or provider that connects to your SQL Server instance uses server-side cursors, then this event category can lead to an unmanageable amount of data collected that will take you ages to sift through. The sp_cursor* calls will be captured either way in your Stored Procedure event classes, which makes it a moot point to track CursorOpen, CursorClose, and CursorExecute through this event category for general-performance issues. The only useful events in this event category are CursorImplicitConversion (which enables you to track implicit conversion of requested nonsupported cursor types by the SQL Server database engine) and CursorRecompile (which helps you track down T-SQL cursor recompiles due to schema changes). You would want to use the events in this category only when troubleshooting a specific cursor-related issue.
- Locks — This event category generates the highest amount of activity. Lock:Acquired and Lock:Released event classes (if captured) can make your data analysis more difficult than scaling Mount Everest. If you need to track the number of locks for each session, then it is done best outside the Profiler using DMVs such as sys.dm_tran_locks. However, this event category has some useful event classes:
- Lock: Deadlock and Lock: Deadlock Chain — Helpful when troubleshooting deadlock issues on a SQL Server instance
- Lock: Timeout and Lock: Timeout (timeout > 0) — Help troubleshooting timeout-related issues due to lock blocking
- Lock: Escalation — This one is debatable. It helps track down lock escalations but on servers that have a high number of these, this can become a high frequency event.
- OLEDB — Unless you are sure, based on the symptoms shown regarding the issue, that OLEDB calls need to be traced, you shouldn’t be collecting any event from this event category except for OLEDB errors. Therefore, if your OLEDB provider were returning a large number of errors, you would be able to track it down using the HRESULT obtained from this event class.
- Query Notifications — The same logic used earlier for the Broker event category applies to this event category.
- Scans — This might be useful when you are doing a repro of sorts on a test or development environment, but on a production server this is a strict no-no as you will end up collecting more noise than any useful data for analysis purposes! Capturing this event unless and until absolutely required is a very easy way to bloat your profiler trace file size very quickly! You should be able to determine, looking at the plans, whether there was a table/index scan without having to capture a separate noisy event in the Profiler traces.
- Security Audit — This is a very good event category when troubleshooting security or permissions-related issues on a SQL Server instance. For performance-related issues, this is just plain noise! The events under this category are fired nineteen-to-the-dozen on a SQL Server instance, which just bloats your Profiler trace size rather than do anything useful! The two truly useful events in this category are Audit: Login and Audit: Logout, which help track the session’s connection settings and other attributes, such as host name, user name, etc.
- Transactions — This event category also has a lot of noise events that aid more in bloating Profiler trace size rather than doing anything useful. In particular, don’t capture the Transaction Manager (TM:*) event classes unless you are troubleshooting an issue related to Begin/Commit/Rollback that is taking a long time to complete. The SQLTransation event is quite useful for troubleshooting deadlock-related issues, as it helps track transaction begin and commit/rollback and nest levels for a given session. The DTCTransaction event class is useful for troubleshooting DTC transaction, related issues and tracking the different states of a DTC transaction.
- Performance Event — This is one of the most widely used event categories among Microsoft SQL Server Support Engineers for troubleshooting query performance issues. That’s because this event category helps you capture query plans. There are several different event classes in this category for capturing query plans, which can be divided into two types based on data you can obtain from these events:
- Compile-time details — Showplan All, Showplan XML, and Showplan Text (occurs during query execution but does not contain runtime details like rows returned) and Showplan XML For Query Compile and Showplan All For Query Compile (shows the compile-time query plan). These two events can be very useful when you want to capture a query plan for timeout-related issues, as the other events that show the execution time query plans may not be generated when you are dealing with query timeouts. Therefore, if you are not facing any timeouts and need the query plans with runtime details, you need not capture any of the aforementioned events. The Query Compile event classes (especially the XML events) are required when you are trying to nail down compilation-related issues and want to determine the resources (CPU/memory) consumed during query compilation.
- Runtime details — Showplan Statistics Profile and Showplan XML Statistics Profile show the query plan with runtime details in text and XML format, respectively. Based on whether you prefer sifting through text or XML, you could capture either one. XML events are not the best in terms of reducing the size of the Profiler traces captured.
Following are some other high-frequency event classes, which can be excluded as well from your profiler trace configuration unless the issue that you are troubleshooting warrants the collection of these events:
- SP:CacheMiss, SP:CacheInsert, SP:CacheRemove, and SP:CacheHit — These events are helpful when tracking procedure cache plan caching issues; otherwise, you are going to be dealing with a lot of noise in the Profiler traces if these events are captured, as one of these events occurs every time a plan is looked up in the procedure cache.
- TSQL: Prepare SQL, TSQL: Exec Prepared SQL, TSQL: Unprepare SQL — These are useful for troubleshooting issues with prepared SQL calls from providers but should be avoided unless and until you are confident that the problem is due to how the SQL statement is being prepared.
Alert-Driven Data Collection with SQLdiag
Another way to minimize the amount of time you need to run the data collection utility is to be aware of the symptoms associated with your problem period. Troubleshooting intermittent issues is always tricky; you must tread the fine line between the necessary evil of collecting diagnostic data and running the risk of antagonizing your customers or users with even further degraded performance. The preceding tips can help you avoid unwanted phone calls when you are trying to be the Good Samaritan by helping to get the server back up and running while it is reduced to a crawl due to a performance bottleneck.
An alert eye can spot symptoms like high CPU usage, a high number of lock timeouts, or a high number of blocking chains during a problem period, any of which can become your trigger point to start the data collection. SQL Server Agent can monitor and automatically respond to events, such as messages from SQL Server, specific performance conditions, and Windows Management Instrumentation (WMI) events. The response to such an alert can be a job that starts the SQLdiag data collection through the use of command-line parameters. Not only is this a smart way of collecting data, it will minimize the amount of time you spend praying that the issue will occur while you are staring at a dashboard, monitoring the SQL Server instance’s performance metrics. Unfortunately, Murphy’s Law has a unique way of rearing its head, so the chances are high that the bottleneck that brings your SQL Server instance to its knees will appear at the most inopportune moment possible. You can go one step further and send out e-mails or pager alerts when the data collection begins, to ensure that necessary attention is given to the issue at the correct time.
SUMMARY
SQLdiag, configured properly with the right set of custom collectors, can be a one-stop shop for SQL Server professionals for collecting diagnostic data for analyzing and determining the root cause of complex SQL Server problems. These are the same tools that are used by the Microsoft SQL Server CSS team to collect and analyze data from SQL Server instances that they are troubleshooting. When you add SQL Nexus to the mix, you increase the chances of performing correlated analysis, which is essential for building a sound hypothesis and arriving at the root cause of a SQL Server issue.