
Chapter 10
Viewing Server Performance with PerfMon and the PAL Tool
WHAT’S IN THIS CHAPTER?
- When and how to use Windows Performance Monitor
- Prescriptive guidance on problem counters
- Using PAL for log analysis
- Using other log analysis tools
WROX.COM CODE DOWNLOADS FOR THIS CHAPTER
There are no code downloads for this chapter.
INTRODUCTION
Performance Monitor, often referred to as PerfMon, is a tool that provides performance data useful for narrowing the scope of a problem. This data is frequently used as a first point of call for troubleshooting — providing server-wide diagnostics information, PerfMon can be used to eliminate components as the cause of a problem.
PerfMon is often used interactively to provide a real-time view of server performance and resource utilization (such as CPU, memory, and disk activity). PerfMon may also be useful for post-mortem analysis, whereby logs can be configured to record data continuously, rollover, or start/stop at specific intervals. DBAs often find the tool useful when troubleshooting intermittent problems or identifying a problem outside SQL Server (either a hardware problem or a Windows issue).
Engineers familiar with PerfMon typically know a handful of PerfMon counters that can provide an overview of server performance and health. Experienced engineers, well practiced with PerfMon, often take an iterative approach — adding and removing counters as the scope of a problem becomes more refined and troubleshooting is more focused.
It’s important to know when and how PerfMon can be useful, as it provides different data from SQL Profiler, extended events, or dynamic management views (DMVs).
Users unfamiliar with PerfMon often look at the data generated in the performance log and ask numerous questions about it, such as the following: Is x value acceptable? Why is my system running so slow? What does “normal” look like? How can I tell if there’s a problem? This chapter will help you answer such questions in three ways:
- By providing and explaining the key counters and thresholds for issues
- By helping you gather a baseline from a healthy server
- By demonstrating the tools available to assist in analyzing performance logs
After reading this chapter you should have a good understanding of how to use PerfMon, including which counters to monitor and what values are acceptable. Additionally, you’ll be aware of a selection of tools and utilities to help with log analysis.
PERFORMANCE MONITOR OVERVIEW
PerfMon provides server-wide real-time and logged performance monitoring. First introduced with Windows NT 4.0, the core features and user interface have barely changed from the first Microsoft Management Console (MMC) snap-in. In Windows Server 2003 the tool was renamed to System Monitor, although the data logging functionality of System Monitor retained the name Performance Monitor. In Windows Server 2008, PerfMon was incorporated into Reliability and Performance Monitor.
You can use Performance Monitor for many common tasks:
- View real-time performance data on your server.
- See performance data represented visually.
- Record performance data over an extended time frame.
- Quantify the performance impact of hardware or software changes.
- Save and export performance data.
- Fire alerts based on performance thresholds.
- Compare performance data from different servers.
- Capture a baseline set of performance counters for trending and troubleshooting over time.
Reliability and Performance Monitor
PerfMon in Windows Server 2008 brings a new look and a new name for the parent snap-in, Reliability and Performance Monitor, although real-time performance monitoring retains the PerfMon name.
Reliability and Performance Monitor comprises three components: Monitoring Tools, Data Collector Sets, and Reports. This chapter focuses on Performance Monitor and Data Collector Sets. Monitoring Tools comprises Performance Monitor (PerfMon), which is the tool of choice when investigating server-wide or resource problems; and Reliability Monitor, which reports on system stability.
Resource Overview
Once Reliability and Performance Monitor is launched, the Resource Overview screen is displayed showing real-time performance data. The Resource Overview provides a visual representation of each of the four key hardware elements: CPU, Disk, Network, and Memory. Each element can be expanded to reveal a list of processes, listed in descending order by resource type; for example, when CPU is expanded, all processes are listed ordered by Average CPU descending, as shown in Figure 10-1.
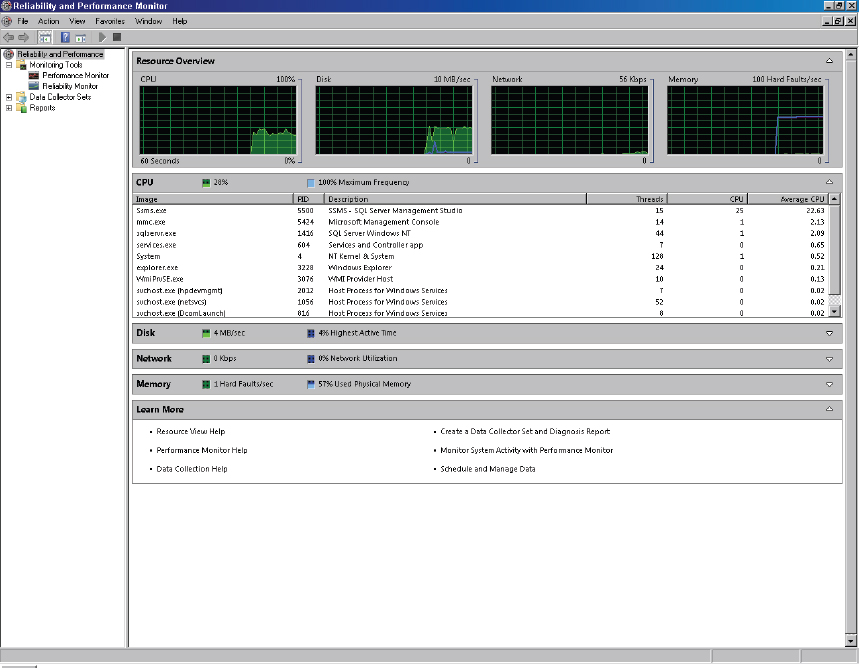
In addition to the four individual performance graphs displayed across the top of the Resource Overview, each resource element displays two mini-performance bars. It’s worth noting that for CPU, when looking at this on your own PC, the green bar displays the current CPU utilization and the blue bar displays the maximum CPU frequency. Some computers may have maximum CPU frequency less than 100% when operating in energy-saving modes. If you’re interested in reading further — there’s more detail on CPU performance and powersaving mode in Chapter 2. The Memory resource element displays hard (page) faults per second in the green bar (more on hard page fault later in this chapter), and the percentage of physical memory in use is shown in blue.
Data Collector Sets
Data Collector Sets combine all the information necessary for common problem diagnostics, including event tracing, performance counters, and configuration (Registry and WMI classes). Administrators can create Data Collector Sets with providers enabled for trace and counter data. Once a collector set has been defined, it is stored in Reliability and Performance Monitor. This enables starting and stopping the collector at any point in the future without recreating it, or it can be controlled on a schedule.
Three pre-defined system Data Collector Sets are included: LAN Diagnostics, System Diagnostics, and System Performance. Each collects performance counters, trace data, and system configuration for common troubleshooting scenarios.
Reliability Monitor
Reliability Monitor provides a system stability chart. Here, events such as hardware failures, or application or Windows failures, are tracked against a timeline. The data presented by Reliability Monitor provides access to failure activity information, plotted against a time chart to facilitate correlation between failure events and system activity (software installation or uninstallation, etc.).
The chart displayed by Reliability Monitor plots the System Stability Index, a rating system reflecting reliability where 10 is a stable server and 1 is considered an unstable server. The purpose of the System Stability Index is to assist in correlating a decrease in system stability with a specific change (such as a new device driver or a hotfix installation).
PerfMon Usability in Windows Server 2008
There are some user interface enhancements for PerfMon in Windows Server 2008 (compared with Windows Server 2003 and earlier). There are relatively minor changes between Windows Server 2008 and the R2 release; this section contains a summary of the highlights.
Auto-Scaling Counters
In early versions of Windows Server, counter values were often either off the top of the PerfMon graph or dwarfed by other counters — neither situation enabled users to easily see changes in these values. This made scaling counters a painful process of trial and error, as each counter had to be selected in turn in an attempt to choose a reasonable value to scale the counter by. The process was made much simpler in Windows Server 2008 because users could select a group of counters, right-click, and choose “Scale selected counters.” Windows then adjusted the scale of each counter to a reasonable value so that all lines are plotted in or around the middle of the graph.
Show/Hide Counters
Another minor but useful enhancement to PerfMon in Windows Server 2008 enabled the showing or hiding of counters on the graph. This is useful when monitoring in real time because many counters can be captured and fewer can be displayed. Showing and hiding counters means the data (including min, max, and average values) is still recorded but it can be displayed as needed, which is also faster than adding counters.
New PerfMon Counters for SQL Server 2012
As shown in Table 10-1, a number of new PerfMon counters are available in SQL Server 2012. Some of these provide logging for new features such as AlwaysOn and FileTable, and some are more detailed counters related to memory utilization.
First introduced in SQL Server 2008, the Deprecated Features PerfMon counter provides a chance to capture deprecated features, reducing the risk of issues with future projects when upgrading from SQL Server 2012. Deprecated features are features that still operate although they will be removed in a future version.
TABLE 10-1: New PerfMon Counters for SQL Server 2012
| COUNTER | DESCRIPTION | |
| Availability Replica | Bytes Received from Replica/sec | Total bytes received from the availability replica |
| Bytes Sent to Replica/sec | Total bytes sent to the availabilty replica | |
| Bytes Sent to Transport/sec | Total bytes sent to transport for the availabilty replica | |
| Flow Control Time (ms/sec) | Time, in milliseconds, messages waited on flow control in the last second | |
| Flow Control/sec | Number of flow control initiated in the last second | |
| Receives from Replica/sec | Total receives from the availability replica | |
| Resent Messages/sec | Number of messages being resent in the last second | |
| Sends to Replica/sec | Total sends to the availability replica | |
| Sends to Transport/sec | Total sends to transport for the availability replica | |
| Batch Resp Statistics | Batches >=000000ms & <000001ms | Number of SQL Batches with a response time greater than or equal to 0ms but less than 1ms |
| Batches >=000001ms & <000002ms | Number of SQL Batches with a response time greater than or equal to 1ms but less than 2ms | |
| Batches >=000002ms & <000005ms | Number of SQL Batches with a response time greater than or equal to 2ms but less than 5ms | |
| Batches >=000005ms & <000010ms | Number of SQL Batches with a response time greater than or equal to 5ms but less than 10ms | |
| Batches >=000010ms & <000020ms | Number of SQL Batches with a response time greater than or equal to 10ms but less than 20ms | |
| Batches >=000020ms & <000050ms | Number of SQL Batches with a response time greater than or equal to 20ms but less than 50ms | |
| Batches >=000050ms & <000100ms | Number of SQL Batches with a response time greater than or equal to 50ms but less than 100ms | |
| Batches >=000100ms & <000200ms | Number of SQL Batches with a response time greater than or equal to 100ms but less than 200ms | |
| Batches >=000200ms & <000500ms | Number of SQL Batches with a response time greater than or equal to 200ms but less than 500ms | |
| Batches >=000500ms & <001000ms | Number of SQL Batches with a response time greater than or equal to 500ms but less than 1,000ms | |
| Batches >=001000ms & <002000ms | Number of SQL Batches with a response time greater than or equal to 1,000ms but less than 2,000ms | |
| Batches >=002000ms & <005000ms | Number of SQL Batches with a response time greater than or equal to 2,000ms but less than 5,000ms | |
| Batches >=005000ms & <010000ms | Number of SQL Batches with a response time greater than or equal to 5,000ms but less than 10,000ms | |
| Batches >=010000ms & <020000ms | Number of SQL Batches with a response time greater than or equal to 10,000ms but less than 20,000ms | |
| Batches >=020000ms & <050000ms | Number of SQL Batches with a response time greater than or equal to 20,000ms but less than 50,000ms | |
| Batches >=050000ms & <100000ms | Number of SQL Batches with a response time greater than or equal to 50,000ms but less than 100,000ms | |
| Batches >=100000ms | Number of SQL Batches with a response time greater than or equal to 100,000ms | |
| Database Replica | File Bytes Received/sec | Amount of filestream data received by the availability replica for the database |
| Log Bytes Received/sec | Amount of logs received by the availability replica for the database | |
| Log remaining for undo | The amount of log in kilobytes remaining to finish the undo phase | |
| Log Send Queue | Amount of logs in kilobytes waiting to be sent to the database replica | |
| Mirrored Write Transactions/sec | Number of transactions that wrote to the mir-rored database in the last second, that waited for log to be sent to the mirror | |
| Recovery Queue | Total number of hardened log in kilobytes that is waiting to be redone on the secondary | |
| Redo blocked/sec | Number of times redo gets blocked in the last second | |
| Redo Bytes Remaining | The amount of log in kilobytes remaining to be redone to finish the reverting phase | |
| Redone Bytes/sec | Amount of log records redone in the last sec-ond to catch up the database replica | |
| Total Log requiring undo | The amount of log in kilobytes that need to be undone | |
| Transaction Delay | Number of milliseconds transaction termination waited for acknowledgement per second | |
| FileTable | Avg time delete FileTable item | Average time, in milliseconds, taken to delete a FileTable item |
| Avg time FileTable enumeration | Average time, in milliseconds, taken for a FileTable enumeration request | |
| Avg time FileTable handle kill | Average time, in milliseconds, taken to kill a FileTable handle | |
| Avg time move FileTable item | Average time, in milliseconds, taken to move a FileTable item | |
| Avg time per file I/O request | Average time, in milliseconds, spent handling an incoming file I/O request | |
| Avg time per file I/O response | Average time, in milliseconds, spent handling an outgoing file I/O response | |
| Avg time rename FileTable item | Average time, in milliseconds, taken to rename a FileTable item | |
| Avg time to get FileTable item | Average time, in milliseconds, taken to retrieve a FileTable item | |
| Avg time update FileTable item | Average time, in milliseconds, taken to update a FileTable item | |
| FileTable db operations/sec | Total number of database operational events processed by the FileTable store component per second | |
| FileTable enumeration reqs/sec | Total number of FileTable enumeration requests per second | |
| FileTable file I/O requests/sec | Total number of incoming FileTable file I/O requests per second | |
| FileTable file I/O response/sec | Total number of outgoing file I/O responses per second | |
| FileTable item delete reqs/sec | Total number of FileTable delete item requests per second | |
| FileTable item get requests/sec | Total number of FileTable retrieve item requests per second | |
| FileTable item move reqs/sec | Total number of FileTable move item requests per second | |
| FileTable item rename reqs/sec | Total number of FileTable rename item requests per second | |
| FileTable item update reqs/sec | Total number of FileTable update item requests per second | |
| FileTable kill handle ops/sec | Total number of FileTable handle kill opera-tions per second | |
| FileTable table operations/sec | Total number of table operational events pro-cessed by the FileTable store component per second | |
| Memory Broker Clerks | Internal benefit | The internal value of memory for entry count pressure, in ms per page per ms, multiplied by 10 billion and truncated to an integer |
| Memory broker clerk size | The size of the the clerk, in pages | |
| Periodic evictions (pages) | The number of pages evicted from the broker clerk by last periodic eviction | |
| Pressure evictions (pages/sec) | The number of pages per second evicted from the broker clerk by memory pressure | |
| Simulation benefit | The value of memory to the clerk, in ms per page per ms, multiplied by 10 billion and trun-cated to an integer | |
| Simulation size | The current size of the clerk simulation, in pages | |
| Memory Node | Database Node Memory (KB) | Amount of memory the server is using on this node for database pages |
| Foreign Node Memory (KB) | Non NUMA-local amount of memory on this node | |
| Free Node Memory (KB) | Amount of memory the server is not using on this node | |
| Stolen Node Memory (KB) | Amount of memory the server is using on this node for purposes other than database pages | |
| Target Node Memory (KB) | Ideal amount of memory for this node | |
| Total Node Memory (KB) | Total amount of memory the server has com-mitted on this node |
Getting Started with PerfMon
PerfMon is a component of Reliability and Performance Monitor which can be launched from Start ⇒ All Programs ⇒ Administrative Tools. Alternatively, just type perfmon into the Run box and press Enter.
As mentioned earlier, PerfMon is a Windows monitoring tool, and as such it can be used to monitor any application — from Microsoft Exchange to Windows itself. When an application is installed, performance counters are registered and you can monitor the counters in real time or trace them to a log file. PerfMon isn’t designed specifically for SQL Server, so you need to add the relevant Windows and SQL Server counters to a log file in order to view resource utilization and SQL Server activity.
Monitoring Real-Time Server Activity
One of the most common uses for PerfMon is viewing real-time server activity. PerfMon provides data instantly on system workload, performance, and resource consumption. By reading the data presented by PerfMon, you can rapidly narrow the scope of a problem.
Within Reliability and Performance Monitor, select Performance Monitor from the Monitoring Tools folder. You’ll be presented with a line chart plotting percentage of processor time from your own computer, as shown in Figure 10-2. In this section, you’ll add a few counters to get a feel for CPU, disk, and memory activity on your PC.

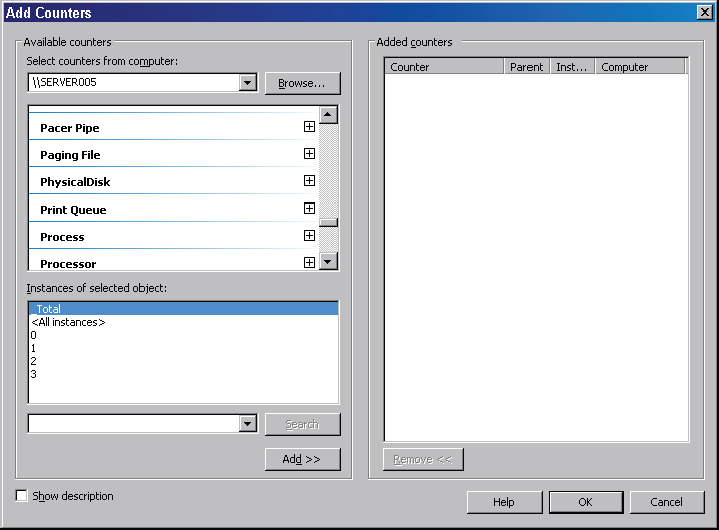
Right-click anywhere in the chart area and choose Add Counters. From here you can choose from hundreds of counters to monitor! Scroll through the list of counters until you see Memory and expand the Memory counter. Select Available Mbytes and click Add. Next, scroll to locate the LogicalDisk counter and select Avg. Disk sec/Transfer. If you have multiple disks, select each disk individually from the instance list and click OK as shown in Figure 10-3.

The counters will be added to the performance graph immediately and as the red timeline moves across the screen, each counter will be populated with data.
Note a couple of pointers: Organize the columns so you can read each row more easily; press Ctrl+H to enable highlighting for a selected counter — this means the line graph is highlighted. Select all counters, right-click, and choose Scale Selected Counters to ensure they are all displayed within the screen.
Mostly you’ll want to monitor a server (rather than your own workstation), and it’s possible to use PerfMon to monitor a remote server by typing the server name from the Add Counters dialog. If you’re adding a lot of counters, the graph can become a little unwieldy because individual counters become difficult to read. If so, you have three options: Remove nonrequired counters, hide nonrequired counters (uncheck Show button), or use a report view instead of the line graph (select Report from the mini drop-down on the top menu bar).
Starting Out with Data Collector Sets
Data Collector Sets are groups of data-gathering tools. They can include kernel tracing, performance logs, and configuration data. Three Data Collector Sets are provided out-of-the-box, including a system performance collector that consists of a kernel trace and a PerfMon log. To utilize a pre-defined data collector, select Data Collector Sets ⇒ System, right-click System Performance, and select Start.
The system performance collector runs for 60 seconds. When collection has finished, navigate to Reports ⇒ System ⇒ System Performance, and choose the latest report. As shown in Figure 10-4, the report presents data in a very readable layout.

The System Performance report begins with a summary of the four key resources: CPU, Disk, Memory, and Network. Figure 10-4 shows memory utilization at 94% and the diagnostic results indicate excessive paging and low memory, recommending either adding more memory or reducing system load. The Resource Overview section shows memory status with a red traffic signal, highlighting a memory issue.
The small effort required to start the system performance collector, wait 60 seconds, and launch the report results in a conclusive initial investigation. In this case, the top process shown in the memory summary is SSMS (SQL Server Management Studio), and the next step would be to identify the problem session and resolve the issue.
Working with Data Collector Sets
In addition to the provided Data Collector Sets, you can also create user-defined Data Collector Sets consisting of your own counters and settings. Real-time monitoring is great when a quick snapshot is required, but it can be difficult to identify patterns and trends when observing a server “live.” It’s usually more convenient to capture performance data to a file and then analyze that log file — either manually or using one of the tools you’ll look at later in this chapter. This section walks through configuring a user-defined Data Collector Set to monitor system performance.
User-defined Data Collector Sets in Windows Server 2008 replace the Performance Logs and Alerts from Windows 2000/2003 but the principle is the same. To access them, from Reliability and Performance Monitor select Data Collector Sets. Right-click User Defined and choose New ⇒ Data Collector Set. A short wizard launches to create the new collector set. The first choice is to create from a template or create manually. Creating a collector set from a template provides three template collectors: Basic, System Diagnostics, and System Performance. You can use these templates as a starting point, adding and removing counters as required. Because these templates are Windows-generic, there’s nothing especially interesting about them from a SQL Server perspective. Therefore, choose the second option, Create manually (Advanced), and give the new collector a useful name, as shown in Figure 10-5.

The next step is to select Create Data Logs or Performance Counter Alerts. In most situations you’ll use the Performance Counter data log because you will likely be interested in gathering some system-wide performance data, rather than use PerfMon to fire an alert when a threshold is exceeded. Three types of data can be captured in the data log, as summarized in Table 10-2.
TABLE 10-2: Data Collector Set Logging Options
| LOG TYPE | DESCRIPTION |
| Performance counter | Provides performance data for most aspects of Windows and SQL Server |
| Event trace data | Uses event tracing for Windows to provide low-level operating system tracing |
| System configuration information | Captures Registry keys |
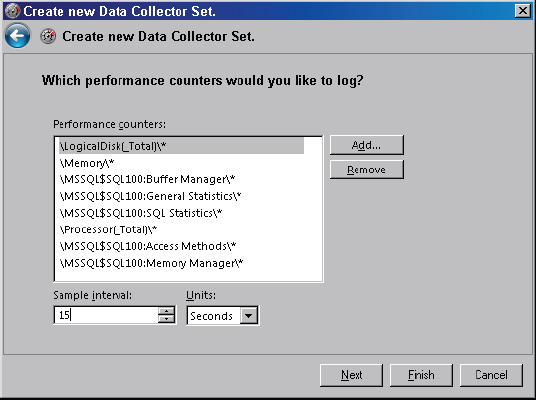
After selecting Create Data Logs, select the Performance counter log type and click Next to continue. Now you’ll add a small selection of interesting counters to get an overview of system performance. Click Add, and select all counters as shown in Figure 10-6. Leave the sample interval at 15 seconds; the impact of the sampling interval is covered in the next section.
After adding the counters, select a folder to store the trace data. Ensure there is sufficient space on the disk to hold the trace file (the size depends on how long the trace is running but normally 2GB of free space should be fine for a few hours of tracing). Click Next when you have entered a location for the logs. At the final confirmation dialog, click Finish to create the collector.
Starting, Stopping, and Scheduling Collectors
At this point, the data collector has been defined, but no data has actually been captured because the collector has not been started. To start a collector, right-click on the collector name and choose Start. Collectors with no stop condition configured will run until they are stopped manually. To stop the collector, right-click on the collector name and choose Stop. Collectors can be started and stopped as a whole, but performance logs or traces within a collector cannot be started independently of the collector. Define a new collector if this is required.
You can schedule collectors using the Schedule tab on the collector properties. When combined with a stop condition, both starting and stopping a collector can be fully scheduled.
Configuring Collector Properties
There are two points of interest in the properties dialog. One is the Directory tab, where you can change the folder used to store the log files. The other is the Stop Condition tab, which enables administrators to configure the duration of the collector — in seconds, minutes, hours, days, or weeks. Once the time configured in the stop condition has elapsed, the collector is automatically stopped.
Other points of interest on the collector properties dialog include the Schedule tab, which as it suggests enables administrators to schedule the start of the collector. There’s also a Task tab, where you can configure a task to run when the data collector stops, such as sending a MSG (new version of NET SEND) on completion.
Configuring Properties for Performance Counters
You may have noticed that there is no place in the collector properties to add or remove PerfMon counters — that’s because they are found in the Performance Counter properties. Because collectors can contain multiple data sources (listed in the right-hand pane), these properties are specific to each log type. Locate the Performance Counter log (usually named DataCollector01) and double-click it to show the properties.
Use the Performance Counter properties to modify log parameters, such as adding and removing counters, and changing log format and sample interval. The File tab contains further settings, including a checkbox to prefix log files with the computer name; this is particularly useful when comparing logs from multiple servers because it saves time opening files to identify the source server.
PerfMon Log Formats
There are four options for PerfMon log format: Comma Separated, Tab Separated, SQL, and Binary. The Binary log (BLG) type is the default and is suitable for most situations. Choosing SQL will require a data source name (DSN) to connect to SQL Server. There are some performance considerations when using this method because you want to limit the impact of monitoring to genuine users or server activity, and outputting trace data to the same instance being monitored is unlikely to help. Performance log files can be imported into a database post-capture for easier/better analysis, so avoid logging directly to SQL Server, unless there’s a good reason to do so and you’re confident you understand any impact on the monitored instance.
Using the Relog.exe tool it’s possible to manipulate log files, converting files between types; and if you’re working with large log files, you can narrow the time frame or extract some interesting counters.
Remotely Running PerfMon
Like many server management tools, an instance of PerfMon can be connected to a remote server for remote monitoring. This avoids the need to connect via Remote Desktop and may reduce the overhead of monitoring on the target server.
To run PerfMon against a remote server, when adding counters, specify the target server name, replacing <Local computer> in the “Select counters from computer” drop-down box (see Figure 10-7). In order to use PerfMon remotely, you’ll need to be a Local Administrator on the target server, and the remote registry service should be running.
Factors to Consider When Running PerfMon
Monitoring servers adds overhead but it can be necessary. All data capture tools impose some cost to the target server. Our challenge is to resolve an incident (often performance related) while minimizing the overhead. When monitoring, you should consider performance implications with a view to reducing overhead and minimizing two main risks:
- Making problems worse
- Affecting data capture
PerfMon counters are themselves updated by the application, even when not consumed by PerfMon. Therefore, any performance overhead with PerfMon is only usually encountered when polling (or sampling) these counters and when writing these to disk if a collector has been set up.
The overhead of using PerfMon to monitor normal servers with regular workload is typically minimal. Performance becomes a discussion point when monitoring servers operating in time-sensitive environments (e.g., trading or reservation platforms) or with servers suffering acute performance problems — those in which the monitoring overhead could tip the server over the edge.
Because reading PerfMon counters is the only real overhead of concern, you should consider network time and disk activity during monitoring. If you can perceive performance degradation when running PerfMon, you can quickly and easily stop logging and measure any performance improvement.
The Impact of Running PerfMon
PerfMon is a lightweight tool and its impact on any given server is partly related to how PerfMon is configured, but it is also dependent on the workload of that server while PerfMon is running. To illustrate this scenario, consider two servers: Server A is suffering under heavy workload with 99% CPU utilization and poor disk performance, while server B currently runs with 20% CPU and good disk response times. In this case, it’s likely that the impact to server A is greater because PerfMon could consume 1% or 2% available CPU capacity, whereas that same amount added by PerfMon to server B will have negligible detectable impact.
Many organizations attempt to reduce the risk and impact to systems by monitoring during periods of low activity — e.g., during lunch or late afternoon — when user volumes and activity are typically lower, but this is usually the worst idea! It is essential to capture data while the problem is happening, not on either side of the problem (typically when concurrency is at its peak). Additionally, the worse the problem, the easier it is to spot. Often problems are accentuated with user activity, so if they’re more likely to occur and be worse when they do happen, you’ve got the best chance possible to capture a log containing them.
There are three key factors to consider when determining the impact of PerfMon: sample interval, number of counters, and disk performance. The following sections take a brief look at each.
Sample Interval
The sample interval controls the frequency with which PerfMon polls counters to read their values. The more often PerfMon samples, the greater the impact to the server and the more log data generated. The default is 15 seconds, which is usually fine when tracing for a few hours only; when tracing over longer periods, reducing the sample interval reduces both the overhead of PerfMon and the size of the file generated.
Consider a situation in which you have a busy system with a high workload but very short transactions — sampling every 60 seconds could miss many of these very short transactions. The sample interval can affect the shape of the data, so always be aware of it and the overall monitoring window when reviewing performance logs, especially when looking at min, max, and average values. Take into account system activity and usage patterns to ensure that the log is representative of typical workload.
Number of Counters
A consideration with similar impact to sample interval, more counters results in a higher cost to sample and store those counter values. Most instance counters have a _TOTAL counter, which is a total of the individual counter instances combined. In some cases, such as for disk counters, this total is of limited use, as usually the details about each disk (instance) counter are required to identify disk performance problems. The total can hide problems, because an average might look healthy; but a very busy disk could be masked by several other disks with little activity.
Disk Performance
When capturing performance data using Data Collector Sets, consider where the log files will be stored. The objective is to minimize the impact to SQL Server; log performance data to a file on disk (not a database); and, where available, use a disk that will not contend with any databases — i.e., avoid any disks where data or log files are stored.
PerfMon logs grow in a linear and predictable pattern (unlike SQL Profiler trace files, which are workload dependent); for example, sampling 100 counters every 15 seconds for 5 minutes might create a 2MB PerfMon log file, so it would be reasonable to estimate that logging 100 counters for six hours would generate a 144MB log file. Generally, I try to avoid capturing data to a system drive, as the implications of filling that drive are much greater than when logging to a nonsystem drive.
Servers Suffering Very Poor Performance
When capturing PerfMon logs on servers with acute performance problems, run PerfMon as cautiously as possible to reduce the impact while still harvesting performance data. Here are some guidelines:
- Run PerfMon remotely.
- Reduce the sampling interval.
- Include as few counters as possible.
- Log to disk.
Common PerfMon Problems
You may sometimes encounter problems with PerfMon itself — specifically, counters could be missing, they might not be displayed correctly, or there could be problems connecting to servers remotely. This section contains a brief summary of some common issues and how to resolve them.
Using PerfMon on 64-bit Systems Using WOW
When running x64 Windows with x86 SQL Server, you’re using Windows on Windows (WOW), which means x64 Windows is emulating an x86 environment to host x86 SQL Server. If you’re using x64 Windows and x64 SQL Server, this section isn’t relevant to you.
When PerfMon runs on an x64 host, none of the counters pertaining to x86 applications are available because the x64 PerfMon cannot load x86 counters. You can overcome this by launching the x86 version of the Microsoft Management Console (MMC) with the PerfMon snap-in. Run the following to launch the PerfMon x86 from an x64 Windows computer:
mmc /32 perfmon.mscRemote Monitoring Fails
If you’re trying to monitor remote servers without any success, the most likely cause is permissions problems. Try the following troubleshooting tips:
- Ensure that the account is local administrator on the target server.
- Confirm NetBIOS access to the target server.
- Ensure that the remote Registry service is running on the target server.
- Ensure that no local security policy or Active Directory group policy is restricting access.
SQL Server Counters Are Missing
When you open PerfMon, you might find that there are no SQL Server counters available in the counter list. This problem occurs more often on clustered instances. If counters are missing, check the SQL Server Error Log and the Windows Event Application log to determine whether any errors are logged regarding the failed counters. If there are no errors in either log, you can unload the counters as follows:
unlodctr mssqlserverOnce the counters have been unloaded, verify the path to sqlctr.ini and use the following command to reload the counters:
lodctr C:Program FilesMicrosoft SQL ServerMSSQL10.1MSSQLBinnsqlctr.iniAs with any change, test the process on a nonproduction server to gain confidence in the process (even if there is no problem on the test server, you can still test the commands). After reloading the counters, if they still aren’t listed, use the following process to rebuild them.
Counters Are Missing or Numbers Appear Instead of Names
If when you attempt to add performance counters the list contains numbers instead of counter names, the counters could have been corrupted by a process incorrectly modifying the Registry. This problem can be overcome by rebuilding the counters, a process explained in detail in Microsoft KB article 300956 at http://support.microsoft.com/kb/300956.
GETTING MORE FROM PERFORMANCE MONITOR
This section builds on the introduction to PerfMon, providing specific counters and prescriptive guidance on acceptable counter thresholds. With so many counters available, it can be difficult to know which to use when; and no single counter is sufficient for making any decisions or recommendations. Typically, a variety of PerfMon counters are used to construct a picture of workload and resource consumption.
This section looks at hardware, operating system, and SQL Server bottlenecks, considering each major component in order of problem likelihood: memory, disk, and CPU. You’ll also learn about SQL Server performance counters in order to provide a plan for using PerfMon to identify specific SQL Server problem conditions.
Bottlenecks and SQL Server
A bottleneck is any resource that significantly restricts database performance. There will always be bottlenecks of one kind or another — the goal is to ensure that no single component significantly delays the entire transaction processing system. Identifying bottlenecks enables you to prioritize your troubleshooting; there may be numerous problems, but a clear and specific bottleneck provides an area of focus. This section examines some different types of bottlenecks and provides some prescriptive guidance that can help you identify resource contention. It’s normal for an active database server to read and write from disk lots where locking and blocking is part of normal usage patterns; however, when any one resource or component consumes a significant portion of query completion time, this could cause a problem.
SQL Server performance is closely related to server performance because query processing duration is dependent on sufficient memory, disk, and CPU performance. SQL Server depends on each of these resources, so they are listed in order of likelihood of causing a problem; but each should be configured correctly and performing well to service SQL Server and provide optimal transaction throughput for the hardware.
Types of Bottlenecks
Most bottlenecks can be categorized as one of two types: configuration-based or schema-based. Each of these categories can cause bottlenecks within each resource type (CPU, memory, and disk). Although there are many potential problem scenarios, most server-wide or instance-wide bottlenecks tend to be configuration-based, whereas database schema bottlenecks are database design issues, specific to an individual database (common issues may include schema normalization, index selection, and statistics).
Configuration-Based Bottlenecks
SQL Server doesn’t require any specialized knowledge to install, and most of the default values are sufficient for most deployments. When performance and scalability are critical issues, many optimizations can be made — both to the operating system and to SQL Server. Knowing which to change and when is key to getting the most from the hardware and SQL Server itself — see Chapter 15 for lots more detail in this area.
Configuration-based bottlenecks include any operating system configuration, such as memory settings, including /3GB and /PAE; I/O performance tuning, such as disk sector alignment; and HBA queue depth optimization. Additionally, there are many SQL Server configuration-based optimizations, such as disk and log file placement, database auto-growth settings, and any sp_configure options.
Schema-Based Bottlenecks
Schema bottlenecks are application-specific, as they relate to the schema of a specific database (whereas configuration bottlenecks are server-wide or instance-wide). In most cases, the best time to optimize the schema is during application design because schema changes have the least impact on the application when it is still under development. Schema-based bottlenecks illustrate why performance testing must be included as an integral part of software build projects, as it can be incredibly difficult to retrofit performance to an application that’s already live.
Schema-based bottlenecks include normalization problems, whereby the schema is either overnormalized, requiring denormalization, or not fully normalized — i.e., the tables contain duplicate data. Additional schema-based bottlenecks include missing or surplus indexes, missing statistics and poor choice of clustering key (such as using a GUID instead or an incrementing identity column).
Prescriptive Guidance
This section includes details about valuable PerfMon counters to include when troubleshooting each resource type, and prescriptive guidance for “healthy” counter values. The prescriptive guidance can serve as a baseline indicator of problems and highlight any significant resource problems early in the troubleshooting cycle, but you should also use other evidence you gather before making a decision or recommendation to form an action plan. As mentioned earlier, no single item of evidence is usually enough to form a complete picture of a problem.
Each section contains a table with details about the main PerfMon counters for each resource group, a description of what to look for, and a value for a problem condition. Finding a counter value that falls within the problem condition threshold warrants further investigation.
Investigating CPU Problems
The availability of CPU cycles to service SQL Server in a timely manner is critical to database server performance. Configuration-based CPU bottlenecks may include max degree of parallelism, the cost threshold of parallelism, and mis-configured CPU hyperthreading. Changing from default configuration and the optimum setting for each of these configuration options is scenario dependent, it can be challenging to be presecriptive and cover all potential scenarios — there are often edge cases and exceptions.
Kernel Mode and Application Mode
It’s important to recognize the difference between kernel mode consumption and application mode consumption because this concept will provide an important and useful indicator when troubleshooting. It applies to both CPU and memory consumption.
Kernel mode refers to internal Windows operating system operations whereby the kernel has unrestricted access to system hardware, such as the full memory address range, external devices, and so on.
Application mode (also known as user mode) is responsible for everything else, including running applications such as SQL Server. All user-mode applications access hardware resources through the executive, which runs in kernel mode. An application requiring disk I/O submits the request through the kernel-mode executive, which carries out the request and returns the results to the requesting user-mode process.
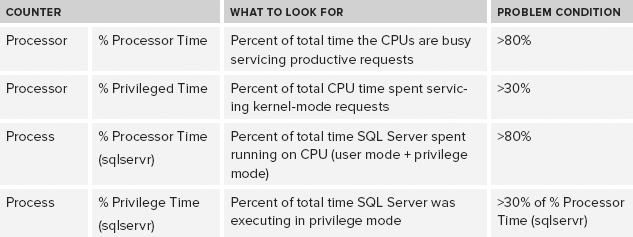
CPU Performance Counters
SQL Servers suffering from performance problems caused by high CPU usage is a common performance issue. It can be easy to identify the high-consumption Windows process as sqlservr.exe using Task Manager, but the counters shown in Table 10-3 will provide additional information to assist in troubleshooting further.
The performance data should be captured for at least a few minutes to ensure the sample is representative. If there is an intermittent problem or when gathering a baseline, a longer data capture period will result in more meaningful results.
TABLE 10-3: Key CPU PerfMon Counters
Common Causes of CPU Problems
This section describes three common causes of high CPU usage conditions:
- Missing Statistics or Outdated Statistics — The Query Optimizer is dependent on relevant statistics to determine a good execution plan. Therefore, missing or outdated statistics could cause the Query Optimizer to select a sub-optimal plan, causing excessive CPU consumption.
- Missing Indexes — A lack of useful indexes can result in a high-CPU condition. SQL Server is dependent on meaningful indexes to retrieve data efficiently, and missing indexes often cause excessive CPU utilization. A lack of useful indexes can result in expensive operations, such as hash joins and sorts that could be avoided with improved indexes.
- Excessive Recompilation — Poor plan reuse can cause a high-CPU condition whereby SQL Server consumes excessive CPU cycles while generating query plans. Recompilations can be caused by ad hoc or dynamic queries or by a lack of memory (procedure cache), causing plans to be dropped from cache.
Investigating Memory-Related Problems
SQL Server performance is closely related to the availability and performance of sufficient memory. SQL Server configuration-related memory settings include the following:
- sp_configure
- Min/max server memory
- AWE Enabled
- Min memory per query
- Windows
- /3GB, /USERVA, /PAE (in 32-bit environments)
- Lock Pages in Memory privilege
Typically, using the Windows Task Manager doesn’t provide the best measure of the memory consumed by SQL Server. Using PerfMon is a more reliable method of measuring memory consumption, since this includes all types of memory allocation that can be made by SQL Server. You can also refer back to Chapter 3 for more details on memory.
Types of Memory Pressure
SQL Server can suffer from internal or external memory pressure, and understanding how to identify and troubleshoot each will enable more targeted troubleshooting. External memory pressure occurs most often when SQL Server is running on a shared computer and several processes are competing for memory. In this situation, Resource Monitor within SQL Server Operating System (SQLOS) receives a signal from Windows to request that SQL Server reduce its committed memory. This causes SQL Server to recalculate its target commit level, and reduce it if necessary.
Internal memory pressure occurs when multiple SQL Server resources compete with each other for memory. This typically causes SQL Server to shrink the data cache, which can impact server performance. Use the DBCC MEMORYSTATUS command to gain visibility of SQL Server memory consumption.
Virtual Address Space
Every Windows process has its own virtual address space (VAS), the size of which varies according to processor architecture (32-bit or 64-bit) and the operating system edition. The VAS is a fixed-size resource that can be exhausted (even on 64-bit computers) while physical memory is still available.
Memory Performance Counters
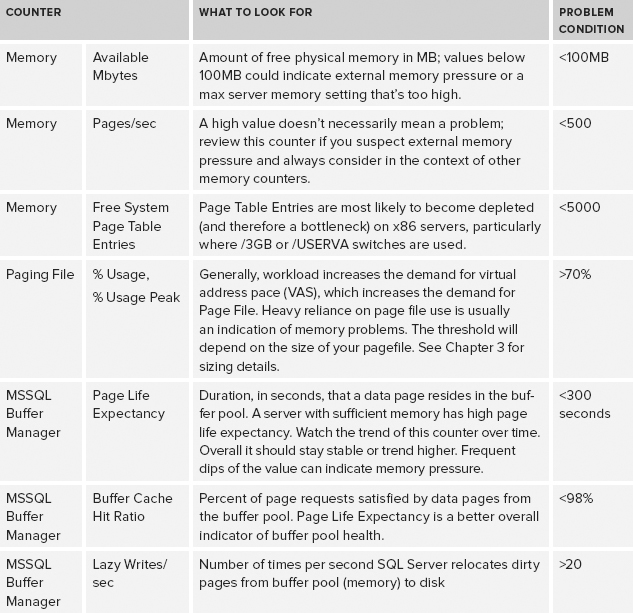
Table 10-4 outlines the PerfMon counters that are key to gathering information about memory availability and consumption.
TABLE 10-4: Key Memory PerfMon Counters
Disk or Storage-Related Problems
SQL Server read/write performance is closely related to the ability of Windows to retrieve and write data pages to disk efficiently. Efficient and timely data access is dependent on both configuration-based and schema-based factors, such as data and log file sizing and placement, useful indexes, and index fragmentation.
Disk and storage performance can be a hugely complex and protracted exercise, and one that is often confused by unclear terminology and logical abstractions that make it hard to identify root cause. However, regardless of storage hardware, disk layout, or path configuration, the only aspect of real interest is the time required to read or write from disk because this is a great indicator of whether disk access performance is likely to cause SQL Server problems.
Typically, once disk access has been identified as a bottleneck, tools more specialized than PerfMon must be employed to provide a lower level of detail on bottlenecks. Most SAN vendors provide performance-monitoring tools that help diagnose issues with storage controllers, cache performance, and physical disk service time. These tools provide further diagnosis on the over-utilized component and performance bottleneck.
Disk performance problems have wide and varied potential resolutions, including extensive disk reconfiguration, such as changing RAID level, disk group membership, and strip size. You can also make many enhancements within SQL Server, including right-sizing data and log files; pre-allocating space; and, for very large databases, table partitioning. Table 10-5 describes the main PerfMon counters to check for disk performance.
TABLE 10-5: Key Disk PerfMon Counters

SQL Server Performance Problems
Sometimes server hardware resources do not cause bottlenecks, but application performance is still bad. In this situation, it’s possible that internal SQL Server resources can become exhausted or depleted. Table 10-6 describes the principal counters for monitoring internal SQL Server resources.
TABLE 10-6: Key SQL Server PerfMon Counters

Wait Stats Analysis
SQL Server wait stats record the amount of time SQL Server spends waiting for each resource. A number of these wait types are exposed as PerfMon counters:
- Lock waits
- Log write waits
- Network I/O waits
- Non-page latch waits
- Page I/O latch waits
- Page latch waits
- Waits for the worker
Although it may be easier to access these wait stats from the DMVs within SQL Server, collecting them as part of a system-wide data-gathering exercise with PerfMon minimizes the logistics effort involved in collecting the information.
Getting a Performance Baseline
A performance baseline is simply a PerfMon log from a time frame representing “normal” performance, retained for future review. The PerfMon log should contain counters that build a complete picture of hardware and SQL Server resources during a representative workload period.
The performance baseline can provide answers to questions that an individual would otherwise be unable to answer. On occasions when there are any performance problems, the baseline is available for comparison; and by mapping the SQL Server batch requests per second against other values, it will be possible to identify and compare problem server activity per workload with the workload of a known good data capture.
The baseline should be continually maintained; otherwise, configuration changes or tuning optimizations could alter the output and invalidate any comparison. It’s useful to get into the habit of taking a fresh baseline on a regular basis.
PERFORMANCE ANALYSIS OF LOGS
The Performance Analysis of Logs (PAL) tool is a free utility for analyzing PerfMon counter logs and creating reports highlighting important areas by severity. The report color-codes counters to display problem areas based on thresholds defined by subject matter experts in the support teams at Microsoft.
It was written and is maintained by Clint Huffman, a Premier Field Engineer at Microsoft, and supports most major Microsoft server products. It reduces the amount of time required to review and analyze PerfMon logs by automating this analysis, saving you time by quickly highlighting potential problem areas requiring further investigation.
Getting Started with PAL
PAL is available from Microsoft’s open-source community project, CodePlex. PAL has been tested on computers running Windows 7 × 64 and using the English-US locale. It can run on x86 operating systems, but x64 is recommended when processing large log files.
The tool was originally developed using VBScript, COM, the Microsoft Log Parser tool, and the Microsoft Office 2003 Web Components (OWC11). The latest version of PAL at the time of writing is 2.3.2; it has three prerequisites, each is free and publicly available:
- Windows PowerShell 2.0 or greater
- .NET Framework 3.5 Service Pack 1
- Microsoft Chart Controls for .NET Framework 3.5
You can download PAL from http://pal.codeplex.com.
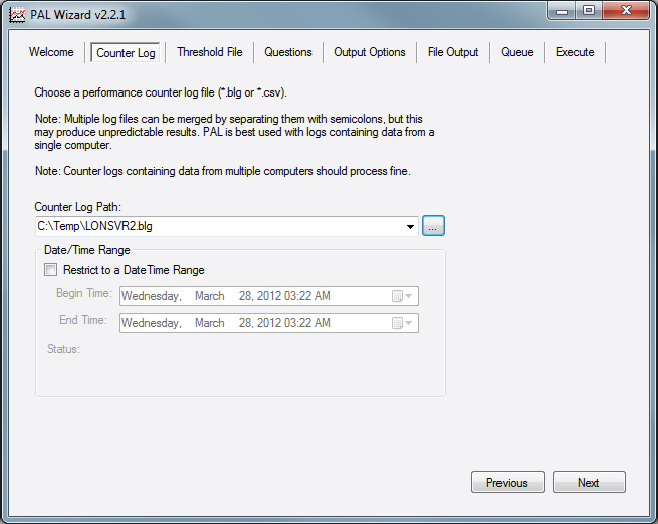
After you have downloaded and opened PAL, the tabs located across the top of the utility act as steps in the wizard. Navigating through each of these steps and populating the required information is all that is necessary to process a PerfMon log. The following steps will help get you started with PAL:

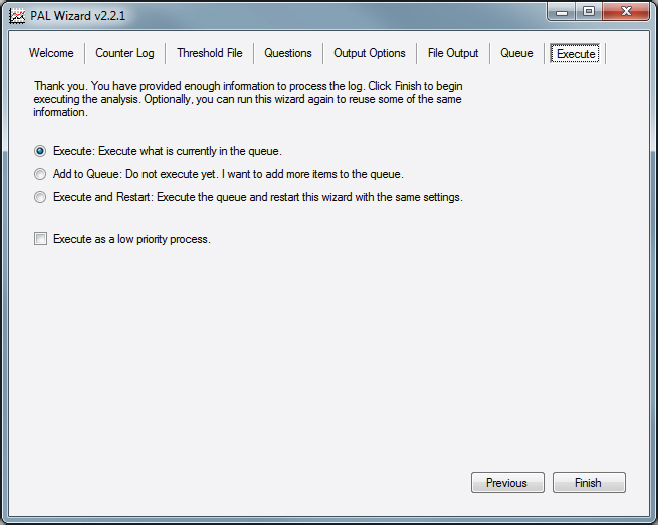
Once the PAL tool has finished, an MHT file will be displayed in Internet Explorer containing the results. To get an idea of what this process entails, a recent 254MB log file analyzed by PAL on a quad-core computer took around 45minutes to analyze.
The report produced by PAL analyzes performance metrics for the key hardware resources: Processor, Network, Disk, Memory, and SQL Server. The report is color-coded to help you quickly identify problem areas.
OTHER PERFMON LOG ANALYSIS TOOLS
This section evaluates common tools for managing, manipulating, and interpreting PerfMon logs. Because PerfMon logs can be saved or converted to comma-separated value (CSV) files, there are many options for data analysis, including loading the file into SQL Server, or analyzing it with Microsoft Excel or almost any other data manipulation tool.
Using SQL Server to Analyze PerfMon Logs
Analyzing large quantities of performance logs with SQL Server can be a useful solution when data analysis through other methods could be cumbersome and labor intensive. The data load process from CSV files could simply make use of the ad hoc Import/Export Wizard launched from SQL Server Management Studio, or alternately this process could be automated and scheduled.
SQL Server can’t read the native binary log file (BLG) file type, so you should either write PerfMon logs to a log file as a CSV file type or use the Relog utility to convert the file post-capture (more detail to follow) from BLG to CSV. It is also possible for PerfMon to log directly to a SQL Server database through a DSN, although there is additional overhead with this process, which can be avoided by logging to file.
Analyzing PerfMon logs from within a database has the benefit of data access through the familiar language of T-SQL, which means problems should be easier to identify, and you can write queries looking for specific problem conditions. Here’s an example where three counters could be used to identify a low-memory condition:
- Available memory less than 100MB
- Page life expectancy less than 60 seconds
- Buffer cache hit ratio less than 98%
If the PerfMon logs have already been imported into SQL Server, the following query could be used to identify any instance during the data capture window when the low memory condition existed:
SELECT *
FROM subset
WHERE Mem_Avail_Bytes < 1000000
AND Buff_Mgr_PLE < 60
AND Buff_Cache_Hit_Ratio < 98
This example should be modified to reflect the table and column names specified during the data import, but the concept could be adapted for any number of scenarios. Additionally, this method could be used to manage performance data across a number of servers, and Reporting Services could be used to present the data.
Combining PerfMon Logs and SQL Profiler Traces
A feature first available in SQL Server 2005 was the capability to combine PerfMon logs with SQL Profiler traces. Using Profiler to combine logs in this way enables the viewing of T-SQL code that’s running on the server, combined with the hardware impact of running the code, such as high CPU or low memory.
The combined view presents a time axis that can be navigated, by selecting a moment when a CPU spike occurred; the Profiler trace automatically relocates to the T-SQL that was executing at the time of the spike.
Using Relog
Relog can be used to create new log files with a new sampling rate or a different file format than existing PerfMon logs. Relog was first included in Windows XP, and it can be useful when handling large logs or many surplus counters are included. Additionally, there are situations when a log contains data for many hours but the time frame of interest is much shorter; Relog can assist in extracting the interesting time window for easier analysis. Table 10-7 shows a summary of Relog parameters.
TABLE 10-7: Summary of Relog Parameters
| OPTION | DESCRIPTION |
| -? | Displays context-sensitive help |
| -a | Appends output to the existing binary file |
| -c <path [path ...]> | Filters counters from the input log |
| -cf <filename> | Filters file listing performance counters from the input log. The default is all counters in the original log file. |
| -f <CSV|TSV|BIN|SQL> | Specifies the output file format |
| -t <value> | Writes only every nth record into the output file. The default is to write every record. |
| -o | Specifies the output file path or SQL database |
| -b <dd/MM/yyyy HH:mm:ss[AM|PM]> | Begin time for the first record to write into the output file |
| -e <dd/MM/yyyy HH:mm:ss[AM|PM]> | End time for the last record to write into the output file |
| -config <filename> | Settings file containing command options |
| -q | Lists performance counters in the input file |
| -y | Answers yes to all questions without prompting |
The following sections demonstrate three example scenarios in which Relog would be useful, including the syntax used.
Extracting Performance Data for a Specific Time Window
This technique can be useful when using PerfMon to log over many hours or days. Were a problem to occur, for example, at 10:30 a.m. on March 15, it would be useful to extract the time frame from 10:00 to 11:00 to provide a manageable log size, without losing any data points. The command looks as follows:
Relog Server001_LOG.blg -b 15/03/2012 10:00:00 -e 15/03/2012 11:00:00 -o
Server001_LogExtract.blg
Extracting Specific Performance Counters
Sometimes monitoring tools or other engineers gather logs containing extraneous counters. In these situations, you can extract specific counters for analysis using Relog. The Relog parameter -c enables counters to be specified. In the following example only the memory-related counters would be extracted to a newly created log file:
Relog Server001_Log.blg -c "Memory*" -o Server001Memory_Log.blgFurthermore, it is possible to perform more complex filtering by passing Relog a text file containing a subset of counters from the original performance log. The following command can be used to extract those counters specified in filter file from the original log:
Relog Server001_Log.blg -cf CounterList.txt -o Server001Overview_Log.blgThe preceding example requires CounterList.txt to contain a single counter per line with the counters to be extracted.
Converting Log Files to New Formats
PerfMon creates log files in a binary log format (BLG) by default. In some situations it can be desirable to convert a performance log to a new format to enable applications other than PerfMon to read the log. For example, this can be useful when importing the data to SQL Server or analyzing performance in Excel. The following example shows how to convert the BLG file to a CSV file:
Relog Server001_Log.blg -f CSV -o Server001_Log.csvUsing LogMan
LogMan can be used to schedule the starting and stopping of logs. This can be a useful alternative to using the Windows AT scheduler or the scheduler functions available within PerfMon. The great benefit of using LogMan is that you can centrally control the start and stop of Performance monitoring. Using LogMan, it’s possible to define a data collector and copy that collector to multiple servers from a single, central location. Table 10-8 summarizes the LogMan command-line actions. The syntax is as follows:
TABLE 10-8: Summary of LogMan Usage
| VERB | DESCRIPTION |
| Create | Creates a new data collector |
| Query | Queries data collector properties. If no name is given, all data collectors are listed. |
| Start | Starts an existing data collector and sets the begin time to manual |
| Stop | Stops an existing data collector and sets the end time to manual |
| Delete | Deletes an existing data collector |
| Update | Updates properties of an existing data collector |
| Import | Imports a Data Collector Set from an XML file |
| Export | Exports a Data Collector Set to an XML file |
logman [create|query|start|stop|delete|update|import|export] [options]The following example creates a collector named DBOverviewLog, which contains all Processor, Memory, and LogicalDisk counters with a sample interval of 30 seconds and a max log file size of 254MB:
Logman create counter "DBOverviewLog" -si 30 -v nnnn -max 254 -o
"D:logsDBOverview" -c "Processor(*)*" "Memory(*)*" "LogicalDisk(*)*"
Table 10-9 describes the four options available with LogMan, including the useful -s parameter, which enables the collector to be created, started, and stopped on remote computers.
TABLE 10-9: LogMan Options
| OPTION | DESCRIPTION |
| -? | (a) Displays context-sensitive help |
| -s <computer> | (b) Performs the command on the specified remote system |
| -config <value> | (c) Setting file containing command options |
| -ets | (d) Sends commands to Event Trace Sessions directly without saving or scheduling |
Using LogMan it’s possible to script collection for a baseline data set from an entire application environment. This could be incredibly useful when doing performance testing, baselining application performance, or troubleshooting live problems.
Using LogParser
LogParser is a simple to use yet powerful tool for log file analysis, popularized for analyzing logs from IIS web servers. LogParser can be used to examine a range of log types and can provide output in various forms. Once installed, LogParser enables pseudo-SQL querying of log files! This can be great when searching Windows Event Logs, IIS logs, or PerfMon logs.
LogParser is part of the Windows Resource Kit and available as a standalone download from www.microsoft.com/en-us/download/details.aspx?displaylang=en&id=24659. PerfMon logs must be converted to CSV (using Relog) prior to analysis with LogParser.
SUMMARY
This chapter provided you with details on when and how to use PerfMon to capture server performance data. You read specific guidance on prescriptive counters to help identify common issues with poorly performing SQL servers. Additionally, the chapter provided guidance on using the PAL tool to analyze performance logs, as well as other log manipulation tools such as Relog, LogMan, and LogParser for log analysis.