
14
Developing and Deploying Visio Services Analytics Applications
Visio Services provides a seamless integration between Visio 2010 diagrams and SharePoint 2010. Diagrams originally created on the Visio desktop application can now be shared and viewed in the SharePoint web application. Visio has been a more widely accepted tool for Business Intelligence since Visio 2007 when the ability to bind data to Visio shapes was added. This gives users an easy-to-understand view of their data.
When publishing to SharePoint, Visio Services takes the .vsd files that are created in Visio and converts them into a new .vdw format, which is how SharePoint stores the diagrams until viewing. When a request is made for a diagram through SharePoint, Visio Services again converts the .vdw file into a Silverlight file so it can properly be viewed in a web browser. When deploying to SharePoint the developer simply saves the file as a .vdw file and then SharePoint does the rest of the heavy lifting behind the scenes, requiring little additional work by the person deploying the diagram or the person attempting to view it in SharePoint.
In Lesson 7 you learned how to configure and create the Visio Services application. You also learned how to handle different security measures that are necessary when working with Visio Services. This lesson is devoted to creating and publishing content in Visio 2010, which can then be deployed to SharePoint 2010.
Two key features of Visio Services are discussed in this lesson: data binding and interactivity. Having a data binding diagram can allow users to visualize live data through any diagram created. Interactivity is what gives a diagram life. This allows users to interact with a diagram by clicking elements that have been activated by the diagram creator. This lesson also shows you how you can deploy your finished product to SharePoint 2010.
CREATING A DIAGRAM WITH DATA CONNECTIVITY
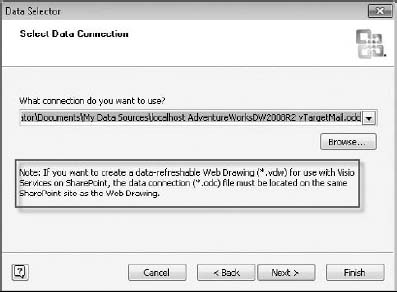
Getting data connected to diagrams is the key element in how you will make Visio a relevant part of your Business Intelligence solution. Data can be connected to Visio diagram shapes from a variety of data sources including Excel, Access, SQL Server, SharePoint lists, or any OLE DB or ODBC source. A wizard walks you through the steps of making a connection, which creates an .odc file similar to how Excel does when connecting to a data source. It is important to note that if you intend to automate the data refresh of your Web Drawing in SharePoint that the .odc file must also be located on the same SharePoint site, which the connection wizard will inform you as shown in Figure 14-1.
Depending on the type of diagram template selected, you will find that displaying your data can be rather simple. Some templates allow for Visio to aggregate source data, whereas others only permit displaying data as it appears in the source. This means you may have to do some data preparation if you chose a template that does not allow Visio to perform aggregations. For example, if your source is SQL Server, you may create an SQL Server View to display the data exactly how it is needed in the diagram you are creating.
To get started, open Visio 2010 and on the File tab select New. Here you can either create a blank diagram on your own or select a template. The fastest way to get started is by using the PivotDiagram under the Business category, which will use your data to automate the process of creating hierarchies in your data. The PivotDiagram also allows you to aggregate data directly inside Visio, unlike many other templates that strictly display data as it appears in the data source.
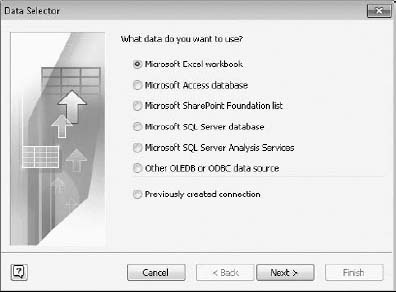
Immediately after selecting the PivotDiagram a wizard opens that walks you through the steps to connect to your source data. Figure 14-1 shows the selection screen for the data source that will be used in the diagram. Notice that Analysis Services can be used as a data source when using the PivotDiagram, but cannot be used when connecting to shapes in other templates.
After selecting the desired data source click Next to provide the connection information for the selected source. For example, if you select SQL Server you will provide the server where the source database is located. After providing this information you will be able to select the database and tables that you will use for the diagram. You can choose specific tables or bring in all tables from the database and then click Next. Click Finish to finalize the PivotDiagram wizard. This will create the .odc file that stores the connection string information. Now that the connection file is created you will have the option to select the file just created or another one created previously. Click Finish. When you click Finish if you had not previously selected the table you want to use in this connection, you must select it at this point. This is another reason why you may choose to create SQL Server Views for Visio because you must select only one table here.
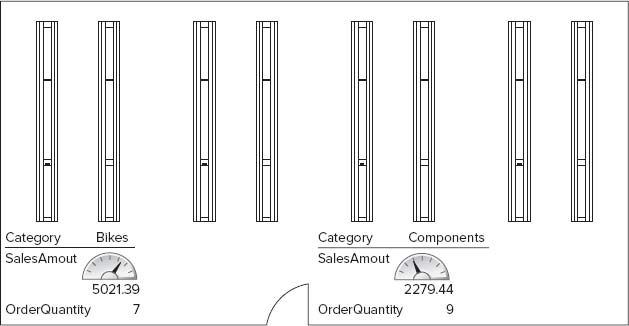
This will provide you with an empty diagram where you can select Add Category or Add Total to begin creating the diagram. Items from the Add Category section will add hierarchy levels and items from the Add Total section will add aggregations. Figure 14-3 shows a completed PivotDiagram.

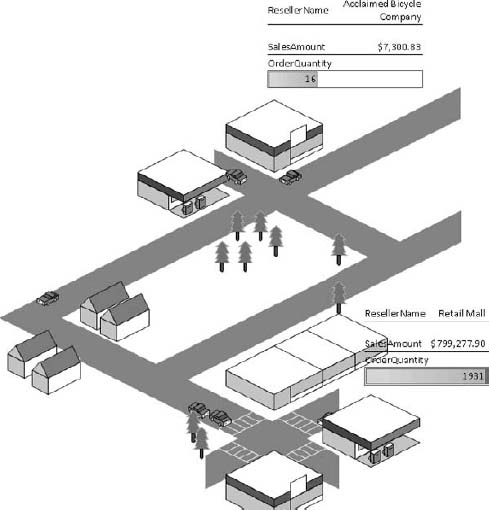
As previously mentioned, a PivotDiagram is the fastest way to display data in Visio, but data can also be linked to diagrams that had no previous data linkage. For example, you could even have Directional Map diagram and still connect data to it. With the diagram open you can select the Data tab and click the Link Data to Shapes button, which takes you through a similar connection wizard that you had for creating the PivotDiagram. After completing this connection wizard you can link specific rows of data from your source to explicit shapes on your diagram by clicking and dragging the row from the External Data window to the object you want to link. This automatically adds data fields to the diagram. Figure 14-4 shows a Directional Map template designed to display sales for two competing local stores. Optionally, you can change how the data is displayed by right-clicking the diagram data and selecting Edit Data Graphic under the Data section. This allows you to represent the data as text, a data bar, an icon, or color. Figure 14-4 shows data as text and a data bar.
The Data tab also has a feature called Automatically Link, which takes shape fields that exist in your diagram and attempts to automatically map them to a data set that you have imported. This can speed up the process of mapping data to a diagram and prevent you from having to drag each row of data to the appropriate shape.
DEVELOPING AN INTERACTIVE VISIO DIAGRAM FOR SHAREPOINT
Having the ability to see data in a Visio diagram is great, but wouldn't it be better if consumers of the diagram could take action on what they see? If users see something unusual about a store's sales, they would likely want to see more details about that store. You can give them the ability to click shapes in a diagram that can link to any of the following:
- Another page or shape in the current drawing
- A page or shape in another drawing
- A document other than a Visio drawing
- A website, FTP site, or e-mail address
This effect can be created by right-clicking any shape and selecting Hyperlink. You can select the URL or document to link to under the Address property. You can also select a page of another diagram under the Sub-address property. For example, take the diagram shown in Figure 14-4 of the directional map and make the stores clickable. If you right-click the store called Acclaimed Bicycle Company and select Hyperlink, you can begin the diagram link. Click Browse next to the Sub-address property and select the diagram to link. There is already a store diagram created on a second page to link to. After selecting that page from the drop-down box click OK twice to return to the diagram. You can now test the link in Full Screen mode. When you click the shape it takes you to the store diagram shown in Figure 14-5.
DEPLOYING A VISIO DIAGRAM
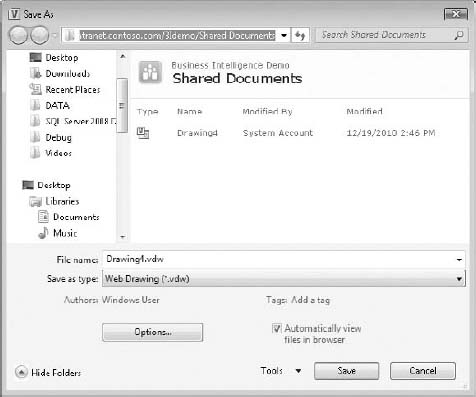
The deployment process is very simple once you are ready to deploy the Visio diagram that you have developed. After choosing a SharePoint site that you would like to save the diagrams to you will need to either select an existing document library or create a new one that you would like to save the .vdw Web Drawings file to. Inside the Visio 2010 desktop application where you have developed your diagram go to the File tab and select Save & Send. This provides the option to Save to SharePoint where you can then browse to the desired document library on your SharePoint server for deployment. Note that Figure 14-6 shows Save As Type changed to Web Drawing (*vdw), which is necessary to make the diagram interactive in SharePoint. If you save the file to SharePoint as a regular .vsd file, you will only be able to manage it as a file without viewing it in the web browser. After clicking Save, the document is deployed and once it completes it immediately opens in your web browser showing the completed deployment.
You can also test that the deployment worked successfully by navigating to the SharePoint document library that you just deployed to and open the diagrams. Figure 14-7 shows the deployed diagram now viewable from the Web. It is important to note that if data links have been established to shapes in your diagram and you would like your data to refresh from the Web that the .odc files must also be deployed. Otherwise the data in your diagrams will be static. The setup and security of these files were discussed in Lesson 7.

TRY IT
In this Try It you create a PivotDiagram that connects to customer data to visualize customer demographics.
Lesson Requirements
To complete this lesson you will be required to have SharePoint 2010 as well as Visio 2010 already installed. The step-by-step example uses the AdventureWorks sample databases, which you can download from www.codeplex.com.
Hints
- Develop a Visio diagram using the PivotDiagram template.
- Use the vTargetMail view from the AdventureWorksDW2008R2 database for the source data.
- Deploy the completed diagram to SharePoint 2010.
Step-by-Step
- Go to Start
 All Programs Microsoft Office Microsoft Visio 2010.
 - After Visio opens select New under the File tab.
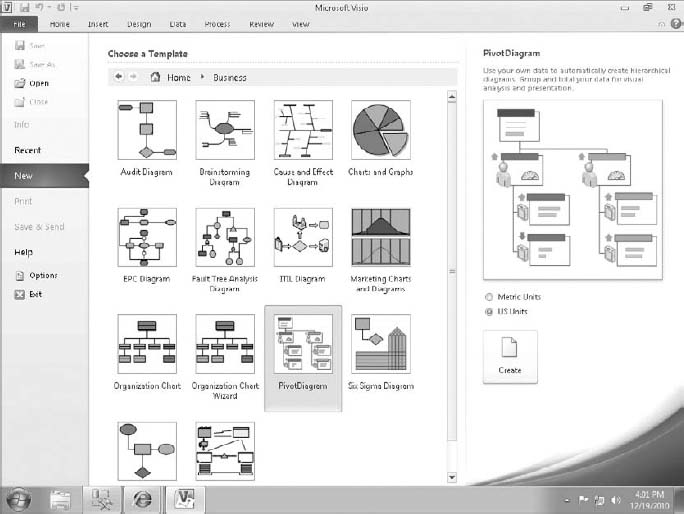
- Double-click the Business template category, then select the PivotDiagram and click Create, as shown in Figure 14-8.
- The Data Selector Wizard automatically opens after you click Create. Choose Microsoft SQL Server Database and click Next.
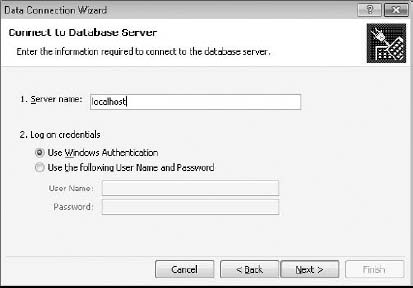
- This opens another wizard called the Data Connection Wizard. This wizard creates the .odc file used for pulling in data. In the Server Name property type the SQL Server that you installed the Adventure Works samples on and then click Next, as shown in Figure 14-9.
- Select the AdventureWorksDW2008R2 database from the “Select the database that contains the data you want” drop-down box.
- Choose the vTargetMail view from the list that is populated after selecting the database and then click Next.
- The last screen of the Data Connection Wizard asks you where you would like to save the .odc file that is created. Select a path you can easily find later and click Finish.
- This returns you to the Data Selector Wizard where you select the .odc file that was just created. Click Next.
- By default all columns and all rows are brought into the diagram but you can optionally remove any columns or rows that you do not need. Leave the default (All Columns) and (All Data) selected and click Next.
- Click Finish to complete the Data Selector Wizard. This will open the designer for Visio with a PivotDiagram pane open to begin selecting the fields you would like to display in the diagram. Figure 14-10 shows the design surface.
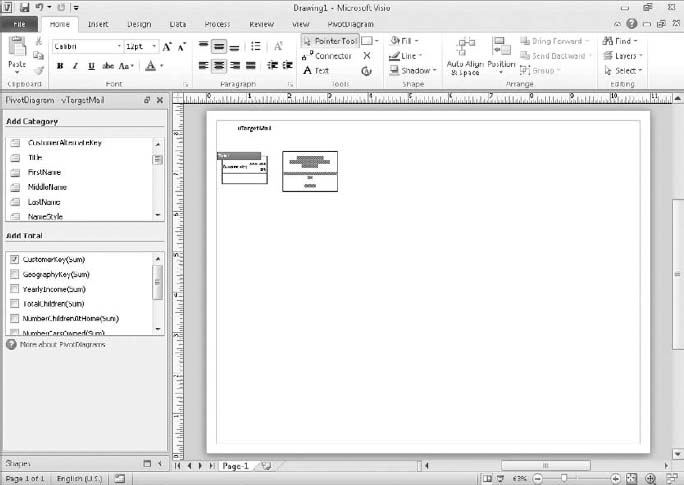
- In the bottom-right corner of the designer you can zoom in and out to get a closer look at what the diagram displays. Right now it shows the CustomerKey summarized.
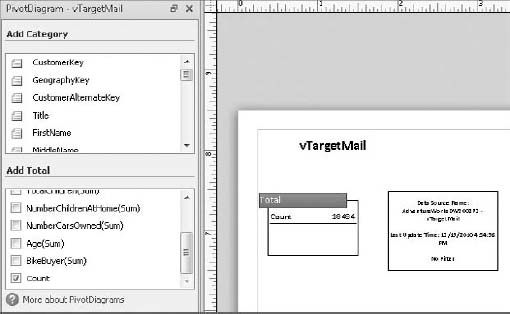
- This is not a number that you would typically summarize. You would more likely like to see this number aggregated using a Count. Conveniently, a Count of all the rows in the data set is already provided. To change this to a Count aggregation uncheck CustomerKey(Sum) in the Add Total section of the PivotDiagram pane, then check Count at the bottom of the list of fields to select, as shown in Figure 14-11.
- From the Add Total list add the YearlyIncome(Sum) field but change it to an average by right-clicking it and selecting Avg.
- Do the same for the Age(Sum) field so you have both average age and average yearly income on your diagram.
- You can adjust the diagram so all fields can easily be read by selecting the shape and expand it by grabbing its edges.
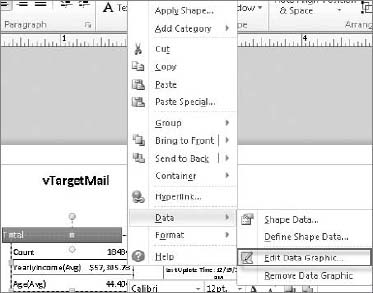
- Change the YearlyIncome(Avg) field on the diagram to be represented by a data bar by right-clicking the field inside the diagram and selecting Data Edit Data Graphic. Figure 14-12 shows the selection.
- This opens the Edit Data Graphic: Data Graphic dialog. Select YearlyIncome(Avg) and click Edit Item.
- In the Edit Item box change the Displayed As property to Data Bar. Also, change the Maximum Value property under the Details section to 100000 and click OK. Figure 14-13 shows these changes completed.

- Click OK again when you return to the Edit Data Graphic: Data Graphic dialog.
- Now to add a few more categories. From the Add Category section of the PivotDiagram pane click Gender and Region in that order.
- The diagram design is now complete and is ready to be deployed to SharePoint. Go to the File tab and select Save & Send.
- Choose the Save to SharePoint option and then click Browse for a location.
- In the file path box in the top of the Save As window type your SharePoint server URL: http://<YourServerName>.
- Select any document library from any SharePoint site (this can be any site created in previous lessons too). Change the Save As Type to Web Drawing (*.vdw) and name the file Lesson14.vdw before clicking Save. Figure 14-14 shows the completed diagram deployed to the SharePoint library.
 If you want to create a data-refreshable Web Drawing (*.vdw) for use with Visio Services on SharePoint, the data connection (*.odc) file must be located on the same SharePoint site as the Web Drawing.
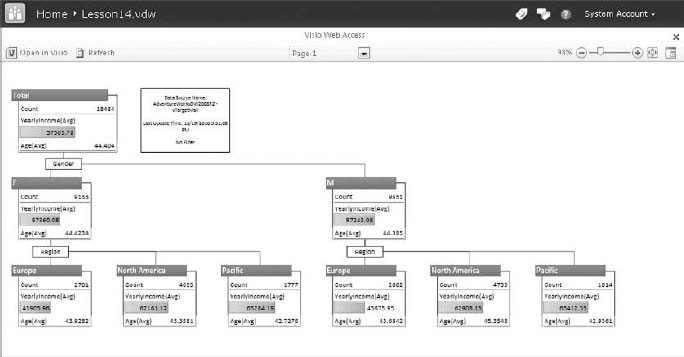
Congratulations! You have created a Visio diagram and deployed it to a SharePoint document library.
 Please select Lesson 14 on the DVD to view the video that accompanies this lesson.