
9. A Wyckoff/Lowry Analysis of the 2000 Market Top
The 2000–2001 Market Top According to the S&P 500
It’s springtime 1999, and all seems right in the stock market. Tech stocks and, in particular, just about anything associated with the Internet are making overnight millionaires. Analysts are projecting the sky’s the limit for earnings, the economy is strong, and grandmothers have turned into day-traders to make a little extra cash and maybe strike it rich. But over the summer, observant investors notice something troubling. The rally in the S&P 500 stalls in mid-July, and on the following pullback into mid-October, something unusual happens. NYSE volume shows a distinct rise as the pullback proceeds. At the same time, the Selling Pressure Index begins to rise, in the process breaking a downtrend dating to October 1998 and suggesting sellers are becoming more active (Figure 9.1). These observant investors are likely already aware of the, by now, protracted decline in the NYSE Advance–Decline Line, warning of a narrowing rally. The lack of breadth behind the rally is also indicated by a drop in the percent of NYSE stocks trading above their 30-week moving average (Figure 9.2).
Figure 9.1. S&P 500; buying power and selling pressure
Charts created with Metastock, a Thomson Reuters product.

Figure 9.2. S&P 500; percent of NYSE issues trading above their 30-WMA
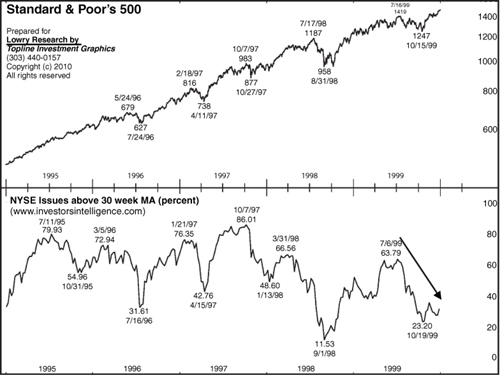
Taken together, the rise in volume and Selling Pressure, plus the divergence by the A–D Line and percent of NYSE stocks above their 30-week moving average suggested the July–October market decline was an indication of Preliminary Supply (PSY).
However, the final push lower in the July–October pullback resulted in prices falling to an area of possible Demand at the January–February trading range (not shown). Buyers who missed out on the rally following that trading range evidently did not want to miss another opportunity, as prices rebounded in an advance that lasted into the end of December. But a couple strange things happened on this rally. Although the S&P 500 continued higher on heavy volume in late November and early October, Selling Pressure began to rise and Buying Power to fall (Point A on Figure 9.3). Volume subsequently dried up dramatically in late December, as was usual due to seasonal factors.
Figure 9.3. S&P 500 at the 2000–2001 market top
Charts created with Metastock, a Thomson Reuters product.

As a result, there was no evidence of any sort of Buying Climax at the market top in early January 2000. However, rather than staying light on the pullback in early January 2000, volume rose sharply, suggesting a significant unloading of stock, characteristic of an Automatic Reaction. But, again, buyers stepped in when prices fell back to support at the sideways trading of late November/early December, producing a rally on continued heavy volume. Despite the heavy volume, this rally failed to move above the highs reached in early January—signs of a Secondary Test (ST). When the rally failed at the early January 2000 high, prices once again turned lower. But volume remained heavy, and Selling Pressure continued to rise on this pullback, suggesting investors were again aggressively unloading stock—a sign of distribution.
After a few days of heavy trading in late February failed to send prices lower (Point B in Figure 9.3), buyers jumped back in. The result was a renewed rally on rising volume that included, on March 16, a 90% Up Day, suggesting buying was reaching panic proportions. But volume quickly dried up, as buyers evidently began having second thoughts about chasing the rally. The result was a short-lived higher high, which quickly failed, characteristic of an Upthrust after Distribution (UAD). After a sharp spike lower in early April failed to hold, a brief effort was made to restart the rally. This proved a weak attempt, as the rally failed below the level of the Upthrust high. This failed rally evidently exaggerated fears the tech bubble was about to burst because selling quickly reached panic proportions with a 90% Down Day on April 14 (Point C) that took prices back to the level of the February and March market lows. But that 90% Down Day evidently temporarily exhausted Supply. At the same time, the Demand that sent prices higher from the February–March lows was evidently still present, resulting in a quick rally.
Despite the rally from the mid-April low, there seems to be ample evidence that buyers were becoming wary of the rally. Thus far, though, the selling had appeared selective and focused on the formerly high-flying technology and Internet stocks on the NASDAQ Exchange. For example, while tech stocks were plummeting, stocks in other industry sectors, such as Utilities, Consumer Staples, Finance or Energy, were holding up rather well. The result was, while the NASDAQ Comp. was moving lower, the S&P 500 entered into a trading range beginning in late April and lasting to late August. The question at this point was whether this trading range represented a period of accumulation or distribution. After all, the plunge in the tech stocks might have served as a safety valve for the market in general, as the excesses were purged, allowing the remainder of the market to resume its rally.
The problem with positive expectations for the S&P 500’s trading range was evident in the performances of Buying Power and Selling Pressure. Apparently, there was little urgency to sell (outside the tech stocks), as Selling Pressure began a slow decline, lasting to September. But at the same time, buyers appeared content to sit on the sidelines, as Buying Power also went into a slow decline.
However, this relatively benign relationship between Supply and Demand was about to change. The S&P 500 made another run at the March highs in mid July 2000, with the rally failing just below the March peak. However, on the subsequent pullback, volume showed a small rise, suggesting sellers were again becoming more aggressive. Any worries about the rise in volume on this pullback were likely compounded by the ensuing August rally, as volume went into a steady decline. This drop in volume may have been seasonal in nature (the summer doldrums), but the apparent lack of Demand left the rally vulnerable to any rise in Supply. And that rise in Supply was forthcoming as the rally to early September 2000 failed slightly above the July high, as there were evidently still plenty of sellers left around that July level. This September high also included a minor buying climax on August 31 (Point D). This panic buying, plus the failure around the July high, gave the rally the characteristics of a Terminal Upthrust (TU).
From this point, the bull market from the 1998 low quickly unraveled. Selling accelerated on the decline in September, with both volume and Selling Pressure steadily rising—evidence of a Sign of Weakness decline (SOW). After a few days of hesitation in late September 2000, the S&P 500 broke sharply lower on October 6 (Point E) in a Break through the Ice. But, once again, prices found support around the levels of the February and April lows. The resulting rebound rally, though, showed only a minimal rise in Buying Power and virtually no loss in Selling Pressure, suggesting active selling into the advance. The rally then failed when it reached the overhead resistance provided by the late September trading range, having retraced less than half the decline from the September high. All this was characteristic of a Last Point of Supply (LPSY). When the decline following the LPSY dropped below support at the February, April, and October lows, it was evident the bear market was now fully underway.
The 2000 Market Top and Bursting of the Bubble in the NASDAQ Comp. Index
The 2000 top for the S&P 500 was a drawn-out process of attrition, but the pain was much more immediate for investors in NASDAQ tech stocks. However, the bull market continued for slightly longer on the NASDAQ, as the Index cruised right along with barely a ripple during the July to October 1999 pullback in the S&P 500. About the worst that can be said is prices moved generally sideways over this period. The NASDAQ Comp. then went into another steep rally with barely any hiccups, at least until early January 2000.
During the first week in January and then again during the latter part of the month, the NASDAQ Comp. Index, however, suffered its first noticeable pullback since late July 1999. What’s more, volume remained relatively heavy on both the early and late January declines. Given what was happening elsewhere in the market, especially with the S&P 500, an alert investor would likely have recognized a possible point of Preliminary Supply (PSY, Figure 9.4). The pause was only temporary, though, as prices again accelerated into another rally on generally rising volume. On March 7, 2000 (Point A), prices surged to a new all-time high on heavy volume. But the rally failed to hold, as the NASDAQ Comp. closed near its low for the day and below the prior two days’ closes. That’s not a bad description of a Buying Climax. Buyers were little dissuaded, as prices quickly rebounded into a renewed move higher. Volume was diminished on this rally, however, which ended on March 10 (Point B) with another spike to a new high although the NASDAQ Comp. closed near its low for the day. This final new high proved to be the last gasp for the bull run in the NASDAQ, though the topping pattern still had several more months to fully play out.
Figure 9.4. NASDAQ Composite Index at the 2000 market top
Charts created with Metastock, a Thomson Reuters product.
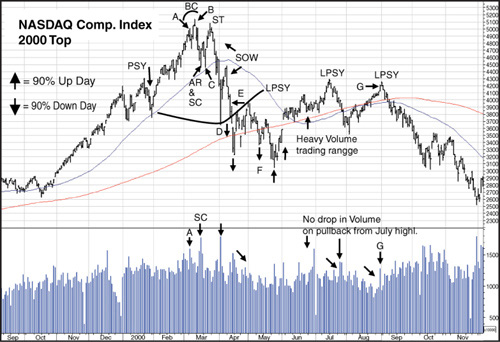
Following the March 10 high, prices swiftly moved lower over the next few days, with volume again reaching climax proportions on March 16, 2000. In this case, the climax was of the selling variety. Given that the apparent Selling Climax (SC) followed a decline of only three days, investors would have rightly questioned its longer term significance. Nevertheless, the level of selling on the pullback to the March 16 low was heavy enough to classify the decline as an Automatic Reaction. Any prognosis that a rebound following the March 16 SC could be short-lived proved accurate, as the rally lasted only one day and was followed by test of the SC low on March 21 (Point C). Volume on this test was much diminished from volume on the SC, suggesting Supply had, at least temporarily, been exhausted.
Prices did, indeed, rebound, but again the rally lasted only three days and served largely as a test of the March 16 high, labeling it as a likely Secondary Test (ST). Volume on the test, though, was substantially less than volume at the March 16 high, suggesting weakening Demand, as buyers were becoming increasingly reluctant to chase prices higher. When prices failed to punch through to new highs, selling again accelerated on a steady rise in volume. The drop from the ST culminated in another apparent SC on April 4 (Point D) on slightly more volume than the March 16 SC. But as was the case in March, the April 5 SC evidently served to only temporarily exhaust Supply, as the subsequent rebound rally failed after only three days.
At this point, it was becoming clear sellers were establishing themselves as the dominant force in the market, using any rebound as an opportunity to unload stock. The speed, expanding daily range and volume of the decline from the late March 2000 high, therefore, appeared to fulfill the requirements of a Sign of Weakness (SOW) decline. About all that was left now was for a break through final support, or a Break through the Ice in Wyckoff terms. The stage was quickly set for this breakdown, as selling intensified in the form of a 90% Down Day on April 12 (Point E), on the approach to key support at the low of the April 4 SC. The actual Break through the Ice occurred on a gap lower and a second 90% Down Day on April 14.
Frequently a second 90% Down Day, occurring quickly after the first, serves to at least temporarily exhaust Supply. And that was the case this time, as the NASDAQ Comp. rebounded over the next couple weeks. However, our alert investor probably noticed volume on this rebound failed to show any significant expansion. To the contrary, volume actually declined—action typical of a rally to the Last Point of Supply (LPSY). This LPSY also served as a test of the Break through the Ice, suggesting the topping process was complete and the NASDAQ Comp. was now ready to fall into a full-fledged bear trend.
Indications the topping process was complete appeared reinforced by yet another 90% Down Day on May 10 (Point F). Although the NASDAQ Comp. quickly recovered, the rebound proved short-lived, as prices again turned lower after running into minor resistance at the four-day trading range from early May 2000. But volume failed to show any significant increase on the subsequent decline, suggesting sellers were in short supply, a suggestion reinforced when prices rebounded from a test of the mid-April low. Hopes the worst was over for die-hard bulls were rekindled in the form of two 90% Up Days (May 30 and June 2) on the rebound rally. These hopes were reinforced when, after a brief hesitation around the level of the April LPSY, prices broke out to the upside. The breakout proved short-lived, as prices fell back during the latter part of June 2000. However, heavy volume during the sideways trading in late June failed to produce any further decline (Wyckoff’s Law of Effort vs. Result), suggesting Demand was increasing. Once again, though, as prices rallied in early July, volume failed to show any significant expansion. The lack of volume suggested this rally represented another move to a LPSY (remember, despite the name, there can be more than one LPSY), especially since the rally failed at the level of the February 2000 reaction lows and just below the early April 2000 rebound high.
The ensuing pullback from the mid-July high and rally to the late August 2000 peak was the proverbial “two-by-four upside the head” for any die-hard, holdout bulls that the great NASDAQ bull market of the past two years was over.
First, volume failed to show any noticeable contraction on the pullback from the mid-July high, suggesting sellers were content to get what they could and were unwilling to wait for higher prices. Second, volume then decreased markedly on the rally to the late August high, further suggesting willing buyers were becoming a disappearing breed. The coup de grace was a final spike higher in volume in an apparent two-day buying climax on August 31 and September 1, 2000 (Point G). Despite the spike in volume, the rally failed to move above the mid July high, as sellers took over. Had the rally to the September high represented a resurrected bull market, the advance should have easily moved to new recovery highs. The fact the rebound failed at almost exactly the same level as the July rebound high, however, suggested another LPSY was reached. The subsequent decline in prices on steadily rising volume provided compelling evidence chances for a rejuvenated bull market were nil. And, indeed, it was from this September high (which corresponded to the rebound highs in the DJ Industrials and S&P 500) that the bear market began in earnest, with a subsequent drop in the NASDAQ Comp. from its September 1, 2000, rally high at 4234 to its final low at 1114 on October 9, 2002.
The 2000–2001 market top was, in many if not most aspects, a unique event in terms of the formation of bull market tops. Apart from technology stocks and a few others in sectors, such as Consumer Discretionary and Telecommunications, the year 2000 was relatively good for many investors. However, even sectors that were higher in 2000 eventually fell victim to the wave of selling that engulfed the tech stocks in 2000. Though this uneven distribution of selling rendered reliable tools for indicating market tops, such as the NYSE A–D Line or the Percent of NY Stocks above their 30-week moving average, less useful as timing instruments, an examination of the major price indexes, using the Wyckoff tools for price/volume analysis and measures of Supply and Demand, allowed investors to recognize the features that have, historically, identified major market tops.
One last note—there is at least one school of thought suggesting the techniques of the “old masters” have been rendered obsolete by changes in the market’s structure. This school contends dark pools, flash trading, decimalized quotes, among other things, have changed the character of the market to the extent that more up-to-date tools are needed for a useful analysis. Yet, the methods used in our analyses originated nearly 100 years ago. These methods worked then, and they appear to have worked right through the most recent market bottom in 2009. We can safely assume that market conditions have been in constant flux over this 100 years. Yet these methods still work. Why? Probably because they are reliable, time-tested methods for gauging fear and greed, and the forces of Supply and Demand, none of which have changed over the millennium and aren’t likely to change.