
Chapter 8. Key Dates
“This whole timing method depends on locating the key date correctly on the chart.”1 —George Lindsay
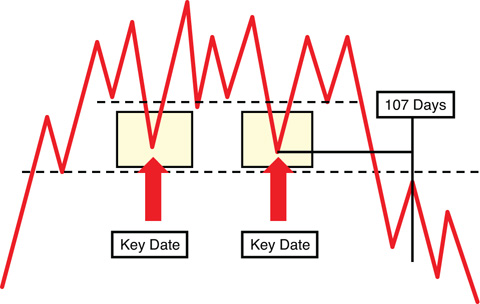
This chapter examines Lindsay’s approach to locating the origin of the 107-day interval, the date from which we count forward 107 days. Lindsay referred to the origin as the key date. The targeted date for the high of the advance is 107 days after the key date. The true date containing the ultimate, intraday high of the advance is assumed to lie within a time window that extends 5 days on either side of the target date. Thus, the true date may lie anywhere from 102 days to 112 days from the key date. Somewhere in this 5-day window is the top of the recent advance. If this target date is not confirmed by Low-to-Low-to-High intervals, we shouldn’t expect too much of a decline. Yet some sort of decline is often witnessed. The problem with putting too much emphasis on the time window without confirmation by LLH intervals is that we don’t have a feel for where in the time window it is best to go to cash or to short the market. Without more assurance of a tradable decline emerging from a narrower time frame from which to time our trade, trading with nothing more than a 107-day interval can often be “less than profitable.” A trader should not exclude other technical signals as confirming indicators, but that is beyond the scope of this book.
Key Range
“Most top formations are easy to recognize on a chart after they have been completed which is when we use them.”
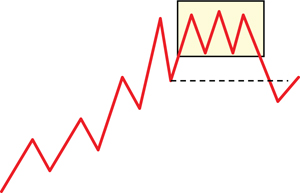
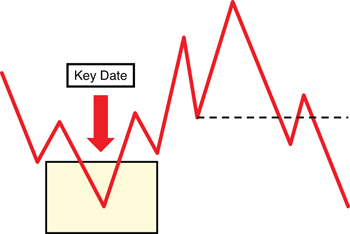
The key date (origin) is contained within a Topping Range, which we shall refer to as the Key Range. Lindsay used closing prices to find key dates and intraday highs to classify market tops. Look for the lowest closing price (not the intraday low price) when selecting a key date. In the preceding quote, the “top formation” Lindsay was referring to was the Key Range and not the target range 107 days later. It is probably easier to recognize a top formation than to define it. The closest Lindsay came to defining a Key Range was as follows: “Prices move back and forth over the same range. The fluctuations can assume any one of a number of patterns—it doesn’t matter which. When the average drops under the low of the whole range, a top has been completed.” Lindsay also wrote in one example: “The five market days from July 10 to 16...constitute a minor top formation, since prices broke sharply for two days afterward and violated the previous minor low point.” This book identifies a Key Range by finding a new high followed by a retracement to a low that is lower than the final correction preceding the identified top (see Figure 8.1).
Broadly speaking, there are two types of Key Ranges:
• Compact Top formations
• Major Top formations
Compact Tops are the most common of the top formations. Major Top formations extend over a multimonth period and are likely to contain several Compact Top formations. Once Compact Tops are understood, Major Top formations are intuitively obvious—nothing more than a big Compact Top.
Compact Top Formations
“The low day of the most obvious dip in a top formation is the key point. This is where every Top-to-Top count begins.”
There are nine variations of this common framework of the Key Range, as examined next. Once the particular variation is identified, finding the key date is straightforward and fairly simple, though it sometimes requires a bit of artistic license and flexibility on the part of the analyst. Lindsay’s background as an artist is apparent because many of his methods require the analyst to interpret and get a “feel” for what the market is doing as opposed to insisting that the market fit into any preconceived formulas.
Double Top
The Double Top formation is the best formation to begin an examination of top variations because it is the simplest.
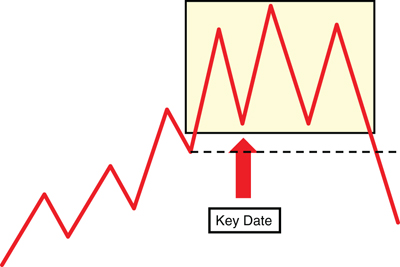
“Whenever there is a well-defined double top, or approximate double top, the low day of the dip between the two peaks is nearly always the correct key date.” (See Figure 8.2.)

The low date in a top formation can be thought of as the “center of gravity” of the Topping Range. Thinking in these terms may help the student to get a feel for what Lindsay was attempting to do in identifying key dates. Examples of counts from Double Tops can be found in Table 8.1.
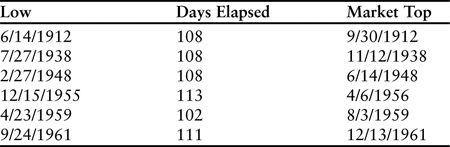
Table 8.1. Top-to-Top Counts at Bull Market Highs: Double Top Formations
Double Bottom Top
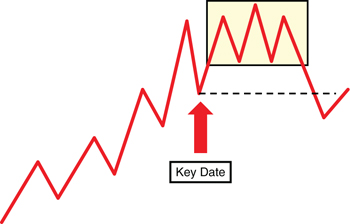
“When the dip ends at a double bottom...the first low is nearly always the correct one.”
When there are two or more dips of approximately equal depth in a top formation, the key date (from which we count) is likely to be the first of them. It is also likely to be the dip that comes before the highest point of the whole top formation. These characteristics are generally, but not invariably, true (see Figure 8.3).
Head-and-Shoulders Top
Given Lindsay’s comments on Double Bottoms (previously), one shouldn’t be surprised by his approach to Head-and-Shoulders Tops: “When there is a Head-and-Shoulders Top, the key date is the low of the decline that comes after the left shoulder and before the head.” (See Figure 8.3.)
Finding the key date in Double Bottoms and Head-and-Shoulders Tops is a good example of the need to get a feel for the market. Is the key date the first dip or the second dip? Luckily, a simple solution is to count from both dips. This simple solution is sharpened up using the examination of Low-Low-High intervals in Chapter 9, “The Low-Low-High Count.”
Final Dip
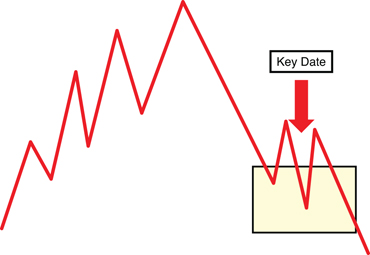
A Final Dip is not a Key Range. The last dip before the end of an advance often functions as the key date when there is no Key Range to guide us. This is an extremely common situation (see Figure 8.4). “When a top formation is neither a head-and-shoulders nor a double (or triple) top, prices usually remain close to the highest point only a very short time....In such cases, the key date is nearly always the last dip on the way up to the high. There was no dip worthy of the name in those five days. When this is true of any top pattern, we go back to the last minor dip on the way up to the high. The dip may last one day or several. The low day of that dip becomes the key date.”

In referring to key dates composed of Final Dips, Lindsay wrote: “They were sell-offs lasting about one day which came only two or three days before the final high of the advance. Others—like those of December 1952 and May 1959—were declines lasting four or five days, which came from one to three weeks before the final high. Thus, a certain amount of discretion is involved in selecting the last dip on the way up to the high.”
Range Dip
One key date variation that Lindsay alluded to, almost in passing, but didn’t attempt to categorize is similar to the Final Dip. It actually is a Final Dip if, rather than defining it as the “last dip on the way up to the high” trading day, one thinks of it as the last dip prior to the Key Range.
“The five market days from July 10 to 16, shown at point 9, constitute a minor top formation, since prices broke sharply for two days afterward and violated the previous minor low point.” The “previous low” Lindsay referred to ended up being a key date itself (see Figure 8.5).
Using a Range Dip in conjunction with a Final Dip can narrow the target range and provide a higher level of confidence in the target date. The final high of a move often falls between target dates measured from these two key dates. Care must still be taken to use LLH intervals, however. LLH intervals are explained in Chapter 9.
Bottom to Top Counts (BTC)
“They are of the same duration as Top-to-Top Counts and are frequently found in long bull markets. But they begin at any sort of bottom, not just at the low point within a top formation. They are much less likely to result in a big decline than a true Top-to-Top Count.”
Bottom to Top Counts, or BTC, occur fairly frequently. They are the simplest of all key dates to recognize because one need not bother identifying a Key Range. They are nothing more complicated than counting forward 107 days from a bottom to a possible top. Look for these counts when markets exhibit an extended rise. Or rather, start counting from recent bottoms during an extended rise. When an analyst starts asking himself, “Where IS the Key Range?” chances are the BTC is the appropriate count to be considering. When a key date does not fall within a Key Range, then the market decline following the 107-day count is unlikely to be anything greater than of intermediate scope (see Figure 8.6).
Special Class
“When a count can be taken from the primary low of a decline, the same type of count may also be taken from a secondary low which follows shortly afterward at a slightly higher level.”
Closely related to the Bottom to Top Count is a category Lindsay referred to as a Special Class. Lindsay explained that 107-day counts could be taken from either of the dips after the key date in Figure 8.6. Counting forward 107 days from either of those subsequent dips takes one to a ±5-day window in which a bounce should be expected in the downtrend from the high counted from the primary low. This is similar to key dates in Major Tops (see Figure 8.9). A key date in a Major Top will time the start of a bigger decline that gets underway from a lower level. The count from the second key date in a Major Top is not used to identify a new high. This identified “high” should be expected to be a short-lived bounce and a point from which to expect a renewed decline.
Post Top Counts (PTC)
“There are, however, instances when the key date comes after the highest point, even though there was a possible key date prior to it.”
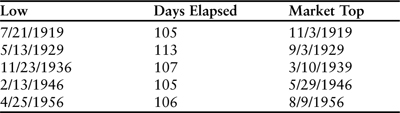
The PTC is distinguished by the true key date appearing after the high of the Key Range (see Figure 8.7). A PTC is a less frequent phenomenon than the other variations examined previously. It should be thought of as an anomaly but not forgotten. The top in 1929 (September 3rd) was 113 days from the key date of May 13, 1929. The key date in May of 1929 occurred after the high of the Key Range. The 113 days is unusual in that it was outside of the 102-to-112-day target range, but the decline following the target date was unusual as well. Examples of Post Top Counts can be found in Table 8.2.
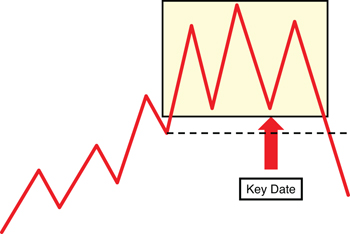
Table 8.2. Post Top Counts at Bull Market Highs
One would be wise to wonder how it can be known which dip in a Key Range is appropriate when this exception is always possible. The use of the Low-Low-High interval holds the answer to solving this riddle; it is explained in Chapter 9.
Sinking Key Range
The Sinking Key Range concept might seem confusing in a chapter concerning Top-to-Top counts, but it is not all that difficult. In an extended downtrend, a market is not going to develop a Key Range that fits the stereotype, but it normally will see periods of consolidation during the decline. It is during these consolidations we can look for key dates (see Figure 8.8). Often, the key date will take the form of a Post Top Count as the market will experience a substantial bounce after an extensive decline, pull back from the bounce printing the key date, and then bounce again but not as high as the original bounce. This consolidation is then followed by a renewed decline and prices dropping to new lows. This behavior would cause a key date to appear after the high of the consolidation, and the ensuing count is referred to as a Post Top Count. In this case, the PTC appears in a Sinking Key Range.
Figure 8.8. Sinking Key Range.
Major Top Formations
“The second kind of top formation is the long drawn out one....Each formation of this type usually has two key dates....Note that these key dates are found far below the highest level of the whole top pattern. A Top-to-Top count must be taken from both of the key dates in such a formation. The count from the first one is sometimes unimportant, or doesn’t work at all....The count from the second date...is usually important and results in a deep decline.”
Major Top formations tend to extend over a multimonth period and are likely to contain several Compact Top formations. A Major Top can be identified using the concept of the Range Dip (see Figure 8.9).
A key date in a Major Top formation will most likely need to be far under the highs of such a large Key Range. This is needed in order to identify the key date just as in a Compact Top. A key date in a Major Top will time the start of a bigger decline that gets underway from a lower level. It may be that the targeted top is the same, original bounce in the consolidation mentioned in the Sinking Key Range example previously. The count from the second key date in a Major Top is not used to identify a new high. This identified “high” should be expected to be a short-lived bounce and a point from which to expect a renewed decline.
Conclusion
Topping Ranges are composed of Compact Tops and Major Tops. The two types of tops are differentiated by the length of time involved in their construction and the fact that Major Tops usually contain several Compact Tops.
This chapter has identified and labeled the nine types of Compact Tops that Lindsay wrote of either explicitly or implicitly.
In contrast to Compact Tops, Major Tops extend over several weeks and can be easily missed if the analyst isn’t looking for them. The primary use of Major Tops is to identify a point where an extended decline below the Major Top, or Topping Range, is to be renewed and can be expected to lead to an even larger decline than what has already been witnessed.
Endnote
1 Unless otherwise indicated, all quotes in this chapter are taken from George Lindsay’s self-published newsletter, George Lindsay’s Opinion, during the years 1959–72.