13
Data Management with Tableau Prep Conductor
With Data Management from Tableau, Tableau Prep has another component – Tableau Prep Conductor. This chapter will explore how to set up and use Prep Conductor.
This chapter will also explore the additional features of Data Management that enhance our data models. These features are the data catalog, data lineage, and data quality warnings. We will also look at certified data models, which are a standard feature of Tableau Server and Cloud.
In this chapter, we’re going to cover the following topics:
- Scheduling Tableau Prep flows from Tableau Prep Conductor
- Data catalog, lineage, data quality warnings, and certified data sources
Technical requirements
To view the complete set of requirements to run the practical examples in this chapter, please see the Technical requirements section in Chapter 1.
We will be using the following files in the exercises in this chapter:
- Superstore Sales Orders - Canada.xlsx
- Product Database.xls
The files that will be used in the exercises in this chapter can be found at https://github.com/PacktPublishing/Data-Modeling-with-Tableau/.
Scheduling Tableau Prep flows from Tableau Prep Conductor
We looked at Tableau Prep Builder in Chapter 4, Chapter 5, and Chapter 6. When we use the Tableau Prep Builder client software, we can save our flows to our filesystem as Tableau Prep flows (the.tfl file extension) or Tableau Prep packaged files (the.tflx file extension). Tableau Prep flow files contain information on data server connections and the instructions we create in the flow. Tableau Prep packaged flow files contain the same information, plus the data from any file-based sources that have been embedded. In addition to saving flow files locally, Tableau Prep flows can be published to Tableau Server or Cloud.
When we use the Tableau Prep Builder web client, we only have the option to publish our flows to Tableau Server or Cloud. From both the installed client and web client, we can run our flows manually. When we run flows, Tableau performs all the data transformation steps we created and runs any outputs in the flow. All these capabilities are available to users with Creator licenses.
To automate the process of running our flows on a schedule or off a trigger when the underlying data changes, we need to use Tableau Prep Conductor. This is a feature of Tableau Server and Cloud and is only available with Data Management. We will now look at creating a new flow from the web client, publishing it, and scheduling it with Tableau Prep Conductor:
- Sign into your Tableau Server or Cloud instance. Click on New | Flow from any page, as shown in Figure 13.1:

Figure 13.1 – Creating a new flow in the web client
- Click on the Connect to Data button in the middle of the screen, as shown in Figure 13.2. Choose File | Microsoft Excel, locate the Superstore Sales Orders - Canada.xlsx file from your computer, and click on Open:

Figure 13.2 – The Connect to Data button
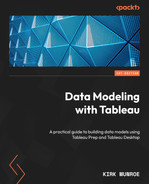
- We will now see our Canadian sales data. Click on the + symbol to the right of Connections in the Connections pane to add a connection, as per Figure 13.3:
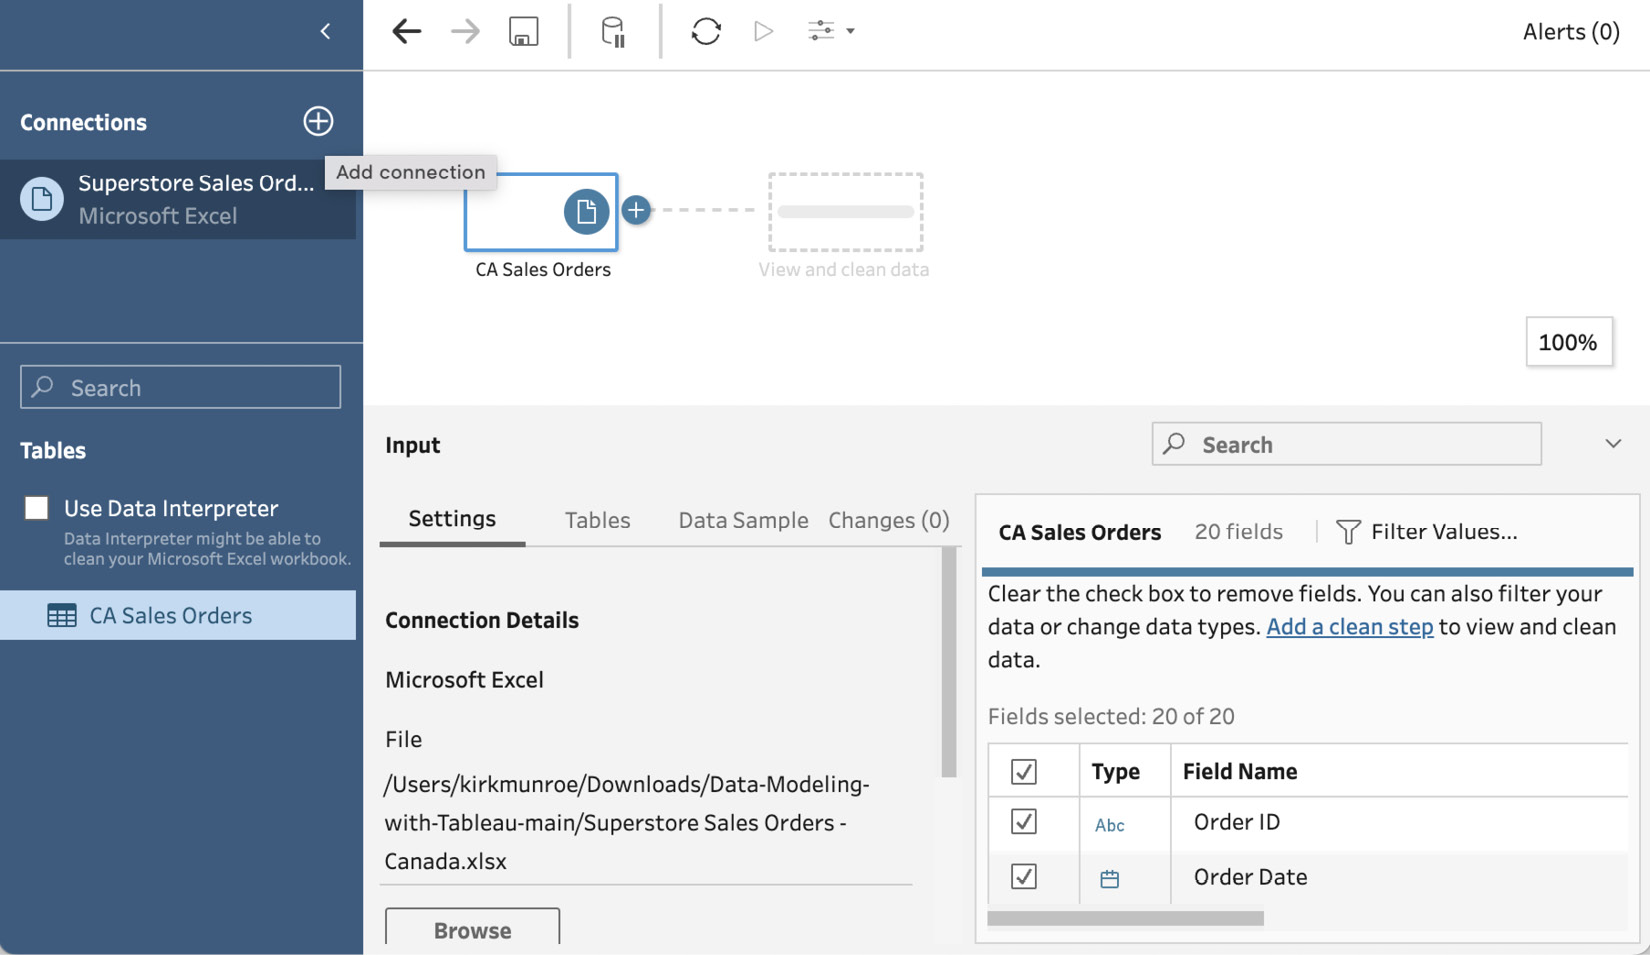
Figure 13.3 – Adding a new connection
- Choose File | Microsoft Excel, locate the Product Database.xls file from your computer, and click on Open. Click and hold the left mouse button on the + symbol to the right of Product DB, drag it over the + symbol to the right of CA Sales Orders, and release it to create a join, as shown in Figure 13.4:

Figure 13.4 – Creating a join between the tables
- Notice that Tableau will create an inner join on the Product ID field. This is the join we want for our exercise so that we can add an output step. Click on the + symbol to the right of Join 1 and choose Output, as shown in Figure 13.5:

Figure 13.5 – Adding an output step
- Now, we can configure our output in the area below our flow pane. Leave Save output to set to Published data source. Change Project to the Sales project we created in Chapter 11 and change the name from Output to Canada Sales. Our screen should now look like what’s shown in Figure 13.6:

Figure 13.6 – Output step
- We will now publish our flow. Click on the Publish button in the top right-hand corner of the screen. This will bring up the Publish Flow dialog box. Change the Name to Canada Sales Flow and select Sales for Project. Then, click on Publish, as shown in Figure 13.7:

Figure 13.7 – Publish Flow
- After clicking Publish, Tableau gives us a notification at the top of the screen that our flow has been published. Click on the View flow link, as shown in Figure 13.8:

Figure 13.8 – Published flow notification
- We will now be taken to a page that gives us additional information and allows us to perform actions on our flow, as shown in Figure 13.9. We can go back in and edit our flow by clicking on the Edit Flow button. We can also manually run our flow, which would generate our Canada Sales published data source. Both options are available to us as a Creator, even if we don’t have Data Management. We also have a tab to view the Connections properties in our flow. The other four tabs are only available with Tableau Prep Conductor:
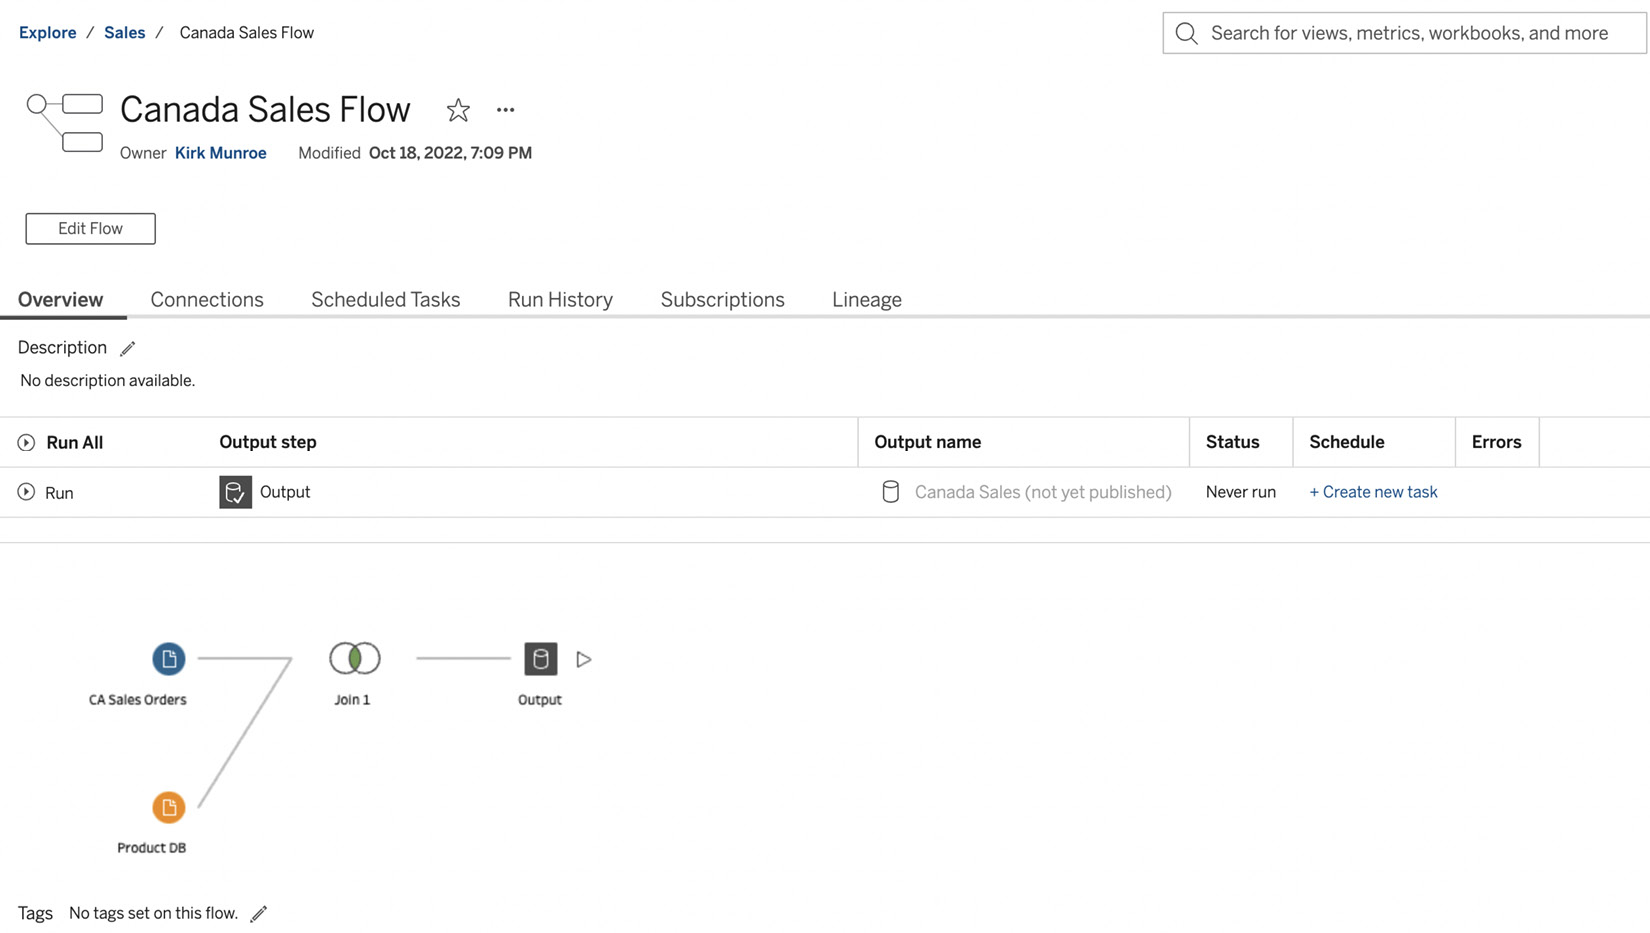
Figure 13.9 – The flow page on Tableau Cloud
- Now, let’s create a new task using Tableau Prep Conductor. Click on the + Create new task link in the Schedule column. This will bring up the new task dialog, as shown in Figure 13.10. There are a few things we can do on the Single Task tab, as follows (see Figure 13.10):
- Select a schedule: We can select a schedule of when we want the task to run. If we are using Tableau Cloud, there is a long list of options to choose from. If we are using Tableau Server, these schedules are created by the Server Admin.
- Output steps: We can choose to include all the steps from our flow or select output steps individually. Since our flow only has one step, both options have the same result. If we have multiple steps, we could select individual ones in the task.
- Refresh Type: If our connection contains data server connections, we have the option of a full or partial refresh. As our connections are Microsoft Excel, only the Full refresh option is available.
- Send email when done: By clicking on this option, we can configure an email to be sent to people when the task runs, including a custom message:

Figure 13.10 – New Prep Conductor task
- Click on the Linked Tasks tab to see the options to create linked tasks, as shown in Figure 13.11. This tab allows us to link multiple flows together. Linked tasks make sense when one flow is dependent on another. We can send emails when each step is complete, stop the next task if one task fails, and add a data quality warning if a task fails. We will look at data quality warnings in the next section of this chapter. We do have linked tasks in our exercise, so click on the Single Task tab. Select any schedule to enable the Create Tasks button, leave all the other options as-is, and click Create Tasks:
Figure 13.11 – Linked Tasks options
- We will now be taken back to the page that provides an overview of our flow. We will see whatever schedule we picked in the Schedule column. We don’t want to wait for our schedule’s date and time, so click on the Run Flow link, as shown in Figure 13.12:
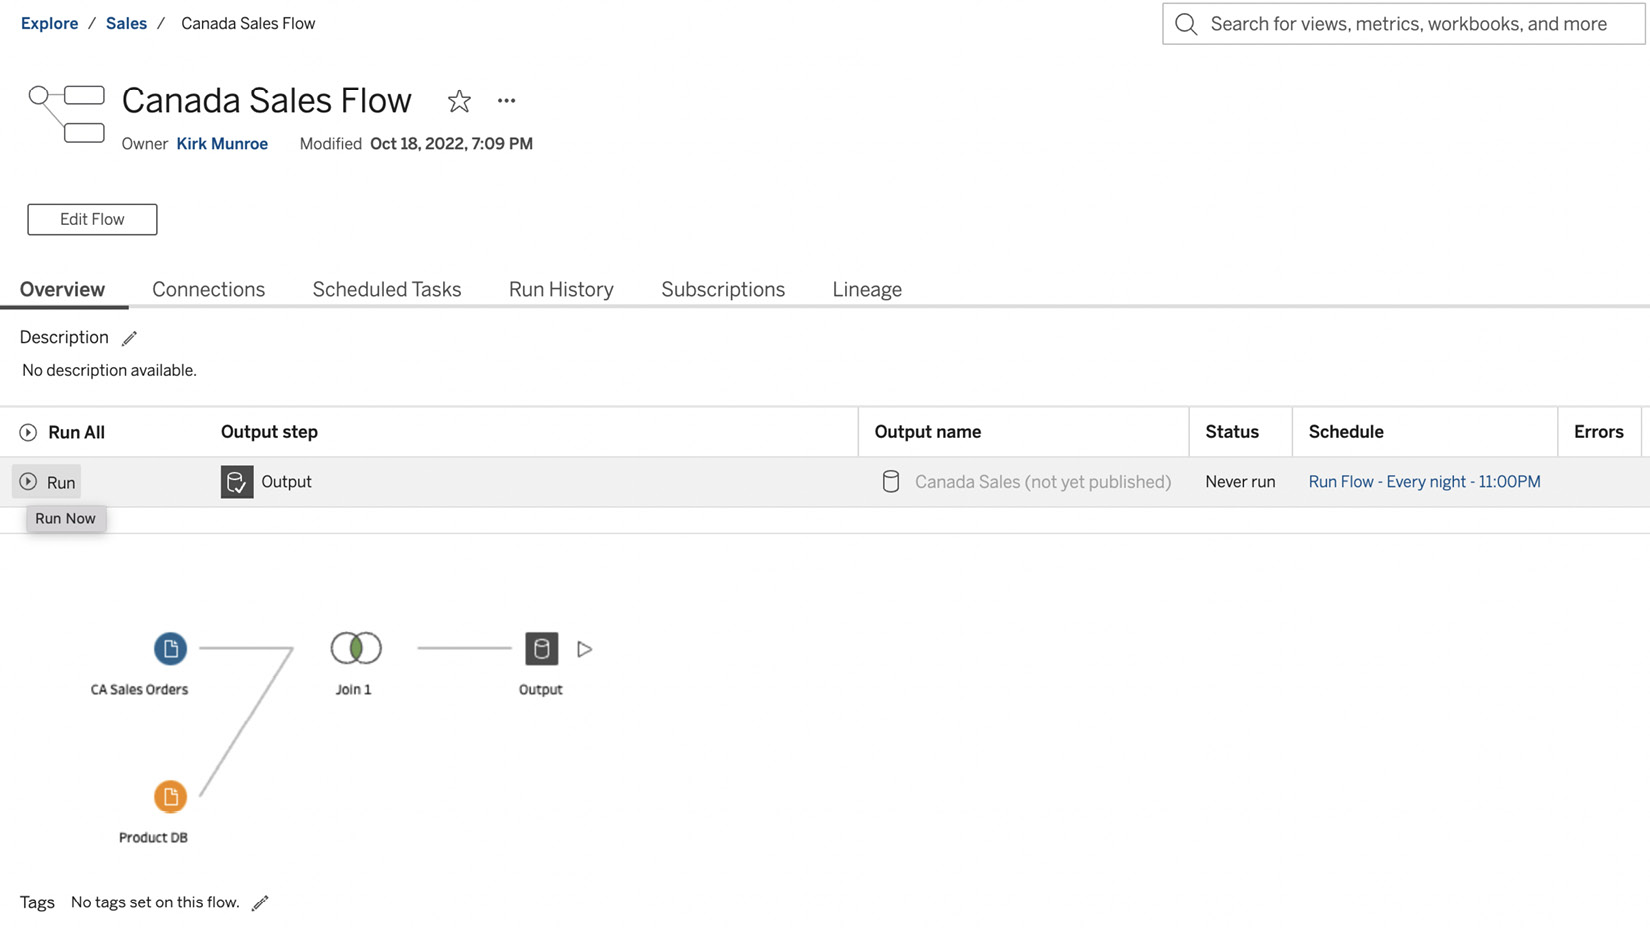
Figure 13.12 – Running the flow
We will get a dialog box asking us to confirm that we want to run the flow now, as shown in Figure 13.13. Click on Run Now to confirm:
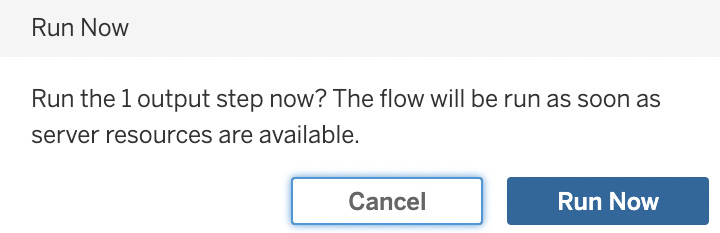
Figure 13.13 – Run Now confirmation
- Wait until the Status column returns a message that the run was successful. Once we see the success message, we can click on the Run History tab, as shown in Figure 13.14. Here, we will see details about our successful run. We can always come back to this tab to diagnose the state of scheduled tasks:
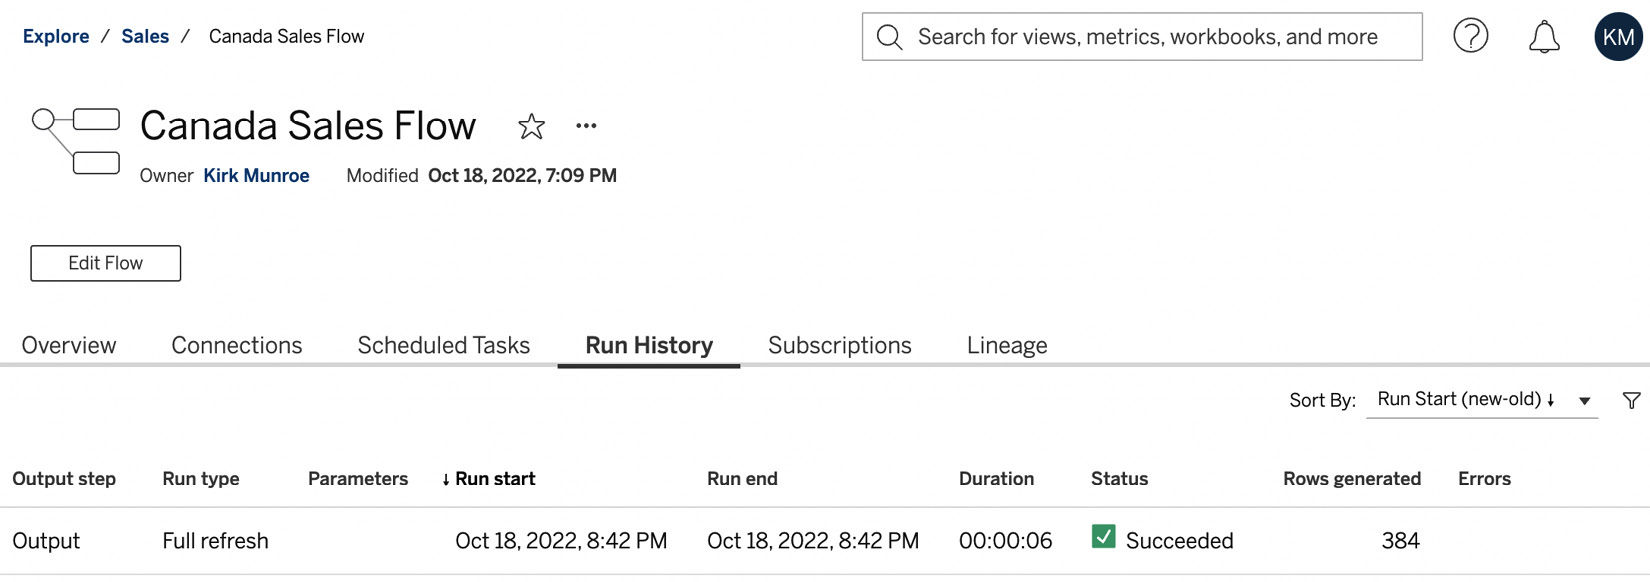
Figure 13.14 – The Run History tab
- As our last step of exploring Tableau Prep Conductor, click on the Subscriptions tab and then click the Subscribe button. We will now see a screen like the one shown in Figure 13.15. Subscriptions are a way to send people, including ourselves, a message every time a task runs. Subscriptions give us a few options:
- Frequency: We can pick from the list of tasks for which we want to create a subscription. In our example, we only have the one we created in Step 11 of this exercise.
- Send to: The list of users or groups to receive the notification.
- Send to me: An optional checkbox to send the email to ourselves.
- Subject: The subject of the email.
- Email message: The optional body of the email.
- Include link to published data source: Embeds a link in the email to make it easy for the recipient to click through to the published data source page:
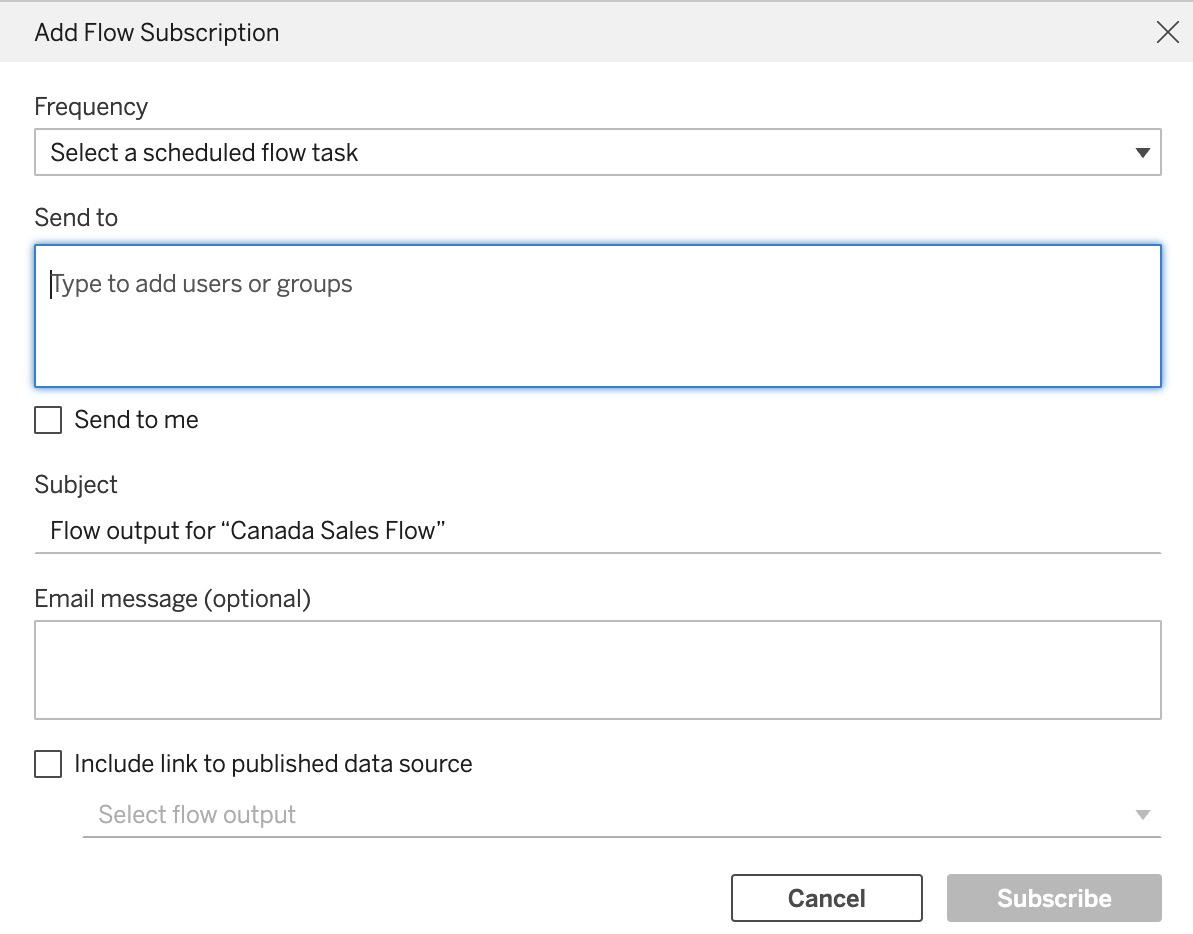
Figure 13.15 – Subscription options
In this section, we learned about Tableau Prep Conductor. This is a capability that allows people to scale flows to automate the maintenance of the data models that are created in Tableau Prep Builder.
Next, we will talk about three other features that are enabled with Data Management that enhance our data models.
Data catalog, data lineage, data quality warnings, and certified data sources
In addition to Tableau Prep Conductor, Tableau Data Management also enables three other features, namely, data catalog, lineage, and data quality warnings. In this section, we will look at each of these features:
- From the same Tableau Server or Cloud instance we used in the previous exercise, click on the Explore navigation button on the left-hand side panel. If the side panel is collapsed, the Explore button will look similar to what’s shown in Figure 13.16:
Figure 13.16 – The Explore button
- Click on the link for the Sales project. You should now see the Canada Sales published data source and Canada Sales Flow, which we created in the previous exercise, as shown in Figure 13.17:

Figure 13.17 – Sales project contents
- Click on the Canada Sales published data source link. Once we are on the data source page, click the Lineage tab, as shown in Figure 13.18:

Figure 13.18 – The Lineage tab of the Canada Sales data source
- On the right-hand side of the page, you will see the Lineage property of the Canada Sales data source. If you click on any of the links, you will get more details about that stage of the lineage. If one or more workbooks are created from this data source, the count of Workbooks and Sheets will be listed between Fields and Owners; fields are hyperlinks that take us to the required content. This is the lineage feature of Data Management.
- We will now look at how the data catalog works. Click on the link for the Category field (see Figure 13.18) – it is the top field in our list. We will be taken to a dialog that gives us metadata about our field. We can also add a description to this field. To do this, click on the pencil icon, as shown in Figure 13.19:

Figure 13.19 – Edit description
- After clicking the Edit description pencil icon, enter The categories of products we sell in the textbox and click on Save to commit our changes, as shown in Figure 13.20:

Figure 13.20 – Entering a description for Category
- Click on the X button at the top right-hand corner to dismiss the dialog. We will now be on our data source page and will see the description for the Category field, as shown in Figure 13.21. This description will now also be available to viewers who are exploring dashboards on Tableau Server and Cloud. This allows you to build trust in your data model with these users:

Figure 13.21 – Description of Category
- Click on the … icon to the right of the Canada Sales title again. This time, select Quality Warning | Quality Warning…, as shown in Figure 13.22. Data quality warnings are features that are only available with Data Management:

Figure 13.22 – Quality warning
- We can enter a quality warning if we click on the toggle next to Show warning, as shown in Figure 13.23. For example, if we know the data has a minor problem, we can set our warning to Standard visibility and enter a message. People viewing any workbooks associated with this data source would then need to open Data Details to see this message. We can also set the warning to High visibility when we have an important data quality issue. For instance, perhaps the issue is large enough that we might be concerned about people making a bad decision with the data. In this case, the message will appear as an alert any time someone views a workbook with our data source. Now that we have seen how data quality warnings work, we can click on Cancel to dismiss the dialog box:
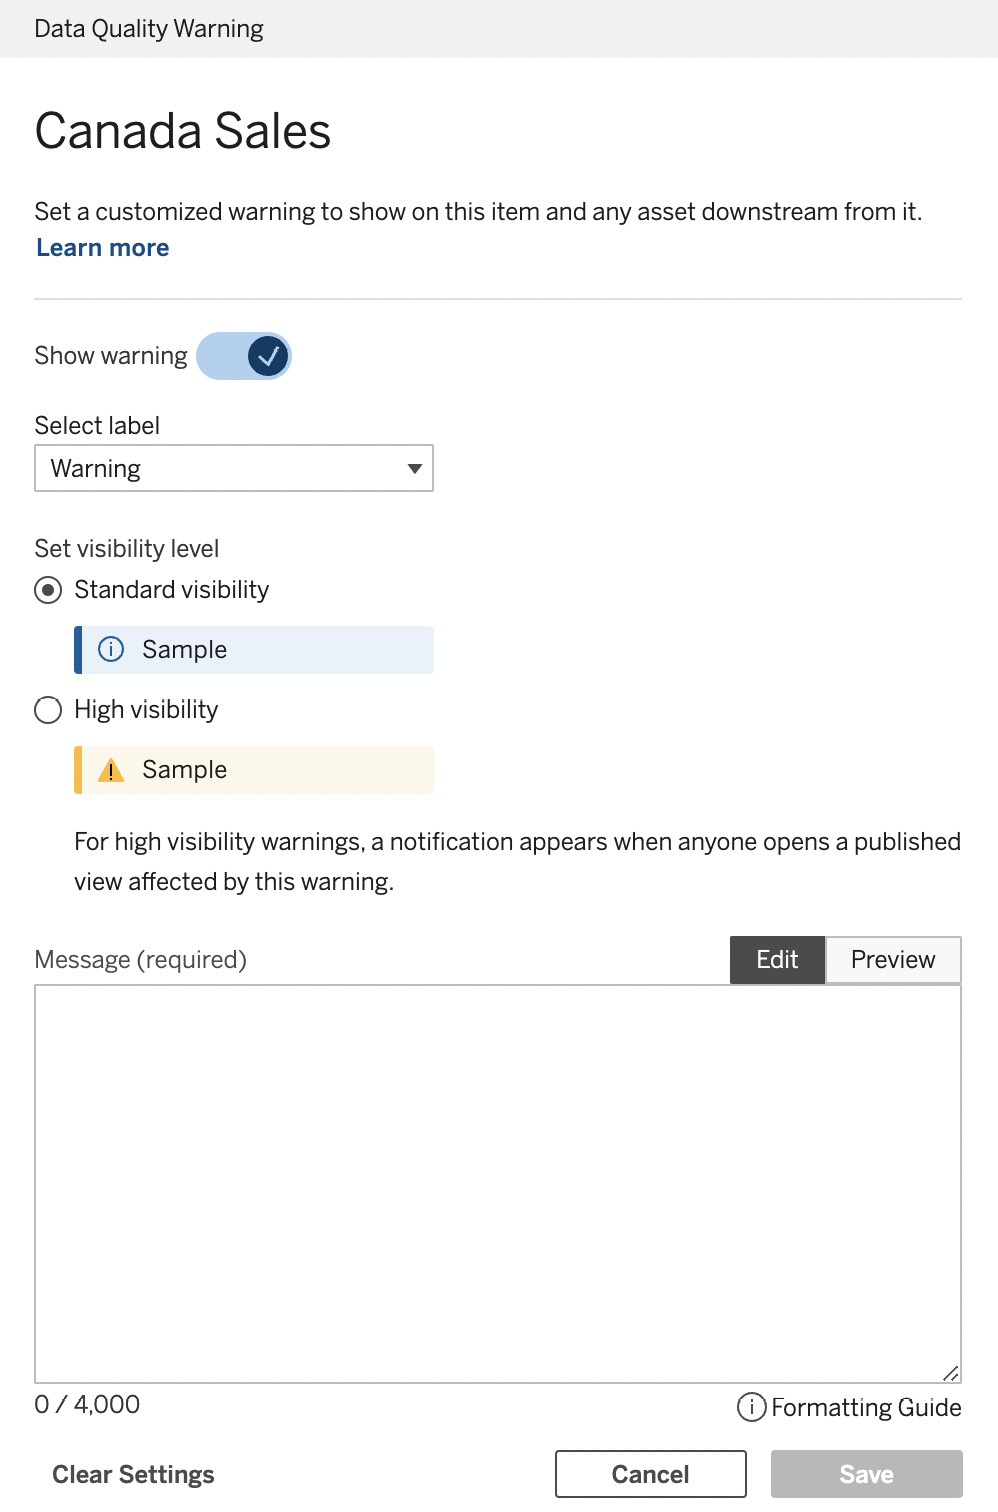
Figure 13.23 – Data quality warnings
- For our final step in this exercise, click on the … icon to the right of the title again. This time, select Quality Warning | Extract Refresh Monitoring…. This will bring up the Extract Refresh Monitoring dialog, as shown in Figure 13.24. This functionality acts in the same manner as the data quantity warning we explored in the previous step. The difference with this option is that the warning occurs automatically when an extract refresh fails. Click on Cancel to dismiss the dialog:
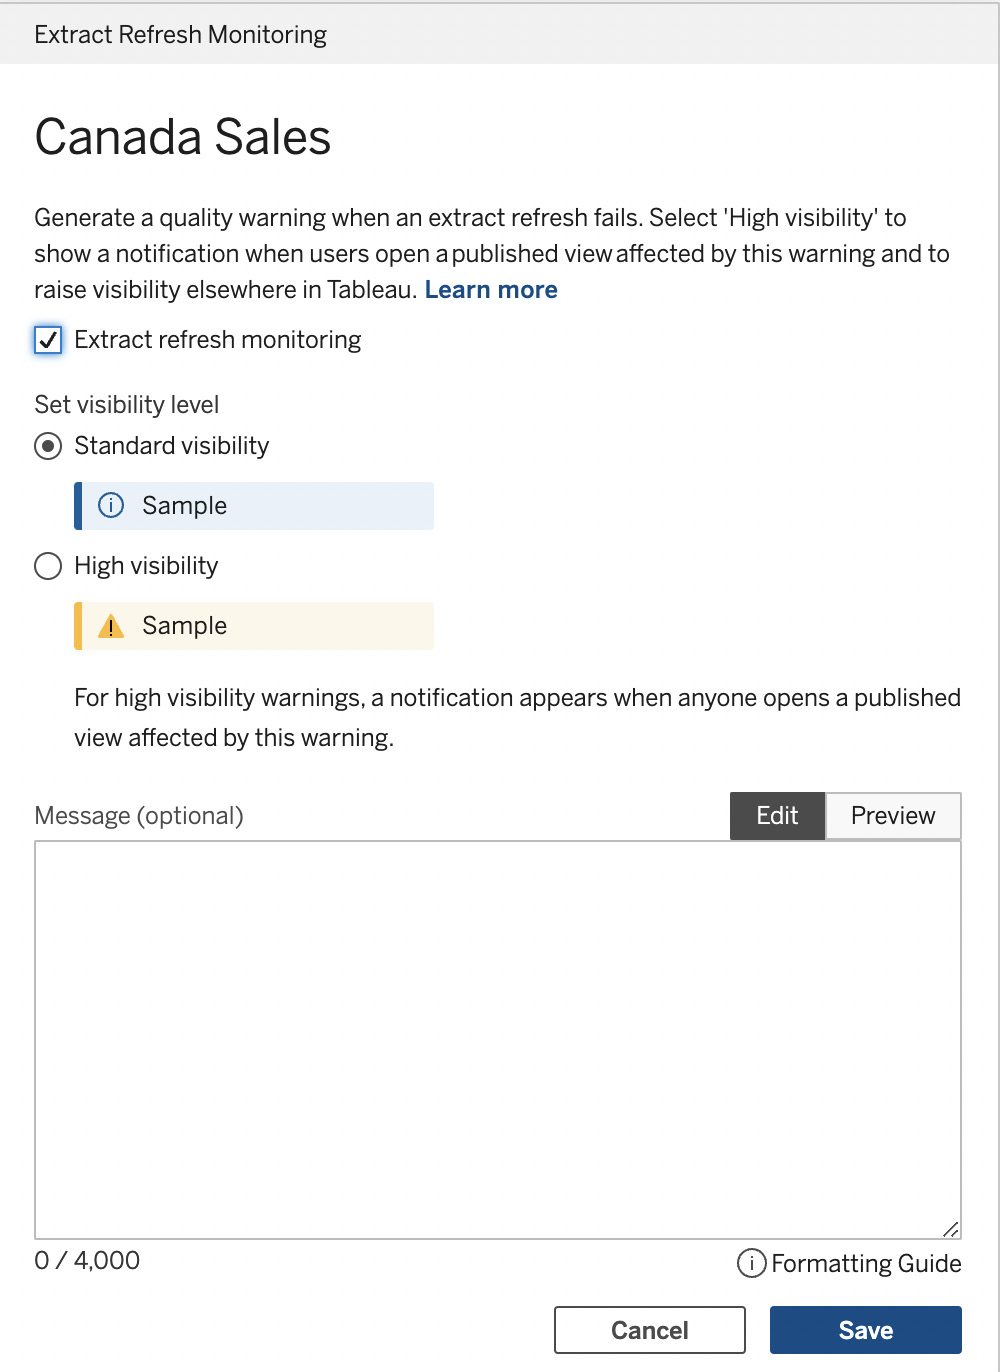
Figure 13.24 – Extract Refresh Monitoring
- Now, we will look at certified data sources. Click on the … icon to the right of the Canada Sales title on the data source page. Click on the Edit Certification… option to bring up the certification dialog box, as shown in Figure 13.25:

Figure 13.25 – Edit Certification…
- Click on the This data is certified checkbox and enter This data source is the one source of truth for Canadian product sales. in the textbox, as shown in Figure 13.26. Click on Save to commit our changes:

Figure 13.26 – Data certification dialog box
- We will see that there is a clear indication that this data source has been certified by the Certified logo on the data source page, as shown in Figure 13.27. This data source will now go to the top of the list when dashboard creators select To a Server as their connection type. This builds confidence in the data source for both authors and consumers of content. Certifying data sources is available to all Tableau deployments – that is, we do not need Data Management to certify data sources:

Figure 13.27 – Certified logo
In this section, we learned about additional data modeling features of the Tableau platform. The data catalog, lineage, quality warnings, and certified data sources features of Tableau all work together to help us build confidence in our data models.
Summary
In this chapter, we explored Tableau Prep Conductor. This capability allows us to schedule the flows we create in Tableau Prep Builder and the web client. We can schedule our flows to run as single or linked tasks, we can subscribe to flows, automate messages when our flow fails, and check the status of our flows when they have run.
We learned that the data catalog and data lineage allow for building trust in our data source, allowing the people who view and interact with Tableau visualizations to see data definitions, where data originates, and where the data is being used in the organization.
Data quality warnings allow us to alert users when we have issues with the data in our data models. These warnings can be created manually or created to trigger when data extracts fail.
We also learned that certifying data sources signals to authors and consumers using published data sources that they can be used with confidence.
In the next chapter, we will be looking at the Tableau scheduling service and using Tableau Bridge to keep on-premises data sources fresh on Tableau Cloud.