
11
Securing Data
This chapter focuses on governing and securing data at the data model level and the individual data elements within a data model. It covers considerations across the entire Tableau platform, from Tableau Desktop to managing data on Tableau Server and Tableau Cloud including the information architecture that is exposed through projects.
Some of the content in this chapter will cover items that are outside the typical scope of someone responsible for creating data models. We’ll cover these topics while adding users and groups and setting project security since they are fundamental for understanding access and authorization to our data models and the data contained in them.
In this chapter, we’re going to cover the following topics:
- Adding users and groups to Tableau Server and Cloud
- Using Tableau projects to manage data model security
- Adding user-based security using a user filter
- Adding user-based security inside a published data source using an entitlements table
- Using Tableau virtual connections to manage access and security
- Leveraging database security features for both row and column-level security
Technical requirements
To view the complete list of requirements needed to run the practical examples in this chapter, please see the Technical requirements seciton in Chapter 1.
The files used in the exercises in this chapter can be found at https://github.com/PacktPublishing/Data-Modeling-with-Tableau/.
We will use the following files in this chapter:
- Product Sales.csv
- Entitlements.csv
Adding users and groups to Tableau Server and Cloud
Users and groups are key to securing data and content on Tableau Server and Cloud. We will add users and groups directly to Tableau in this chapter. If you are following along using your organization’s Tableau Server or Cloud and you have a role less than Server Administrator (Tableau Server) or Site Administrator, sign up for a trial Tableau site at the link provided in the Technical requirements section.
Before we start this exercise, it is important to note that users and groups are often maintained by a separate identity provider (IdP) in the Tableau environment. Microsoft Active Directory can be used as an IdP to manage users and groups with Tableau Server at install time. Tableau Cloud uses the System for Cross-Domain Identity Management (SCIM) standard to allow users and groups to be managed by an IdP outside Tableau. At the time of writing, Tableau supports Azure Directory Services, OKTA, and OneLogin as SCIM-enabled IdPs. In our exercise, we will be adding users and groups manually:
- Connect to your Tableau Server or Cloud instance. From the home page, click on the Users button in the sidebar on the left-hand side of the screen. If the sidebar is collapsed, you can find the button for users by hovering over the button shown in Figure 11.1:

Figure 11.1 – The Users navigation button
- We can see the number of users by the licenses they have been assigned at the top of the Users page. We can add new users by clicking on the Add Users button. We can add users manually by entering their email addresses. Here, we are going to import a list of users. Click on Add Users | Import from File, as shown in Figure 11.2:

Figure 11.2 – Add Users
- We will now see the dialog for importing users from a file. In a production environment, it is always good to use multi-factor authentication (MFA) for better security. In our case, we want to keep our exercise straightforward, so select the Tableau radio button, click the Choose a file button, find the Entitlements.csv file we downloaded from GitHub, and click on Open. Our screen should now look like what’s shown in Figure 11.3. Click on Import Users to bring in our users. Once the file has been uploaded, you will get a message saying that five users have been added to the site. Click Done to dismiss this dialog:
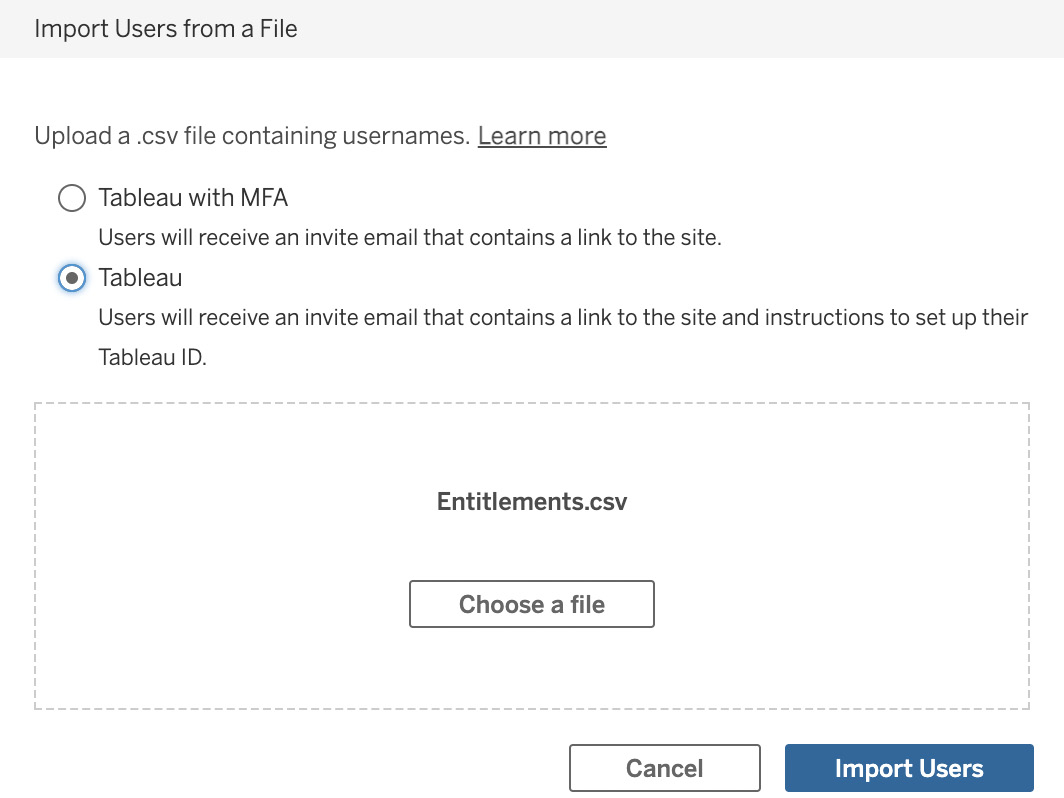
Figure 11.3 – The Import Users from a File dialog
- Our Users page will now show our five new users. Each of these users has a . in front of their email. This signifies that the user has not signed into Tableau yet. You should also notice that the new users are Unlicensed, as seen in Figure 11.4. Click on … under the Actions column for [email protected] and select the Site Role... option, also shown in Figure 11.4:

Figure 11.4 – New users
- We can now change the site role of the user by clicking ▼ next to Unlicensed, as seen in Figure 11.5:

Figure 11.5 – Assigning a site role
The different role options that we can see in the preceding screenshot are as follows:
- Creator:
- Site Administrator Creator: This enables the user to use all the authoring capabilities of the Tableau platform and manage the site on Tableau Server or Cloud.
- Creator: This enables the user to use all the authoring capabilities of the Tableau platform.
- Explorer:
- Site Administrator Explorer: This enables the user to use the Explorer capabilities we explored in Chapter 2. It also allows the user to manage the site. If you are assigning someone to manage the site and they won’t be creating content in Tableau Desktop or Tableau Prep Builder, assigning them this license is the best option as the Explorer license has a lower cost than the Creator one.
- Explorer (can publish): This enables the user to use the Explorer capabilities with the ability to publish to Server. This role is another great reason for using published data sources instead of embedded data sources. The primary difference between an Explorer and a Creator, in addition to cost, is that an Explorer does not have a license for Tableau Desktop and Tableau Prep Builder (nor for creating flows in the web client). They can use the web client to create and update workbooks, but they cannot connect to new data, except for files. If they are using a published data source, they have the same capabilities to create workbooks as Creators do while using the web client. If you aren’t using published data sources, then the users would need the more expensive Creator license as they would need to connect to new data sources before they can create a workbook.
- Explorer: This enables the user to use all the capabilities of Explorer, except that they cannot publish. Use this role for users who you want to enable to create their own analyses but not share them with others.
- Viewer:
- Viewers: Can view and interact with content
- Unlicensed: A place to park users until they need access to the site. These users cannot connect to Tableau Server and Cloud until they are moved to one of the other roles, except for Grant role on sign, which we will discuss in step 8 of this exercise.
If you are using Tableau Server, there will also be an option for Server Administrator Creator.
- Select Viewer and click on Change Site Role, as shown in Figure 11.6. Repeat this step for each of the four remaining users we added:

Figure 11.6 – Change Site Role
- We will now add these users to a new group called Sales. Adding users to groups makes managing access much easier as everyone within a group often has the same access to information. Click on the Groups icon. If the sidebar is collapsed, this icon will be below the Users icon, as shown in Figure 11.1 in step 1 of this section. After clicking on Groups, we will be taken to the Groups page. Click on Add Group | Local Group, as shown in Figure 11.7:

Figure 11.7 – Creating a local group
- We will be presented with a dialog to create a new group. Type Sales under Group Name, leave Grant role on sign in unchecked, and click on Create, as shown in Figure 11.8. The ability to grant a role upon signing in allows you to add members to a group without assigning a site role. When they sign in for the first time as an unlicensed user, they will be assigned the role you select here:

Figure 11.8 – Creating a new group
- We will now see our new group listed in the groups on our site. Click on the Sales group. The top left-hand side of our screen should now look like Figure 11.9:

Figure 11.9 – Sales group
- Click on Add Users and check the names of all the @company.com users we added. Then, click Add Users (5), as shown in Figure 11.10:

Figure 11.10 – Adding users to the Sales group
With that, we have created five new users, learned about site roles, assigned our users the Viewers role, and added them to a group. In the next section, we will learn how to use users and groups to secure our data models and other content.
Using Tableau projects to manage data model security
Tableau Server and Cloud are intended to have content organized into projects. Projects act much like file folders on a network or cloud drive. When it comes to security and accessing content with projects, we can leave them unlocked and delegate access control to the individuals who create the content within the project. Alternatively, we can lock permissions to content within the project at the project level.
Locking permissions to the project level is the best practice for several reasons:
- It is easier to manage security as the number of projects will typically be much less than the number of workbooks, data sources, lenses, flows, and other objects that reside in projects.
- Projects often map very well to internal teams with shared data needs. These teams often map to groups in Tableau. Securing projects to groups, as opposed to individuals, makes the job of managing access control easier.
- Delegation can occur at the correct level. Instead of putting all the access control requirements on a site administrator, a site administrator can assign project leaders to manage individual projects. For example, if a project exists for the sales team in the company, a sales leader can determine who will manage access to content for their team and have a site administrator grant project leader status to this person.
- Projects can be nested within projects to make content management and access even easier. Nested projects can have their own access control or they can inherit it from parent projects.
- It takes the responsibility and potential for incorrect access away from content creators. Typically, content creators are responsible for creating their workbooks, data sources, flows, and other objects. It can put a lot of responsibility on them to determine who can and cannot see these objects at the time of publishing. When the projects they are publishing to are locked, they don’t have to worry about this as access will be inherited from the project.
Let’s learn how to set up a project and lock its permissions:
- From the home page, navigate to the Explore page. If your sidebar is collapsed, you can find the Explore navigation button by hovering over the button shown seen in Figure 11.11:

Figure 11.11 – The Explore page navigation
- We should now see all the top-level projects. If the view shows other objects, click on the drop-down menu next to Explore and select Top-Level Projects, as shown in Figure 11.12:
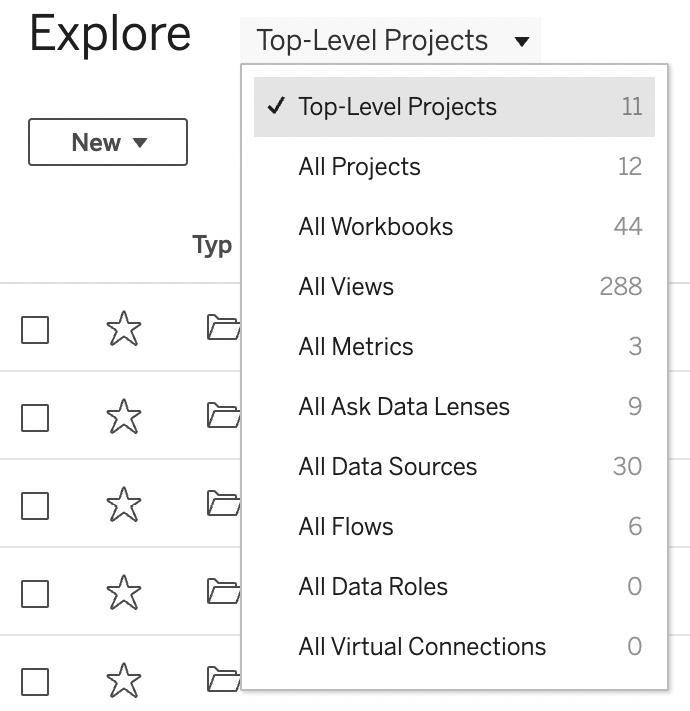
Figure 11.12 – The Explore page’s drop-down
- Find the default project and click on the … icon in the Actions column and select Permissions, as shown in Figure 11.13. The default project is an important one because it acts as a template for all other projects – that is, the settings on default are inherited by all other projects when they are created. If we change the settings of default, this does not change the settings of existing projects:
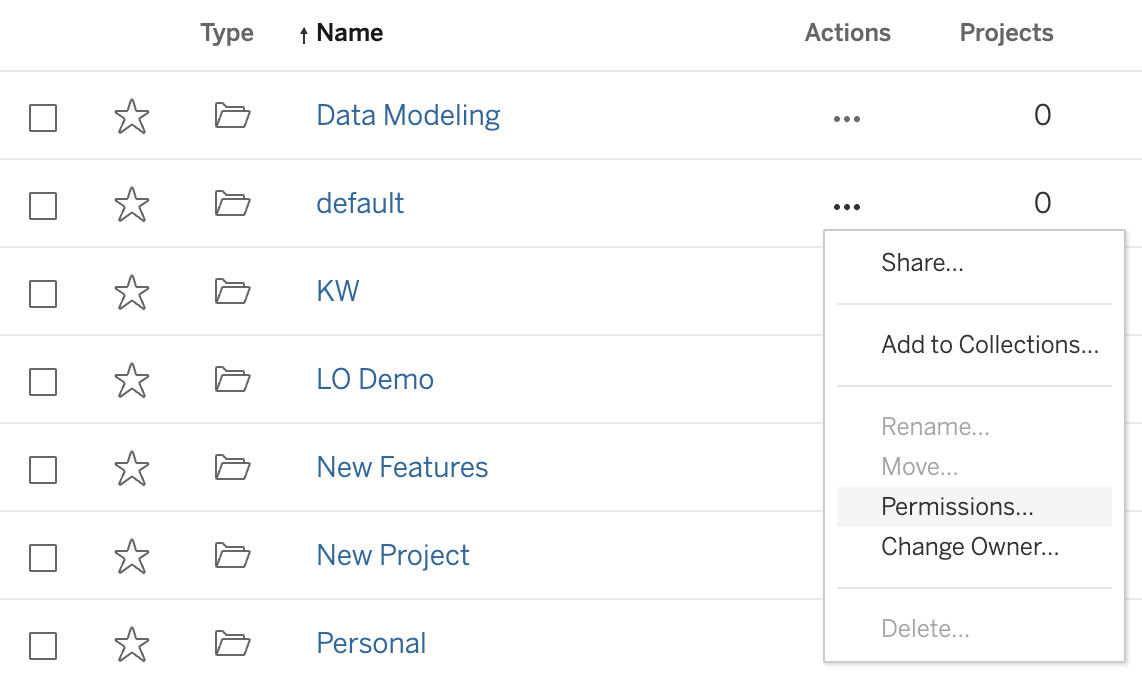
Figure 11.13 – Setting permissions on a project
- The set project permissions dialog box should now be visible, as per Figure 11.14. You will see that there is a group called All Users that has already been assigned permissions to this project. The All Users group includes all users on your Tableau Server or Cloud instance. This group cannot be deleted, so we need to think about which template to apply to this group as a default. Click on ▼ next to the Template option that corresponds to All Users, as per Figure 11.14:

Figure 11.14 – Permissions dialog for projects
We can see the following four options in Figure 11.14:
- View: The user (or users within the group) will be able to see and interact with the content but will not be able to publish new content to the project.
- Publish: The user (or users within the group) will be able to see, interact, and publish (and edit) content to the project. It is important to note that the user will only be able to publish if they have this permission and have a site role of Creator or Explorer (can publish).
- None: The user (or users within the group) will not be able to see or interact with content within the project. The exception to this are users who have the Site Administrator or Server Administrator (Tableau Server only) role.
- Denied: The user (or users within the group) are denied access to the content within the project. The exception to this is users who have the Site Administrator or Server Administrator (Tableau Server only) role.
Denied and None sound similar but serve different purposes. None means that the users or members of the group do not explicitly have access unless they are also in a group assigned with publish or view permissions. Denied means that they explicitly cannot see the project and content within. If they are also in a group with publish or view permissions, they will still not be able to see the project or its contents.
As an example, let’s say we add the Sales group we created in the previous exercise as the only other group to a project and assign it View permission. If the All Users group is set to None on the same project, the people in the Sales group will be able to view all content in the project but no one else in the organization will have access. On the other hand, if the All Users group is set to Denied, the users in the Sales group will not be able to see content in the folder as Denied overrides other access.
With this background, the best practice is to set the All Users group on the default project to None. This will ensure users will not see content they should not see but will still be able to see the content if they are in a group added to a project.
As shown in Figure 11.14, select None and click on the Save button under All Users to make this change.
- To lock permissions on the default project, click on the Edit link next to Asset permission: Customizable in the project permissions dialog. We will now be taken to the Asset Permissions dialog box. Click on the Locked option and leave the Apply to nested projects checkbox selected so that any nested projects (projects created from within other projects) will inherit these permissions. We should see a screen that now looks like Figure 11.15. Click on Save to commit your changes.
Important note
All projects will now inherit whichever settings we have on our default project, except for the Locked option. We must set each new project to a locked state manually after creating it.
Dismiss the dialog box by clicking on the x button at the top right-hand corner:

Figure 11.15 – The Asset Permissions dialog
- Now, let’s create a new project for our sales team. Click on New | Project, as shown in Figure 11.16:
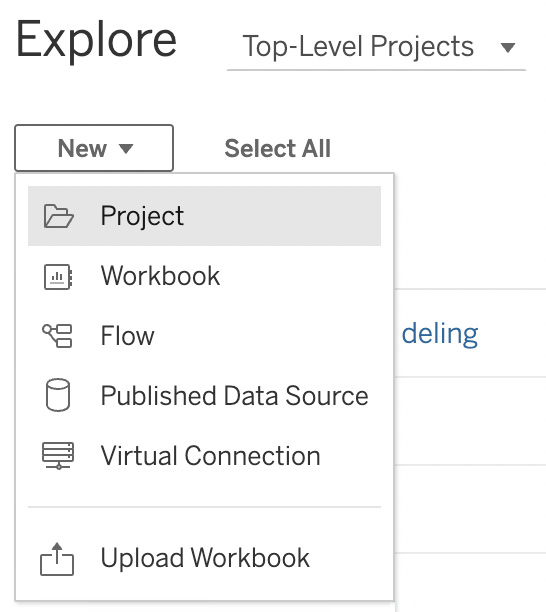
Figure 11.16 – Creating a new project
- Type Sales under Enter a name for the new project:, leave Description blank, and click on Create, as per Figure 11.17:

Figure 11.17 – Sales project
- Find the Sales project in our list of projects and click on the … icon in the Actions column. Then, select Permissions in the same way we did in step 3 of this exercise. You will notice that the All Users group has been assigned None because of the template we created from the default project. Click on the + Add Group/User Role button and search for and select Sales. Set Template to Publish, as shown in Figure 11.18, and click Save to commit these permissions:

Figure 11.18 – Save sales permissions
- As we can see in Figure 11.18, there are tabs to set permissions on many items – Projects, Workbooks, Data Sources, Data Roles, Flows, Ask Data Lenses, and More.
- For our exercise, we will focus on the project level of permissions. In most cases, we can manage access to all content from the Projects permissions with a combination of the users’ license roles. Let’s use our example here. We have a sales department that has five people in a group called Sales. We want one of these people to be our developer to create data sources, workbooks, lenses, and flows. We want the other four people to only be able to view and interact with the content. The simplest way to manage this access is to give the developer the site role of Creator and leave the other four people with the site role of Viewer. Then, we can add the Sales group to the project and give it Publish permissions. Only our developer will be able to publish because the site role overrides the permission. Then, we only need to adjust permissions on other items if we have exceptions. For instance, we might want one developer to create data sources and flows and another to create workbooks and not vice versa. In this case, we could click on the corresponding tabs to limit access to these users as appropriate.
- Next, we will set the project leader from the sales team to manage this project for us. Click on the + Add Group/User Role button. Select the [email protected] user from the top of the list. Then, click on the … icon next to their email address and select Set Project Leader…, as shown in Figure 11.19:

Figure 11.19 – Set Project Leader…
- We will now see the message shown in Figure 11.20. This gives us a warning that we are granting this person administrative capabilities to this project that could be higher than their group permission. Click Set Project Leader to continue with the assignment:
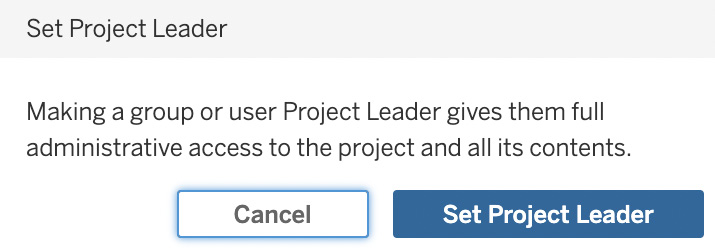
Figure 11.20 – Confirming the project leader
In this section, we learned how to use projects to control access to data sources. We learned how to assign permissions to a project and how we can delegate management to a project leader. Project-level access control determines who can see our published data sources and how people can interact with them. Projects do not control what data people can see within the published data source.
There are times when we might want to allow more general access to a data model than to the data contained within the model. Take, for example, human resources data, such as salaries. Many companies keep this information highly confidential. We don’t want to create a data source for every manager in an organization, or maybe even every employee. That would not be scalable at all as it would be potentially a very long list of data sources and projects. In these cases, we want to add row-level security (RLS) so that we can share our models broadly while still ensuring people only see the data they are authorized to see.
In the rest of this chapter, we will be looking at four different ways to enable RLS in our Tableau data models. In the next section, we will look at enabling it by adding user-based security using a user filter.
Adding user-based security using a user filter
We will begin our exploration of RLS options in Tableau by looking at how to create a user filter inside Tableau.
We will be creating our user filter in Tableau Desktop. Tableau Desktop will need to be connected to the Tableau Server or Cloud instance we used in the earlier exercises in this chapter. The user filter can only be created when Tableau Desktop is connected to retrieve a list of users:
- Open Tableau Desktop and connect to data to start. Select To a File | Text file, find the Product Sales.csv file that we downloaded from GitHub, and click OK. We should now be on the data source page, as shown in Figure 11.21:
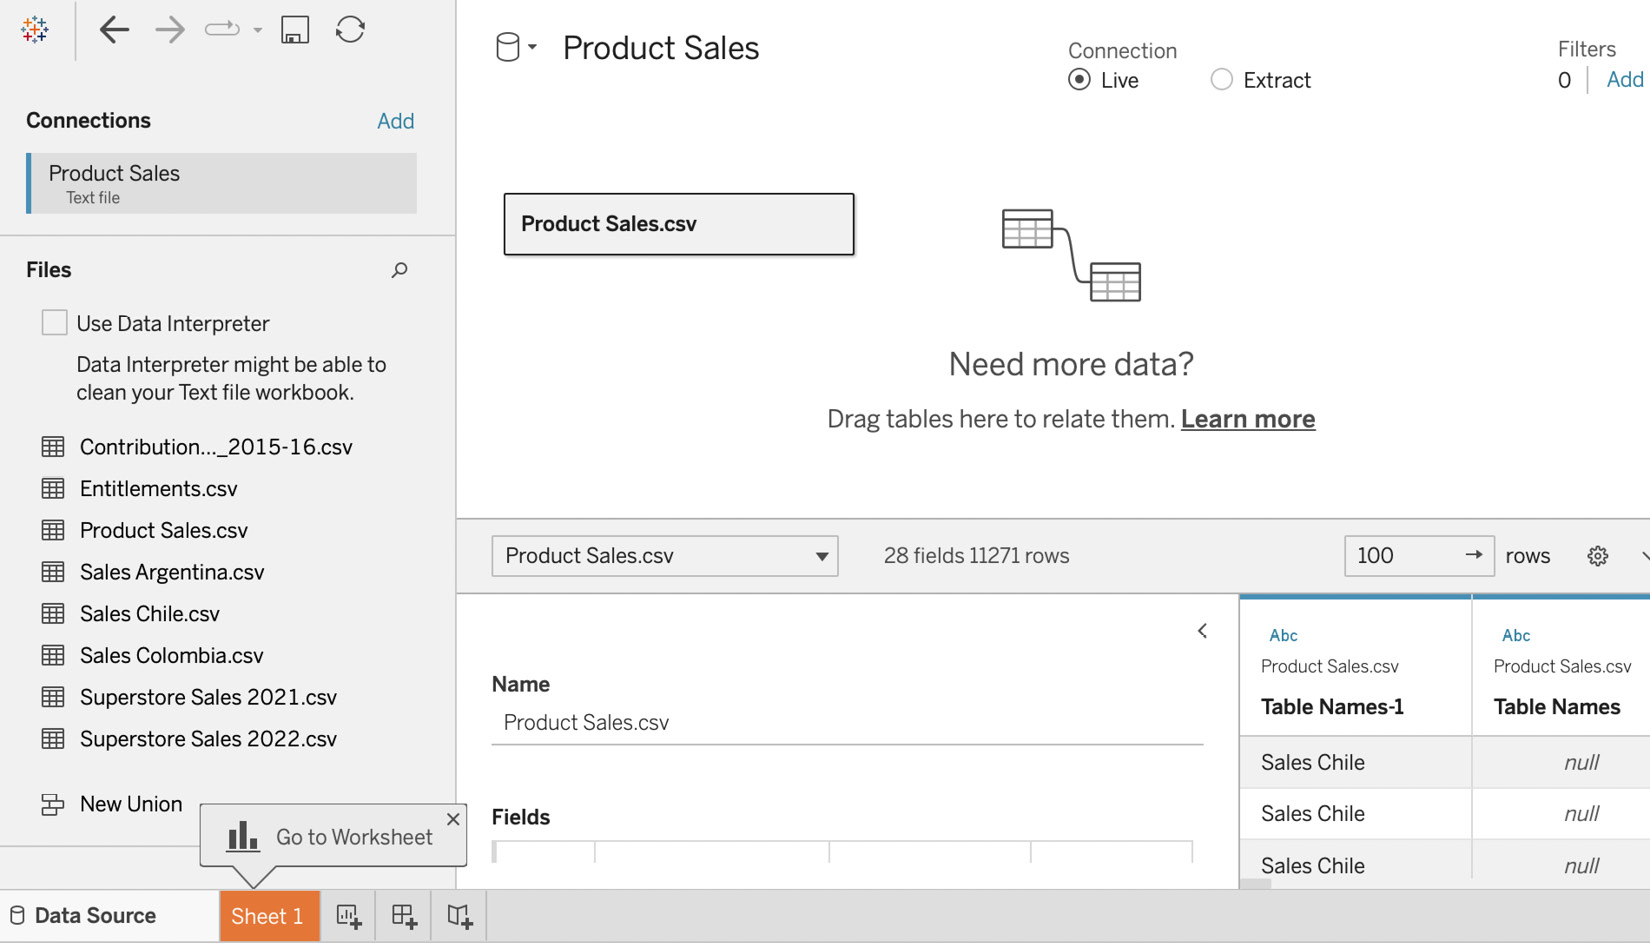
Figure 11.21 – Data source page connected to product sales
- If you aren’t already signed into the appropriate Tableau Server or Cloud instance, from the menu bar, click on Server | Sign in…, as shown in Figure 11.22, and sign in. Once you have signed in, click on Sheet 1 from the bottom left of the screen:

Figure 11.22 – Signing into Tableau Server or Cloud
- Now, we want to create a user filter to ensure that each of the users we previously created can only see the data from the country for which they are responsible. From the menu bar, click on Server | Create User Filter | Country…, as shown in Figure 11.23:

Figure 11.23 – Filtering by country
- We will be taken to the user filter dialog box. Change Name to User Country Filter and click on [email protected] in the User/Group column. Then, check the box in front of Argentina in the Members for: column, as shown in Figure 11.24:

Figure 11.24 – The User Filter dialog
- Click on [email protected] and then check the box in front of Canada. Repeat this for the next three users and countries. Our screen should look like Figure 11.25 once we have added the fifth user. Click OK to create the filter:
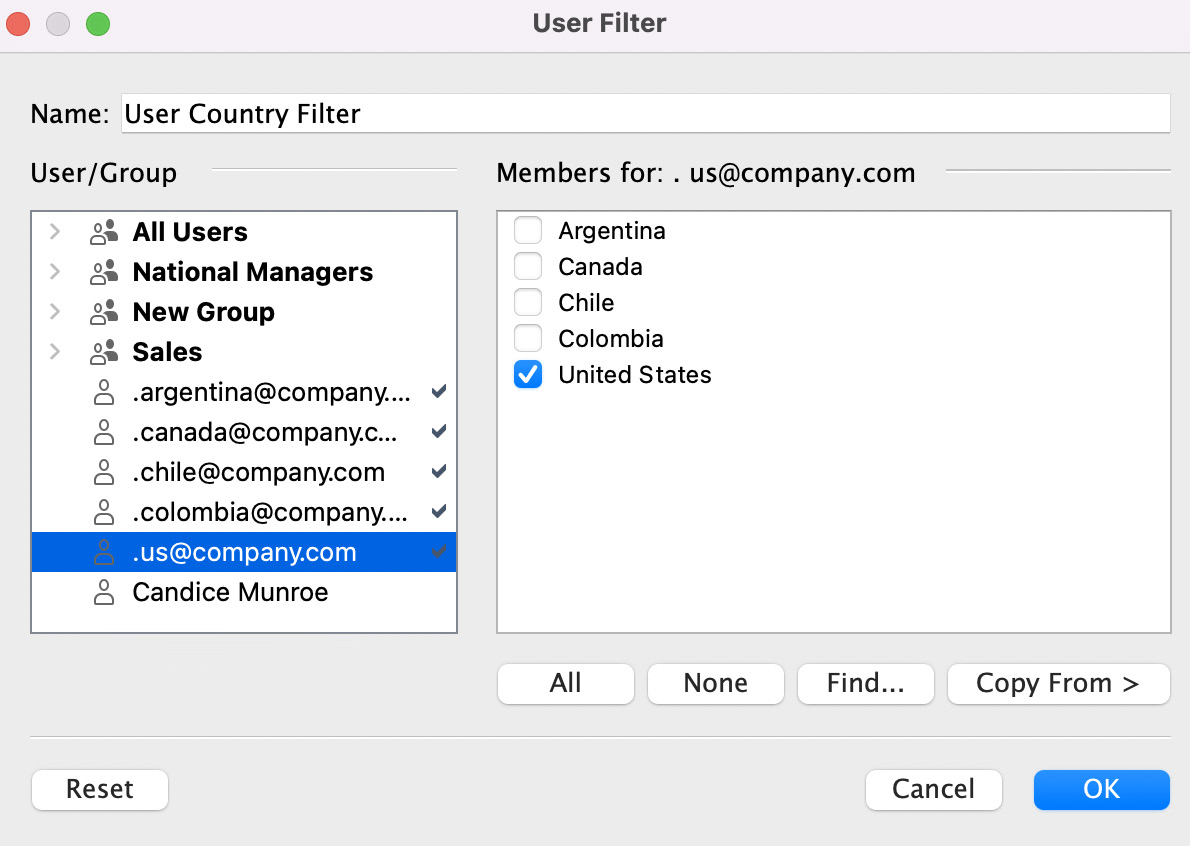
Figure 11.25 – All five members added to the filter
- We will now see our User Country Filter in our data pane. Drag and drop it to the Filters shelf, as shown in Figure 11.26. We will notice that the pill color changes to gray. This means it is a context filter and that it is applied before any other filters we add:

Figure 11.26 – User filter on the filters shelf
- At the very bottom of the Tableau Desktop user interface, toward the right-hand side, we can see the name we used to sign in to Tableau Server or Cloud. Click ▼ next to your name to bring up the Filter as User dialog box, as shown in Figure 11.27. This functionality allows us to see sheets, dashboards, and stories in Tableau as a given user or group would see them. Select [email protected]:

Figure 11.27 – The Filter as User dialog
- To test our filter, double-click on Country in the data pane. We will now only see Argentina on the map, as shown in Figure 11.28. This is due to the combination of the user filter we created and the username we selected in Filter as User:
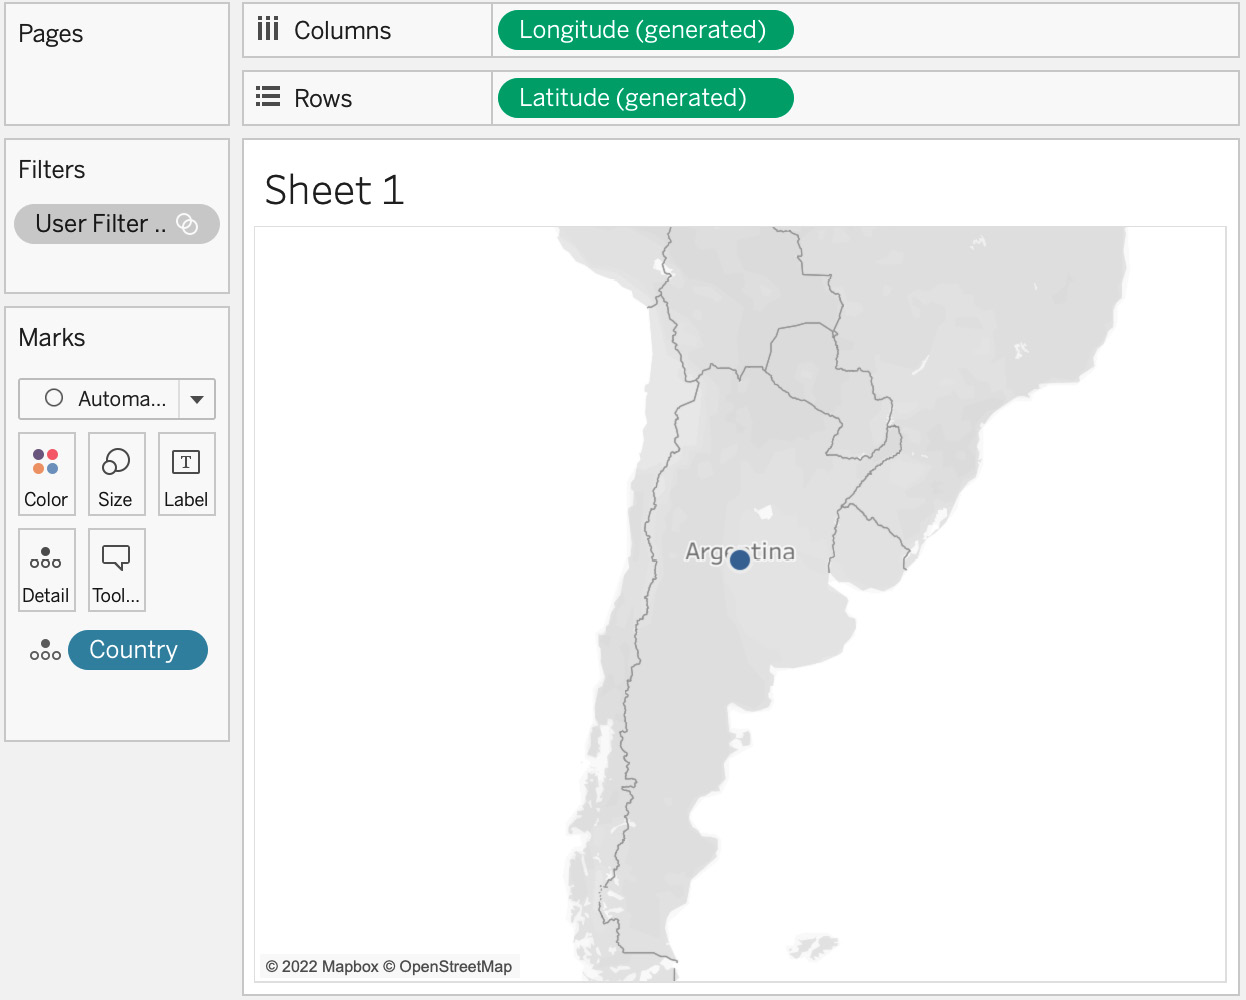
Figure 11.28 – Country seen by [email protected]
- We can continue to test by changing the user in the Filter as User dialog and watching which countries they see. Don’t close Tableau Desktop at this point as we will continue from here in the next exercise.
In this section, we learned how to create user filters manually to achieve RLS. The advantage of this approach is that it is straightforward to create and easy to test if it works.
This approach to RLS does have downsides. The main three downsides are as follows:
- It cannot be used with a published data source as the user filter can only go on the filters shelf on a sheet and cannot be used as a data source filter.
- The addition and subtraction of new users and groups cannot be automated.
- Anyone who can edit the workbook can remove the user filter just by removing it from the filters shelf. When publishing a workbook with a user filter, the best practice is to ensure no one can download or use web edit by setting the appropriate project permissions.
In the next section, we will look at a more robust and scalable option: using an entitlements table.
Adding user-based security inside a published data source using an entitlements table
An entitlements table is a table that identifies users and the data they are entitled to see.
Let’s begin by opening the Entitlements.xlsx file that we previously downloaded from GitHub with Microsoft Excel or another program that opens Microsoft Excel files. This is the same file we used to add our users to Tableau Server or Cloud earlier in this chapter.
The file should look like what’s shown in Figure 11.29:

Figure 11.29 – Entitlements table
This is a simple version of an entitlement table but works well to create our use case. It has two columns. The first is the user’s email, while the second is the countries they are entitled to see. We are going to take this table and join it to the Product Sales.csv table, which contains the Superstore sales data we have been using throughout this book.
Here are two important things to note before we start this exercise:
- First, as mentioned in Chapter 9, relationships will not work for this use case; we need to use joins.
- Second, we need to use a published data source as we will be building a filter. If we use this as a data source filter in a published data source, workbook authors will not be able to remove the filter. If the filter is in an embedded data source, a workbook developer could remove the filter, opening the rows for everyone to see.
We will pick up this from the exercise in the previous section:
- Click on the Data Source tab to be taken to the data source page. Click on the ▼ icon next to the Product Sales.csv card and select Open, as shown in Figure 11.30:

Figure 11.30 – Opening Product Sales.csv to create a join
- Click on the Add link next to Connections. In the To a File section, select Text file, find the Entitlements.csv file, and select OK. Drag and drop the Entitlements.csv file to the right of Product Sales.csv in the canvas. Our screen should now look like Figure 11.31:

Figure 11.31 – Joining Product Sales.csv and Entitlements.csv
- Create an inner join by selecting Country from the Product Sales (left) table and Countries can see from the Entitlements (right) table, as shown in Figure 11.32:
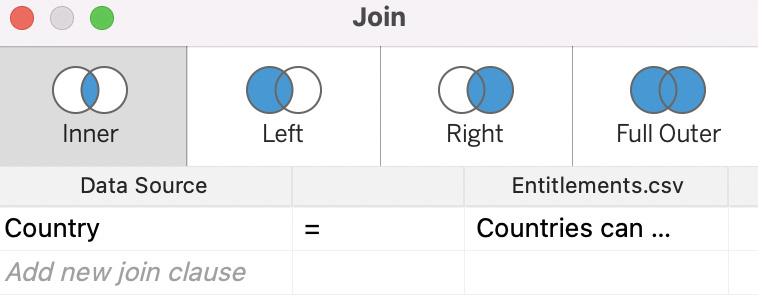
Figure 11.32 – Country joined to Countries can see
- Click on the red x button in the top left-hand corner to dismiss the join dialog box. Create a new sheet by clicking on the New Worksheet icon to the right of Sheet 1, as shown in Figure 11.33:
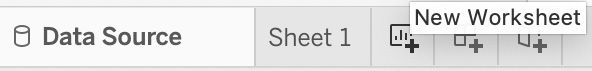
Figure 11.33 – New Worksheet
- From the menu bar, select Analysis | Create Calculated Field…, as shown in Figure 11.34:

Figure 11.34 – Create Calculated Field…
- Type USERNAME() = [Email] in the calculated field dialog box and name the field User Filter, as shown in Figure 11.35; then, click OK. As we start typing, Tableau will autocomplete fields for us. This calculation will return a Boolean value of True or False. The USERNAME() function returns the email of the user signed into the session. As Email is a field in our data model on every row, we will get a True value returned when the row matches with the user who is signed in and a False value when the email field on the row does not match. If our entity table was set up to work on groups instead of users, Tableau has a function called ISMEMBEROF() to check the signed-in user against the groups to which they belong:
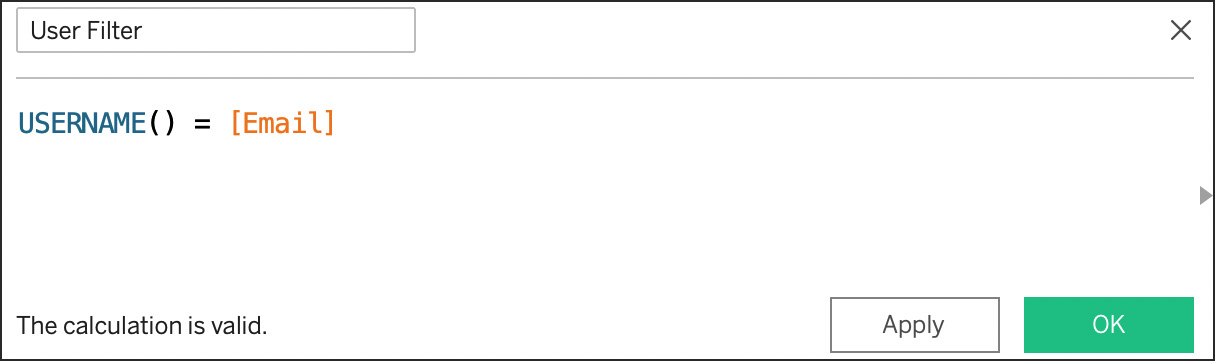
Figure 11.35 – Creating a user filter
- Set the Filter as User to [email protected]. Click on the Data Source tab to be taken to the data source page. Click on the Add link in the top right-hand corner, as shown in Figure 11.36:

Figure 11.36 – Adding a data source filter
- This will bring up the data source dialog page. Click on Add…, which will bring up the Add Filter dialog box. Scroll to the bottom to find the User Filter field we created and press OK, as per Figure 11.37:
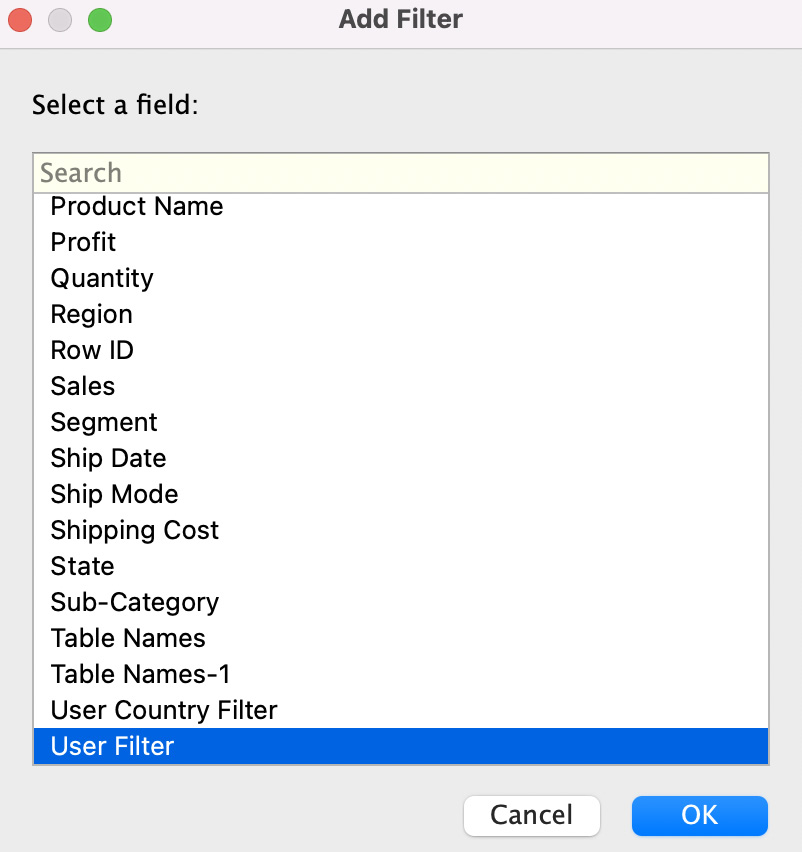
Figure 11.37 – Adding the User Filter field as a data source filter
- We will now get the option to choose either True or False. If you only get the option to choose False, go back to Sheet 1 and ensure the Filter as User is set to one of the @company.com users we created earlier in this chapter. Check the box in front of True and leave the box in front of False unchecked, as shown in Figure 11.38. Click OK to commit this change:
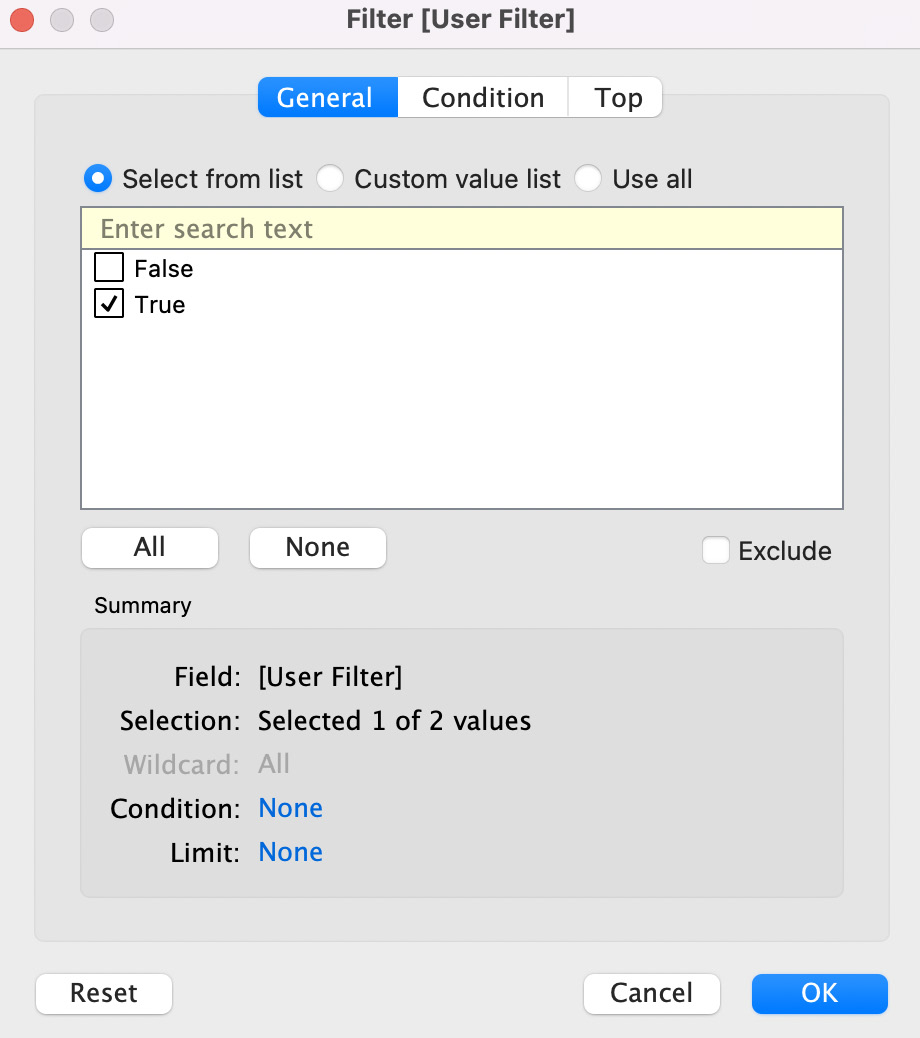
Figure 11.38 – Keeping True checked
- This will leave us on the Edit Data Source Filters dialog. Press OK to accept this filter, as shown in Figure 11.39:

Figure 11.39 – All data source filters
- Click on Sheet 2 so that we can test our filter. Ensure that we are filtered to the [email protected] user and then double-click on Country in the data pane. Our screen should now look like what’s shown in Figure 11.40. Notice that the user can only see Argentina and that the filter shelf is empty. The data source filter is working. If we want to see the filter continue to work, change the Filter as User value and watch the map change:

Figure 11.40 – The Argentina user can only see Argentina data
With that, we’ve learned about a second way to create RLS in Tableau by using an entitlement table. The advantages of this approach over the manual approach we learned about in the previous section are as follows:
- It can be used with a published data source, so it stays secure if others create workbooks from the data model
- The addition and subtraction of new users and groups can be automated by updating the table without any manual work required in Tableau
In the next section, we will discuss how RLS can be implemented in virtual data connections.
Using Tableau virtual connections to manage access and security
We were introduced to Tableau virtual connections in Chapter 2. Virtual connections are enabled in Tableau Server and Cloud with Data Management. Virtual connections allow us to create an additional layer between our database(s) and Tableau data models. This feature makes sense when an organization delegates the building of data models to individuals who understand data in organizational content but may not understand database structures. The person who creates the virtual connection can perform tasks such as hiding and renaming columns in the database. The data modeler from the organization can then create a published or embedded data source of the virtual connection.
One of the other features of virtual connections is data policies. Data policies work in a very similar manner to the ones we described in the previous section on entitlement tables. Using a virtual connection in this manner also moves security closer to the database. For example, if someone in the human resources department is responsible for creating a data model for all human resources, they could protect salary information by using entitlement table(s). In this approach, this person would still see salaries. Using data policies within a virtual connection and then allowing the human resources data modeler to connect to the virtual connection would protect salary information from the data modeler.
Virtual connections can only be used with data servers and cloud drives. Installing and configuring a data server is beyond the scope of this book, so we will leave this section as-is. In the next section, we will explore leveraging the native capabilities of data servers for row and column-level security.
Leveraging database security features for both row and column-level security
We often don’t need to create RLS for users in Tableau as user security is already handled by database servers. Some database servers also have column-based security. As an example, you might want to let the human resources department see everything about employees except the data contained in the salary column.
If security is already set in the database, Tableau will respect the security in the database. However, the default behavior is to prompt the user inside Tableau. This is not the best user experience. To enable a better user experience, we want to enable Tableau to pass the user credentials they used to sign in to Tableau to the database so that they don’t have to sign in a second time.
Tableau allows for single sign-on (SSO) with some databases. There are a few techniques for SSO, depending on the database technology, including impersonation, initial SQL and Kerberos, and constrained delegation.
As mentioned in the previous section regarding virtual connections, installing and configuring a data server is beyond the scope of this book, so we will leave this section as-is as well.
Summary
In this chapter, we explored data access and data security on the Tableau platform. We began by adding users and groups to Tableau Server or Cloud.
We spent time creating and using Tableau projects to manage data models and content access and capabilities. We learned that locked projects are the best practice for managing access to data models across an organization.
Then, we looked at managing access to the data inside models using RLS. We saw how RLS works using manual user filters and adding users by using entitlements tables. Then, we discussed the pros and cons of each approach.
In the final two sections of this chapter, we looked at Tableau virtual connections and native database security to manage secure user access to the data within our data models.
We will look at data modeling considerations for Ask Data and Explain Data in the next chapter. These are machine learning capabilities for casual users that work best when our data models are tailored for each of them.