10
Sharing and Extending Tableau Data Models
We discussed creating data models using Tableau Prep Builder in Chapters 4 to 6 and using Tableau Desktop in Chapters 7 to 9. This chapter focuses on sharing and extending Tableau data models using published data sources and extending the model using hierarchies, folders, descriptions, grouping, and calculations. This chapter also explores the details and implications of live versus extracted data and embedded versus published data sources. Understanding the concepts in this chapter is key to being able to create data models that can be scaled and leveraged by the entire organization.
In this chapter, we’re going to cover the following topics:
- Understanding live connections and extracts – scenarios of when to use each of them
- Creating extracts with the Tableau Hyper engine
- Understanding data sources and extract filters and their use
- Understanding the implications of an embedded data source versus a published data source
- Creating a published data source from the web interface of Tableau Server or Cloud
- Extending the Tableau data model with calculations, folders, hierarchies, grouping, and descriptions
Technical requirements
To view the list of complete requirements needed to run the practical examples in this chapter, please see the Technical requirements section in Chapter 1.
The exercises and figures in this chapter will be described by using both the Tableau Desktop client software and the Tableau Server and Cloud web user interface.
To run the exercises in this chapter, we will need the following file:
- Superstore Sales Orders - US.xlsx
- Superstore Sales 2022.csv
The file we will be using is based on the Superstore data, the sample data that Tableau uses in their products.
The files used in the exercises in this chapter can be found at https://github.com/PacktPublishing/Data-Modeling-with-Tableau/.
Understanding live connections and extracts – scenarios for using each
When you first connect to a data source in Tableau Desktop or via the Tableau web client, the default connection type is set to live. A live connection means that Tableau will use the query engine of the data source engine for every query from Tableau. This also means that the data in your Tableau workbooks will always be fresh or up to date with the information that is in the underlying data source.
The alternative to live connections is extracts. Extracts copy the data from the underlying data source and extract them to Tableau’s high-performance analytic data engine, Hyper. We will be looking at extracts and the Hyper engine in the next section of this chapter.
Live connections might seem like the obvious choice as they ensure the data is up to date and they don’t require the moving of data. Another good, and sometimes necessary, use case for live connections is when the data engine has user-based security embedded and security administrators want applications such as Tableau to respect and leverage those security models. However, live connections often perform slower when the data engine is under load from other applications, not optimized for read queries, or connected to Tableau Server or Cloud through a slow connection. The administrator of the data engine also might not want Tableau to run live queries against it.
Another case for extracts is file-based data connections as the files do not have a query engine to leverage. In fact, for some file types, such as JSON files, Tableau forces you to create an extract. For other flat files, Tableau will create a shadow extract, which is a temporary extract, even when you leave the connection set to live.
A quick reference for when to use live versus extract connections is seen in Table 10.1.
|
Consider a live connection when: |
Consider an extract when: |
|
|
Table 10.1 – When to use live connections versus extracts
Now that we understand when to use live connections versus extracts, let’s look at how we can create extracts with the Tableau Hyper engine.
Creating extracts with the Tableau Hyper engine
On the top right-hand section of the canvas on the data source page, you can change your data connection from live to extract. This will cause Tableau to make a copy of your data and place it in a .hyper file to be managed and queried by the Tableau Hyper engine.
Hyper is a database engine that has been in the Tableau stack since version 10.5, in early 2018. Hyper is designed for high data throughput for both loading data and analytical queries. Tableau allows you to change many settings regarding how data is stored and queried in Hyper within Tableau Desktop and the web user interface. Let’s look at these features and what they mean when it comes to creating data models:
- Open Tableau Desktop. When you open Tableau Desktop, you will see the connect pane on the left-hand side of the user interface. From the connect pane, under the To a File section, select Microsoft Excel. Locate the Superstore Sales Orders - US.xlsx file, select it to highlight it, and click on Open.
- You will now be on the data source page. On the top right-hand corner of the canvas, click on the Extract radio button, as seen in Figure 10.1:

Figure 10.1 – Converting a data source into an extract

Figure 10.2 – The Extract Data dialog box
- The first setting is the choice between Logical Tables and Physical Tables. Logical Tables means that any tables in our data source will be extracted into Hyper as distinct tables. Physical Tables means that the tables will be joined into a single table. You will notice that Physical Tables is grayed out. Logical Tables is the only option when we have a single table and when we are using relationships. If we were using a data source with two or more tables connected with join(s), the Physical Tables option would be available for selection. In this case, query performance can vary significantly between these options. As a rule of thumb, if one or more of the tables is much smaller than the other in terms of row count, logical tables will typically perform better; if the tables are of approximately the same length, physical tables will typically perform better. Because Tableau makes it so quick and easy to change options, it is always worth testing both options after we have built out analyses on our data source. We can test this using the Performance recording feature, which is native to the Tableau platform.
- The next section is where we can control the amount of data we will extract by using extract filters. To see how a filter works, click on Add…. Notice that the fields in our data source come up as an option, as seen in Figure 10.3:

Figure 10.3 – The Add Filter dialog
- Click on the Region field and notice the additional dialog box in Figure 10.4. In our use case, we are building a data model for analysts who only work with teams from the East region. Click on the East region and click on OK. The next time the extract runs, only data from the East region will be moved to Hyper:

Figure 10.4 – Extracting data only for the East region
- Now, we will notice that the filter section of our extract dialog box will show our filter and allow us to either Edit… or Remove the filter, as seen in Figure 10.5:

Figure 10.5 – Ability to edit and remove existing filters
- The next section allows us to aggregate our data. As an example, with the Superstore dataset, data is at the transactional level with one row for every product sold on each sale. If this was a real retailer, this would result in a lot of data. If the company only needed to analyze data at the level of the day, Tableau makes it easy to do this aggregation in an extract. Click on Aggregate data for visible dimensions, then Roll up dates to, and select Day, as seen in Figure 10.6:
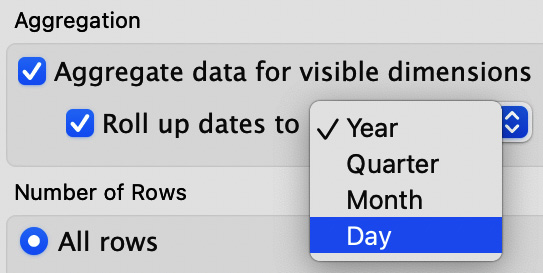
Figure 10.6 – Aggregation options
- Unclick the aggregate option as we do not want to aggregate in our exercise. We now have the option for an Incremental refresh. An incremental extract means that Tableau will only add additional rows based on a field we select. Looking at Figure 10.7, we can see a scenario where the US Sales Transactions table will refresh every time new dates are found in the Order Date field. In other words, the extract will look at Order Date from the last load and only load new rows if Order Date is more recent in the source data. Unselect Incremental refresh as we want to load all the data:

Figure 10.7 – Incremental refresh options
- The next section is used for sampling large datasets before loading all the data. As shown in Figure 10.8, you can sample data based on the first number of rows or have Tableau create a random sample for you. As our data source does not contain many rows, we do not need to use the sample option:

Figure 10.8 – Sampling data
- The final section of the extract dialog box contains two buttons, History… and Hide All Unused Fields. Clicking on History… will show us the history of extract runs. The Hide All Unused Fields option is a way to ensure that all fields that aren’t used in the analysis in the workbook aren’t brought into the extract. This can help with both query performance and space on disk. However, only use this field after analysts have finished building out their analyses in the workbook; the fields are not available after the extract is run unless they unhide the fields and run the extract again. Click on Cancel to dismiss the dialog. Leave your screen on the data source page. We will pick up from this point in the next section.
In this section, we learned how to create an extract and when it should be used. In the next section, we will look at extract and data source filters and understand how and when to apply each.
Understanding extracts and data source filters
In the previous two sections of this chapter, we learned about live and extract connections. We also looked at both data source and extract filters. In this section, we will look at how they work in more detail:
- Continuing from the previous exercise, notice the top right-hand corner of the canvas, as seen in Figure 10.9:

Figure 10.9 – Extract and data source filters
- When an extract is selected, we notice that Tableau will tell us when the extract was last run and if it includes all or some of the data from the underlying data source. Clicking on Refresh will load our extract based on the settings that we specify in the extract settings dialog. Clicking on Edit will take us to that dialog, as we detailed in the previous section. One of the options in the dialog box is to filter the rows in the extract based on one or more fields, as illustrated in step 5 of the exercise in the previous section. In the case of an extract, these filters are applied before all other filters – that is, these filters work to control what comes into our newly extracted data source.
- To the right of the Connection section is the data source Filters section. Click on Add to create a data source filter. You will then see a dialog as per Figure 10.10. This user experience is now the same as adding an extract filter:
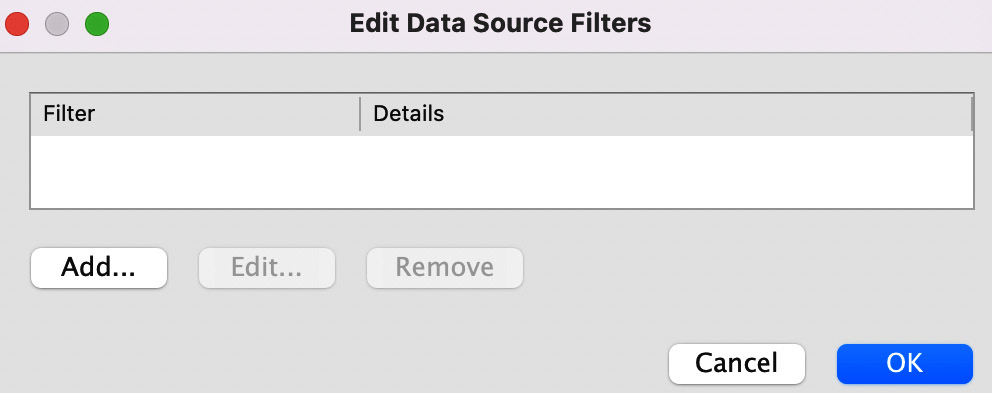
Figure 10.10 – The Edit Data Source Filters dialog
- Click on the Add… button and choose the Segment field. You should see a dialog that looks like Figure 10.11:
![Figure 10.11 – Filter [Segment]](https://imgdetail.ebookreading.net/2023/10/9781803248028/9781803248028__9781803248028__files__image__B18338_10_11.jpg)
Figure 10.11 – Filter [Segment]
- You will be on the General tab, where you can manually select which values you want to filter from your data. By default, whichever values you select are included in the filter. You can select the values you want to exclude from your data by selecting values from the list and then selecting the Exclude option. In a large dataset, it might not be practical to manually select values, so Tableau also gives you the option to filter by Wildcard, Condition, and Top.
- As a final step, click Cancel to be taken back to the data source filter dialog, and then click Cancel from that dialog as well. Leave Tableau Desktop open here. We will continue from this point in the next section.
In this section, we explored two different types of Tableau filters, extract filters and data source filters. When we use extract filters, we are telling Tableau which data it doesn’t need to move from the underlying data source to the Tableau extract. Extract filters play an important role in limiting the size of an extract, which saves query time, network traffic, and space on disk by storing smaller extracts.
Data source filters tell Tableau which data to not return in the queries generated by analysts and developers. In the case of live connections, data source filters are the first filters applied in the Tableau order of operations. In the case of extracts, data source filters are applied after extract filters. That is, Tableau first applies the extract filters to limit the size of the extract and then applies the data source filter to the data in the extract.
We will look at published and embedded data sources in the next section.
Understanding the implications of an embedded data source versus a published data source
Tableau data models can be embedded in workbooks or accessible to many workbooks as published data sources.
We looked at the data model output options for Tableau Prep Builder in Chapter 6. We learned that Tableau Prep Builder can output to files, as well as output extracts as Tableau Hyper files, database tables, and published data sources. Most use cases of Tableau Prep Builder result in data models as published data sources to Tableau Server or Cloud.
In this section, we will look at publishing with embedded data sources and publishing data sources from Tableau Desktop:
- Picking up from our previous exercise, click on Sheet 1 to get a blank sheet. At this point, you might be prompted to create an extract. You can follow the default options to create an extract or click cancel to return to a live connection. Either type will work for the rest of this exercise.If the sheet is not blank, click on the Clear Sheet icon (
 ) from the toolbar to ensure there is nothing on the sheet. Also, ensure there are no other sheets with information in the workbook, as per Figure 10.12:
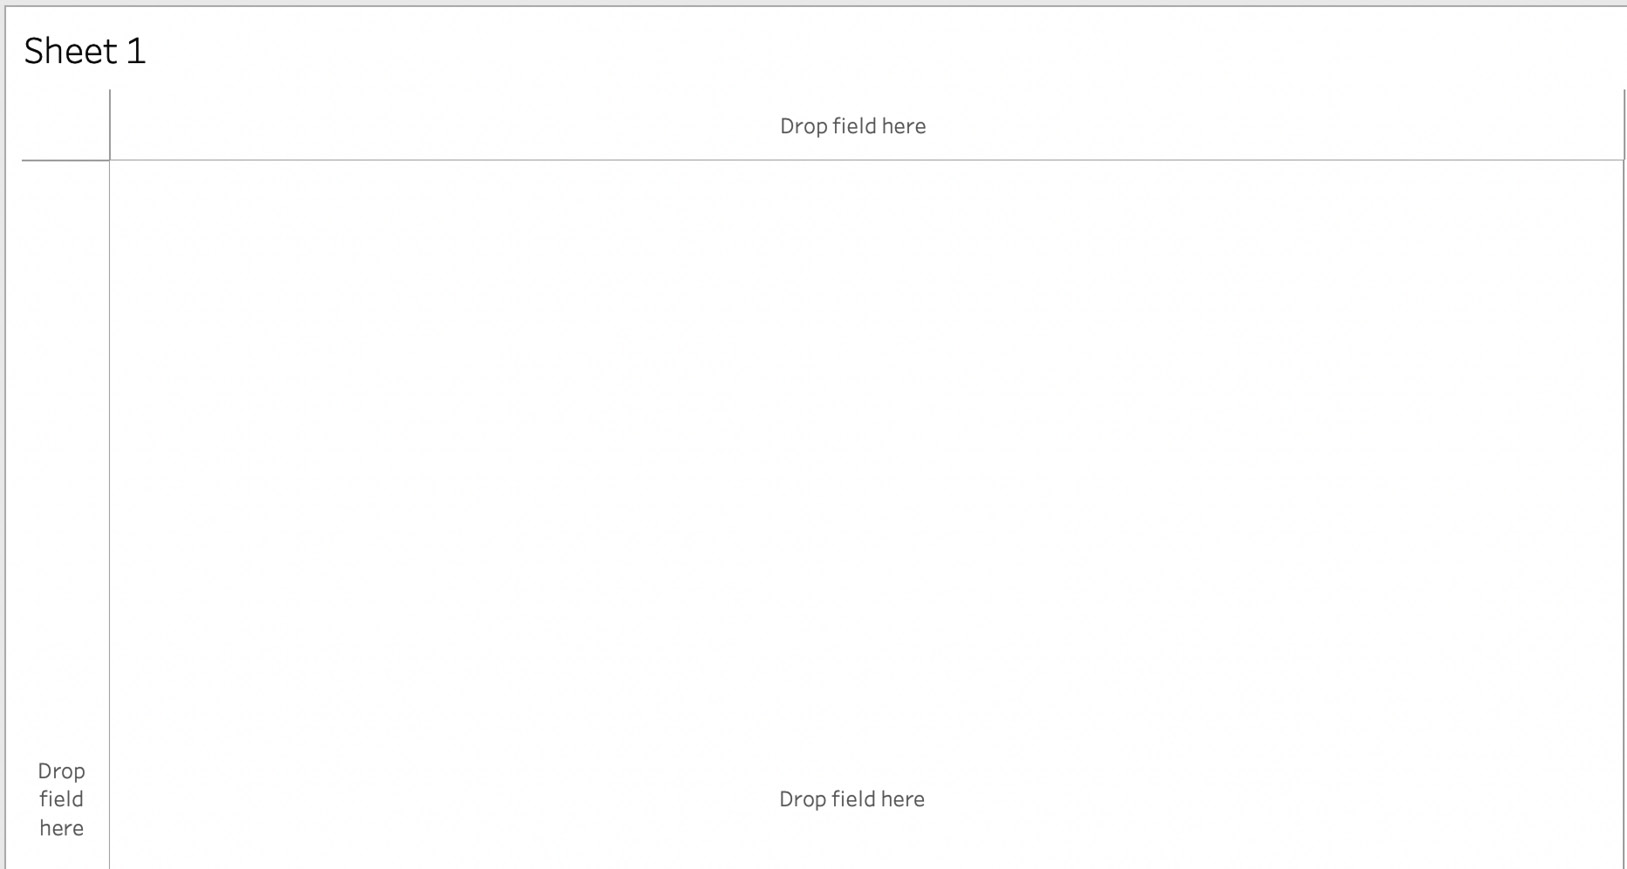
Figure 10.12 – Clean Sheet 1
- Click on the Server option from the menu bar and notice that Publish Workbook… is grayed out and not available as an option, as per Figure 10.13. The reason is that none of the sheets have data on them, so the workbook is empty:

Figure 10.13 – Publish Workbook… grayed out
- Let’s add something to Sheet 1 to populate our workbook. Double-click on Sales to bring it into the view and then double-click on Segment to break sales into segments in the view. Our sheet should now look like Figure 10.14:

Figure 10.14 – Sales by Segment
- We should now be able to publish our workbook. Click on the Server menu item from the menu bar and then click on Publish Workbook…. If you are not signed in to Tableau Server or Cloud, you will be prompted to sign in. Please sign in to continue. You will then be presented with a dialog box that looks like Figure 10.15:

Figure 10.15 – The Publish Workbook to Tableau Online dialog
- There are several settings available when publishing a workbook. The setting we want to look at in this exercise is the Data Sources section. Click on the Edit link next to 1 embedded in the workbook. This will bring up a dialog box like the one shown in Figure 10.16:

Figure 10.16 – The Manage Data Sources dialog
- The first thing we notice in this dialog is that one workbook can have multiple data sources. In our case, we have a single data source. Next to each data source, there is a choice for Embedded in workbook or Published separately. There is also an option for Authentication. If the connection is to a data server, we can decide to embed credentials in the data source or prompt the user for their username and password combination. In our case, there is nothing under Authentication because we are connected to Microsoft Excel and not a data server. If we pick a Project where we can publish, give the workbook a Name, and keep the data source embedded, it will publish without any other prompts. This means the data source and associated data model are embedded in the workbook and cannot be used as a shared data model for other users.
- Let’s see what happens when we publish our workbook with Publish Type selected as Embedded in workbook. Make this change as per Figure 10.17:

Figure 10.17 – Publish with embedded connection
- Select a Project to publish into and give the workbook a Name; then, click on Publish. Tableau will drop us into the workbook in the Tableau Server or Cloud user interface, as seen in Figure 10.18:

Figure 10.18 – Published workbook in the web user interface
You will see that there is one data source in our workbook. The option to embed a data source comes down to the type of use case. An embedded data source makes sense when the person responsible for the data model is the same as the person responsible for the analysis and dashboard development in the workbook and when the data model is not needed by other people in the organization. Embedded data sources are not available to other workbook authors. This does help manage content on Tableau Server and Cloud as analysts and dashboard developers who are looking for data models to start their analyses won’t see these.
As this book is aimed primarily at data stewards who create data models for other people to use, the embedded data source option is not likely to be useful. When we are building data models for others to use, we need to use the published data source option. Let’s continue this exercise to see how we share our data model as a published data source:
- Click on Server in the menu bar and select Publish Data Source this time. Select US Sales Transactions (Superstore Sales Orders – US), as per Figure 10.19:

Figure 10.19 – Publish Data Source
- The Publish Data Source to Tableau Online dialog will appear, as seen in Figure 10.20.

Figure 10.20 – Publish Data Source to Tableau Online
Choose a Project to publish into or leave the Default project as-is. Change Name to something shorter and more descriptive, such as US Sales Transactions. We can also give it a Description and add tags to make it easier to search for on Tableau Server or Cloud. Permissions can be set unless the permissions are locked to the project, which we will discuss in Chapter 11. When we are using Tableau Cloud, we will also get a warning about Tableau Bridge for on-premises data sources such as our Microsoft Excel file. We will discuss Tableau Bridge in detail in Chapter 14, so let’s ignore this warning for now.
Finally, select the final two tick marks – that is, Include external files and Update workbook to use the published data source. If we don’t tick this last box, any changes we make to our published data source will not be reflected in the workbook. Click Publish to publish our data source to Tableau Server or Cloud. Keep Tableau Desktop open at this point as we will pick up from this point in the final section of this chapter.
At this point, we will be taken to a new page in our browser. This is the data source page, as seen in Figure 10.21. People can now use Ask Data with our data source or connect to it from the web client, Tableau Desktop, or Tableau Prep Builder. We will look at extending our data model by creating a lens for use with Ask Data in Chapter 12.
Using published data sources is the best practices method of sharing data models in the organization to be used by people looking for a full-text search path to analysis with Ask Data, authors using Tableau Desktop and the web client, and other data modelers who want to use extend or model with Tableau Prep Builder.
In this section, we looked at embedded and published data sources, how to create each, and the use cases for each. Next, we are going to look at creating a published data source in the web client of Tableau Server or Cloud.
Creating a published data source from the web interface of Tableau Server or Cloud
Tableau Desktop is the Tableau client for building both workbooks and published data sources. When using the Tableau web client, there are two distinct experiences for creating workbooks and published data sources. In this section, we will create a published data source from the web interface of Tableau Server or Cloud:
- From a web browser, sign in to your Tableau Server or Cloud. Navigate to Home. From the home screen, you should see a New icon. Click on the New icon to bring up the options shown in Figure 10.21:

Figure 10.21 – New options in the Tableau web user interface
- If your Tableau Server or Cloud is not licensed for data management, you will not see the Flow and Virtual Connection options. For this exercise, we want to focus on the Published Data Source option. If you want to try this independently, you can click on the Workbook option, and you will be prompted to connect to data. You should see the published data source we created in the previous exercise, demonstrating the value of published data sources. The web client’s Workbook experience is very similar to creating a workbook in Tableau Desktop. For now, we will create a new Published Data Source by clicking on that option. You will be prompted to connect to data. Select the File tab and upload the Superstore Sales Orders - US.xlsx file that we have been working with in this chapter. Your screen should now look like Figure 10.22:

Figure 10.22 – Creating a published data source on the web
- Notice that there is no option to create sheets and dashboards like we would see if we created a new workbook. This interface allows us to test the data on a scratchpad, but it is intended only to create published data sources and not workbooks. To see it in action, click on the Publish As... button at the top-right of the screen. A dialog will come up, as seen in Figure 10.23:

Figure 10.23 – The Publish Data Source dialog in the web client
- This dialog has fewer options than the publish data source option from Tableau Desktop. Just give your data source a Name and Project where it is to be published and we are good to go.
In this section, we learned about the web client option to publish data sources from Tableau Server and Cloud. This option is often a better option than using Tableau Desktop as it is custom-built for building published data sources.
Now that we have looked at how to build and publish data models, let’s look at how to make them even more useful by enhancing the metadata in them and adding calculations.
Extending the Tableau data model with calculations, folders, hierarchies, grouping, and descriptions
When creating data models, Tableau allows us to extend and enhance our models for easier and more robust analysis by adjusting the metadata in the model and adding calculations. Let's create a calculation for Profit Margin %:
- Open Tableau Desktop. From the connect pane, under the To a File section, select Text file. Locate the Superstore Sales 2022.csv file and click Open. Click on Sheet 1. Right-click on Profit and select Create | Calculated Field from the menu, as seen in Figure 10.24:

Figure 10.24 – Creating a calculated field
- In the calculation dialog box, give your calculation the name Profit Margin % and enter SUM(Profit)/SUM(Sales) as seen in Figure 10.25. Then, click OK to finish creating the calculated field:
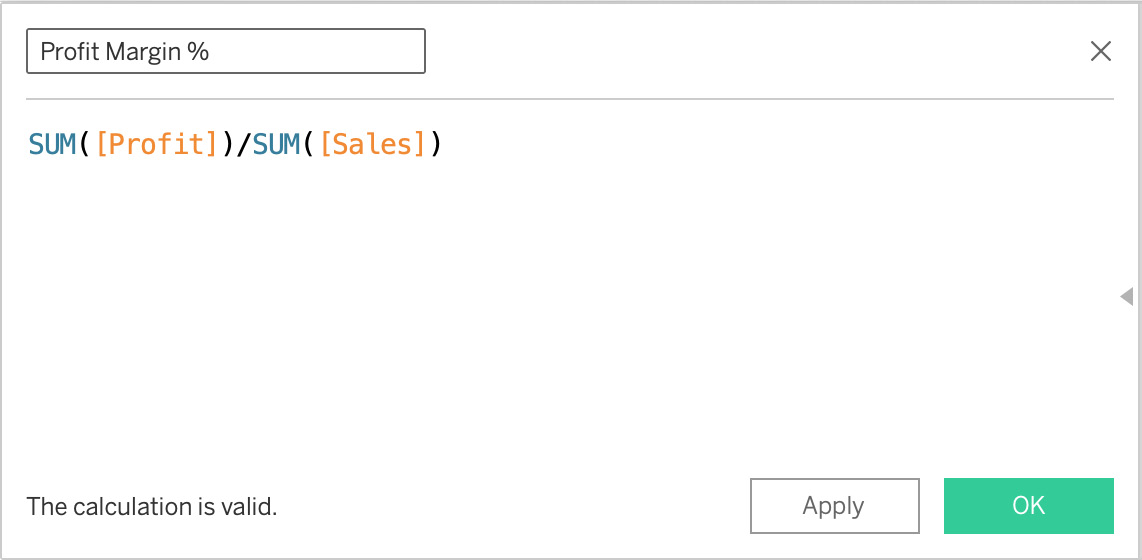
Figure 10.25 – Calculated field
- Next, we will add a description to our calculated field via a comment. Right-click on the newly created Profit Margin % field and select Default Properties | Comment from the menu, as shown in Figure 10.26:

Figure 10.26 – Adding a comment to a field
- In the text box, enter This field is our official calculation for Profit Margin %, please use this in your analysis when presenting profit margin. and click OK. When you hover and leave your pointer over Profit Margin % now, the text should appear in the tooltip.
- Next, we will create a hierarchy. Creating a hierarchy allows analysts and data consumers to drill down into the data. To create our hierarchy, hold down your left mouse button as you click on the Sub-Category field in the data pane. Keeping the mouse button held down, drag Sub-Category on top of the Category field and release the mouse button. You should then be presented with what’s shown in Figure 10.27:

Figure 10.27 – Create Hierarchy
- Enter Product Hierarchy over the Category, Sub-Category text and press OK. You should now be presented with the hierarchy seen in Figure 10.29 in the data pane:

Figure 10.28 – Product Hierarchy
- Continuing to add to the hierarchy, hold down the left mouse key and click and hold on Product Name. Drag the field under Sub-Category until you see the horizontal line appear and then release the mouse button. Your hierarchy should now be three levels with Product Name as the third and lowest level. If you happen to release the field into the incorrect level of the hierarchy, you can always drag and drop it into the correct order using the same technique.
- To see the hierarchy in action, drag and drop Product Hierarchy to the Columns shelf and Profit Margin % to the rows shelf in the view, as seen in Figure 10.29. You will notice a bar chart with a bar and value for each of the three categories. You will also see that Tableau colors Category in blue because it is discrete and Profit Margin % in green because it is a continuous field. When these fields are in the view (for example, in columns and rows in this case), they are referred to as pills because of their shape:

Figure 10.29 – Hierarchy in the view
- Next, let’s click on the + symbol in front of the blue Category pill. Our view will drill down one level to show the Profit Margin % property of Sub-Category. If we click on the + symbol in front of Sub-Category, it will drill down to the next level of Product Name. You can see this in Figure 10.30:

Figure 10.30 – Expanded hierarchy
- One other thing you will notice in the view is that Profit Margin % is shown as a fraction with two decimal places. We can change this formatting so that it is ready for analysts to use. To do this, right-click on Profit Margin % in the data pane and select Default Properties | Number Format, as seen in Figure 10.31:

Figure 10.31 – Changing the number format
- We now have a few choices available to use for formatting. Feel free to explore the different formatting options. In this case, we are going to select Percentage and set it to one decimal place. See how the view changes.
- In addition to hierarchies, we can also make our data model easier to navigate by creating folders to group fields together. In the case of the relatively small number of fields in our sample data, this would likely not be necessary, but a lot of enterprise data models have many more fields. Let’s create a logical grouping in a folder by right-clicking on the Shipment Mode field in the data pane. In the menu, select Group by | Folder, as seen in Figure 10.32. The default in Tableau is to group by table names. For many use cases where the primary analysts and consumers do not understand database structures, it is often more convenient and logical to change this to folders and group fields accordingly:

Figure 10.32 – Changing to group by folders
- Now that we are set up to group by folder, right-click on Ship Mode again. Go to the Folders sub-menu and Create Folder… called Shipping Information, as seen in Figure 10.33 and Figure 10.34:

Figure 10.33 – Creating a new folder

Figure 10.34 – Naming the folder
- Right-click on Ship Date and select Folders | Add to Folder | Shipping Information, as seen in Figure 10.35:

Figure 10.35 – Add to Folder
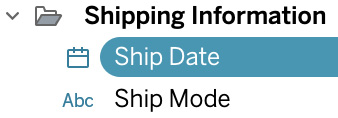
Figure 10.36 – The Shipping Information folder
- The last thing we will do before publishing our data model is look at the Hide Fields function. Hiding fields serves two purposes. First, it makes it easier for the analyst to find relevant fields and not waste time looking through fields that are in the data source but not relevant for analysis. Second, in the case of Tableau extracts, it tells Tableau to not bring those columns into the extract. This saves a lot of physical space, the time queries take to run, and processing time on the server. In our data source, we might want to remove the Customer Name field for confidentiality reasons. To hide the Customer Name field, right-click on it in the data pane and click Hide, as seen in Figure 10.37:

Figure 10.37 – Hiding fields from the data pane
In this section, we looked at enhancing our data model by creating hierarchies and folders, adding descriptions, creating calculations, and changing number formatting.
A final note on how published data sources behave after they are published is important to explore. If we are the owner of the published data source we want to make a change to, we can download the data source into Tableau Desktop, make our change, and republish it. All connected workbooks will see our change. We can also edit the published data source directly in the web client. It is important to note that only the data source owner can change it.
If other developers want to make additions to our published data source in their workbook by performing tasks such as creating calculations, they can do so, but these additions will only appear in their workbook. The changes will not be available to others using the published data source. Only the owner can make those changes.
Summary
In this chapter, we took the time to understand live connections and extracts and when to use each. We looked at data source filters and extract filters and how each is used in the Tableau order or operations.
Then, we looked at both embedded data sources and published data sources. We created and published both types to our Tableau Server or Cloud and explored the use cases for each approach. We also created a published data source from the web interface of Tableau Server or Cloud.
In the last section of this chapter, we looked at extending the Tableau data model with calculations, folders, hierarchies, grouping, and descriptions. We also looked at how to update published data sources once they are already being used in others’ workbooks and what an analyst can and can’t do to extend the data model in their workbooks that use published data sources.
In the next chapter, we are going to look at the options available to us to secure our data models in terms of access to the model and the data we can see within the model.