
Graphical and Computer Analysis
Abstract
This chapter covers graphical analysis and computer analysis. Both types of analysis generate a bar chart (or Gantt chart) as the programme is being analysed. The graphical method is described in detail, but the computer method is only discussed in historical and general terms, as a full description of it is given in Chapter 51
Keywords
Graphical analysis; computer analysis; bar chart generation
Chapter Outline
Graphical Analysis
It is often desirable to present the programme of a project in the form of a bar chart, and when the critical path and floats have been found by either the arithmetical or computer methods, the bar chart has to be drawn as an additional task. (Most computer programs can actually print a bar chart, but these often run to several sheets.)
As explained in Chapter 30, bar charts, while they are not as effective as networks for the actual planning function, are still one of the best methods for allocating and smoothing resources. If resource listing and subsequent smoothing is an essential requirement, graphical analysis can give the best of both worlds. Naturally, any network, however analysed, can be converted very easily into a bar chart, but if the network is analysed graphically the bar chart can be ‘had for free’, as it were.
Modern computer programs will of course produce bar charts (or Gantt charts) from the inputs almost automatically. Indeed the input screen itself often generates the bar chart as the data are entered. However, when a computer is not available or the planner is not conversant with the particular computer program, the graphical method becomes a useful alternative.
The following list gives some of the advantages over other methods, but before the system is used on large jobs planners are strongly advised to test it for themselves on smaller contracts so that they can appreciate the shortcut methods and thus save even more planning time.
1. The analysis is extremely rapid, much quicker than the arithmetical method. This is especially the case when, after some practice, the critical path can be found by inspection.
2. As the network is analysed, the bar chart is generated automatically and no further labour need be expended to do this at a later stage.
3. The critical path is produced before the floats are known. (This is in contrast to the other methods, where the floats have to be calculated first before the critical path can be seen.) The advantage of this is that users can see at once whether the project time is within the specified limits, permitting them to make adjustments to the critical activities without bothering about the non-critical ones.
4. Since the results are shown in bar chart form, they are more readily understood by persons familiar with this form of programme. The bar chart will show more vividly than a printout the periods of heavy resource loading, and highlights periods of comparative inactivity. Smoothing is therefore much more easily accomplished.
5. By marking the various trades or operational types in different colours, a rapid approximate resource requirement schedule can be built up. The resources in any one time period can be ascertained by simply adding up vertically, and any smoothing can be done by utilizing the float periods shown on the chart.
6. The method can be employed for single or multi-start projects. For multi-project work, the two or more bar charts can (provided they are drawn to the same time and calendar scale) be superimposed on transparent paper and the amount of resource overlap can be seen very quickly.
Limitations
The limitations of the graphical method are basically the size of the bar chart paper and therefore the number of activities. Most programmes are drawn on either A1 or A0 size paper and the number of different activities must be compressed into the 840 mm width of this sheet. (It may, of course, be possible to divide the network into two, but then the interlinking activities must be carefully transferred.) Normally, the divisions between bars is about 6 mm, which means that a maximum of 120 activities can be analysed. However, bearing in mind that in a normal network 30% of the activities are dummies, a network of 180 to 200 activities could be analysed graphically on one sheet.
Briefly, the mode of operation is as follows:
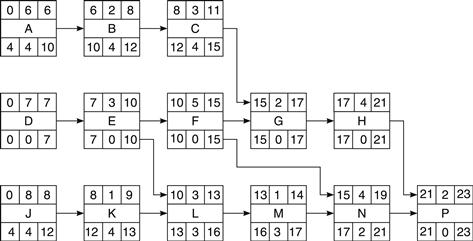
1. Draw the network in arrow diagram or precedence format and write in the activity titles (Figure 24.1 or 24.2). Although a forward pass has been carried out on both these diagrams, this is not necessary when using the graphical method of analysis.

3. List the activities on the left-hand vertical edge of a sheet of graph paper (Figure 21.11) showing:
(b) Duration (in days, weeks, etc.)
(c) Node no. (only required when using these for bar chart generation)
4. Draw a time scale along the bottom horizontal edge of the graph paper.
5. Draw a horizontal line from day 0 of the first activity, which is proportional to the duration (using the time scale selected), e.g., 6 days would mean a line six divisions long (Figure 24.3). To ease identification an activity letter or no. can be written above the bar.
6. Repeat this operation with the next activity on the table starting on day 0.
7. When using arrow (AoA) networks, mark dummy activities by writing the end time of the dummy next to the start time of the dummy, e.g., 4 → 7 would be shown as 4,7 (Figure 21.13).
8. All subsequent activities must be drawn with their start time (start day no.) directly below the end time (end day no.) of the previous activity having the same time value (day no.).
9. If more than one activity has the same end time (day no.), draw the new activity line from the activity end time (day no.) furthest to the right.
10. Proceed in this manner until the end of the network.
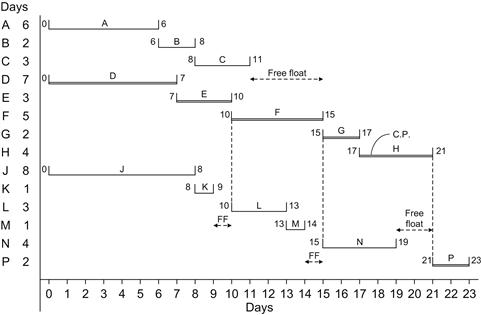
11. The critical path can now be traced back by following the line (or lines), which runs back to the start without a horizontal break.
12. The break between consecutive activities on the bar chart is the free float of the preceding activity.
13. The summation of the free floats in one string, before that string meets the critical path, is the total float of the activity from which the summation starts, e.g., in Figure 21.11 the total float of activity K is 1 + 1 + 2 = 4 days, the total float of activity M is 1 + 2 + 3 days, and the total float of activity N is 2 days.
The advantage of using the start and end times (day nos.) of the activities to generate the bar chart is that there is no need to carry out a forward pass. The correct relationship is given automatically by the disposition of the bars. This method is therefore equally suitable for arrow and precedence diagrams.
An alternative method can however be used by substituting the day numbers by the node numbers. Clearly this method, which is sometimes quicker to draw, can only be used with arrow diagrams, because precedence diagrams do not have node numbers. When using this method, the node numbers are listed next to the activity titles (Figure 24.5) and the bars are drawn from the starting node of the first activity with a length equal to the duration. The next bar starts vertically below the end node with the same node number as the starting node of the activity being drawn.
As with the day No. method, if more than one activity has the same end node number, the one furthest to the right must be used as a starting time. Figure 24.4 shows the same network with the node numbers inserted, and Figure 24.5 shows the bar chart generated using the node numbers.
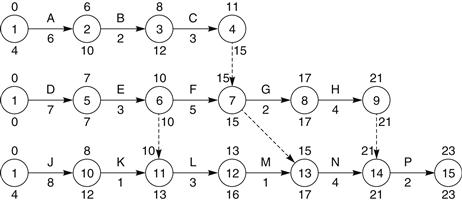
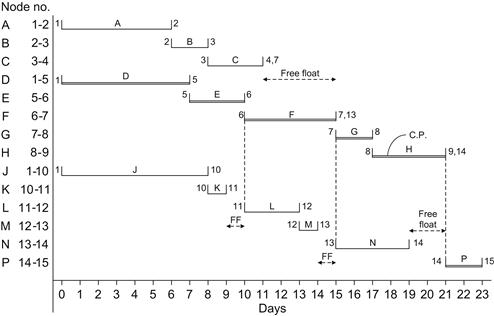
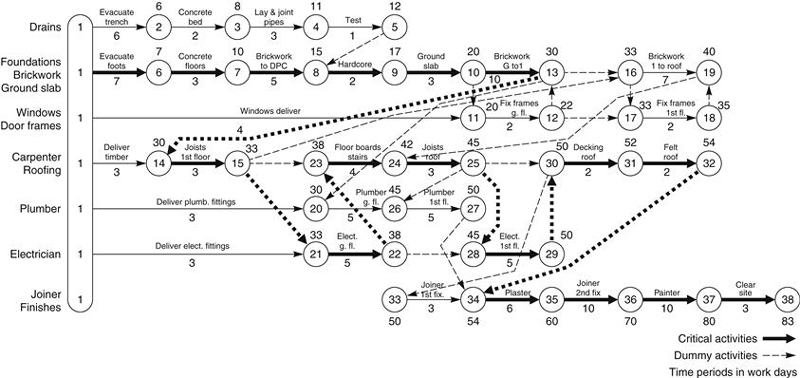
Figure 24.6 shows a typical arrow diagram, and Figure 24.7 shows a bar chart generated using the starting and finishing node numbers. Note that these node numbers have been listed on the left-hand edge together with the durations to ease plotting.

Time for Analysis
Probably the most time-consuming operation in bar chart preparation is the listing of the activity titles, and for this there is no shortcut. The same time, in fact, must be expended typing the titles straight into the computer. However, in order to arrive at a quick answer it is only necessary at the initial stage to insert the node numbers, and once this listing has been done (together with the activity times) the analysis is very rapid. It is possible to determine the critical path for a 200-activity network (after the listing has been carried out) in less than an hour. The backward pass for ascertaining floats takes about the same time.
Computer Analysis
Most manufacturers of computer hardware, and many suppliers of computer software, have written programs for analysing critical path networks using computers. While the various commercially available programs differ in detail, they all follow a basic pattern, and give, by and large, a similar range of outputs. In certain circumstances a contractor may be obliged by his contractual commitments to provide a computerized output report for his client. Indeed, when a client organization has standardized on a particular project management system for controlling the overall project, the contractor may well be required to use the same proprietary system so that the contractor’s reports can be integrated into the overall project control system on a regular basis.
History
The development of network analysis techniques more or less coincided with that of the digital computer. The early network analysis programs were, therefore, limited by the storage and processing capacity of the computer as well as the input and output facilities.
The techniques employed mainly involved producing punched cards (one card for each activity) and feeding them into the machine via a card reader. These procedures were time consuming and tedious, and, because the punching of the cards was carried out by an operator who usually understood little of the program or its purpose, mistakes occurred, which only became apparent after the printout was produced.
Even then, the error was not immediately apparent – only the effect. It then often took hours to scan through the reams of printout sheets before the actual mistake could be located and rectified. To add to the frustration of the planner, the new printout may still have given ridiculous answers because a second error was made on another card. In this way it often required several runs before a satisfactory output could be issued.
In an endeavour to eliminate punching errors, attempts were made to use two separate operators, who punched their own set of input cards. The cards were then automatically compared and, if not identical, were thrown out, indicating an error. Needless to say, such a practice cost twice as much in manpower.
Because these early computers were large and very expensive, usually requiring their own air-conditioning equipment and a team of operators and maintenance staff, few commercial companies could afford them. Computer bureaux were therefore set up by the computer manufacturers or special processing companies, to whom the input sheets were delivered for punching, processing, and printing.
The cost of processing was usually a lump sum fee plus x pence per activity. Since the computer could not differentiate between a real activity and a dummy one, planners tended to go to considerable pains to reduce the number of dummies to save cost. The result was often a logic sequence, which may have been cheap in computing cost but was very expensive in application, since frequently important restraints were overlooked or eliminated. In other words, the tail wagged the dog – a painful phenomenon in every sense. It was not surprising, therefore, that many organizations abandoned computerized network analysis or, even worse, discarded the use of network analysis altogether as being unworkable or unreliable.
There is no doubt that manual network analysis is a perfectly feasible alternative to using computers. Indeed, one of the largest petrochemical complexes in Europe was planned entirely using a series of networks, all of which were analysed manually.
The PC
The advent of the personal computer (PC) significantly changed the whole field of computer processing. In place of the punched card or tape we now have the computer keyboard and video screen, which enable the planner to input the data directly into the computer without filling in input sheets and relying on a punch operator. The information is taken straight from the network and displayed on the video screen as it is ‘typed’ in. In this way, the data can be checked or modified almost instantaneously.
Provided sufficient information has been entered, trial runs and checks can be carried out at any stage to test the effects and changes envisaged. Modern planning programs (or project management systems, as they are often called) enable the data to be inputted in a random manner to suit the operator, provided, of course, that the relationship between the node numbers (or activity numbers) and duration remains the same.
There are some programs that enable the network to be produced graphically on the screen as the information – especially the logic sequence – is entered. This, it is claimed, eliminates the need to draw the network manually. Whether this practice is as beneficial as suggested is very doubtful.
For a start, the number of activities that can be viewed simultaneously on a standard video screen is very limited, and the scroll facility that enables larger networks to be accommodated does not enable an overall view to be obtained at a glance. The greatest drawback of this practice, however, is the removal from the network planning process of the team spirit, which is engendered when a number of specialists sit down with the planner around a conference table to ‘hammer out’ the basic shape of the network. Most problems have more than one solution, and the discussions and suggestions, both in terms of network logic and durations, are invaluable when drafting the first programs. These meetings are, in effect, a brainstorming session at which the ideas of the various participants are discussed, tested, and committed to paper. Once this draft network has been produced, the planner can very quickly input it into the computer and call up a few test runs to see whether the overall completion date can, in fact, be achieved. If the result is unsatisfactory, logic and/or duration changes can be discussed with the project team before the new data are processed again by the machine. The speed of the new hardware makes it possible for the computer to be part of the planning conference, so that (provided the planner/operator is quick enough) the ‘what if’ scenarios can be tested while the meeting is in progress. A number of interim test runs can be carried out to establish the optimum network configuration before proceeding to the next stage. Even more important, errors and omissions can be corrected and durations of any or all activities can be altered to achieve a desired interim or final completion date.
The relatively low cost of the modern PCs has enabled organizations to install planning offices at the head office and sites as well as at satellite offices, associate companies, and offices of vital suppliers, contractors, and sub contractors. All these PCs can be linked to give simultaneous printouts as well as supply up-to-date information to the head office where the master network is being produced. In other words, the information technology (IT) revolution has made an important impact on the whole planning procedure, irrespective of the type or size of organization.
The advantages of PCs are:
1. The great reduction in the cost of the hardware, making it possible for small companies, or even individuals, to purchase their own computer system.
2. The proliferation of inexpensive, proven software of differing sophistication and complexity, enabling relatively untrained planners to operate the system.
3. The ability to allow the planner to input his or her own program or information via a keyboard and VDU.
4. The possibility to interrogate and verify the information at any stage on the video screen.
5. The speed with which information is processed and printed out either in numerical (tabular) or graphical form.
Programs
During the last few years a large number of proprietary programs have been produced and marketed. All these programs have the ability to analyse networks and produce the standard output of early and late starts and the three main types of float, i.e., total, free, and independent. Most programs can deal with either arrow diagrams or precedence diagrams, although the actual analysis is only carried out via one type of format.
The main differences between the various programs available at the time of writing are the additional facilities available and the degree of sophistication of the output. Many of the programs can be linked with ‘add-on’ programs to give a complete project management system covering not only planning but also cost control, material control, site organization, procurement, stock control, EVA, etc. It is impossible to describe the many intricacies of all the available systems within the confines of this chapter, nor is it the intention to compare one system with another. Such comparison can be made in terms of cost, user-friendliness, computing power, output sophistication, functionality, or range of add-ons. Should such surveys be required, it is best to consult the Internet or some of the specialist computer magazines or periodicals, which carry out such comparisons from time to time.
Most of the programs more commonly available can be found on the Internet, but to give a better insight into the versatility of a modern program, one of the more sophisticated systems is described in some detail in Chapter 51. The particular system was chosen because of its ability to be linked with the EVA system described in Chapter 32 of this book. The chosen system, Primavera P6, is capable of fully integrating critical path analysis with earned value analysis and presenting the results on one sheet of A4 paper.
At the time of publication, about 140 project management programs were listed and compared for functionality in Wikipedia on the Internet. Many of these will probably not exist anymore by the time this book is being read, while no doubt many more will have been created to take their place. It is futile therefore to even attempt to list them. The cost of these systems can vary between $150 and $6000, and the reader is therefore advised to investigate each ‘offer’ in some depth to ensure value for money. A simple inexpensive system may be adequate for a small organization running small projects or wishing to become familiar with computerized network analysis. Larger companies, whose clients may demand more sophisticated outputs and reports, may require the more expensive systems. Indeed, the choice of a particular system may well be dictated by the lead company of a consortium or the client, as described earlier.
It is recommended that the decision to produce any but the most basic printouts, as well as any printouts of reports or summaries, be delayed until the usefulness and degree of detail of a report has been studied and discussed with department managers. There is always a danger with computer outputs that recipients request more reports than they can digest, merely because they know they are available at the press of a button. Too much information or paper becomes self-defeating, since the very bulk frightens the reader to the extent of it not being read at all.
With the proliferation of the PC and the expansion of IT, especially the Internet, many of the project management techniques can now be carried out online. The use of e-mail and intranets allows information to be distributed to the many stakeholders of a project almost instantaneously. Where time is important – and it nearly always is – such a fast distribution of data or instructions can be of enormous benefit to the project manager. It does, however, require all information to be carefully checked before dissemination, precisely because so many people receive it at the same time. (See Chapter 52 on BIM.) It is an unfortunate fact that computer errors are more serious for just this reason as well as the naive belief that computers are infallible. Unfortunately, as with all computer systems, RIRO (Rubbish In, Rubbish Out) applies.