
Chapter 17
Visual Studio 2012
WHAT’S IN THIS CHAPTER?
- Using Visual Studio 2012
- Architecture tools
- Analyzing applications
- Testing
- Refactoring with Visual Studio
- Visual Studio 2012’s multi-targeting capabilities
- Working with various technologies — WPF, WCF, WF, and more
WROX.COM CODE DOWNLOADS FOR THIS CHAPTER
There are no code downloads for this chapter.
WORKING WITH VISUAL STUDIO 2012
At this point, you should be familiar with the C# language and almost ready to move on to the applied sections of the book, which cover how to use C# to program a variety of applications. Before doing that, however, it’s important to understand how you can use Visual Studio and some of the features provided by the .NET environment to get the best from your programs.
This chapter explains what programming in the .NET environment means in practice. It covers Visual Studio, the main development environment in which you will write, compile, debug, and optimize your C# programs, and provides guidelines for writing good applications. Visual Studio is the main IDE used for numerous purposes, including writing ASP.NET applications, Windows Forms, Windows Presentation Foundation (WPF) applications, Windows Store apps accessing WCF services or the Web API, and more.
This chapter also explores what it takes to build applications that are targeted at the .NET Framework 4.5. Working with Visual Studio 2012 enables you to work with the latest application types, such as WPF, the Windows Communication Foundation (WCF), and the Windows Workflow Foundation (WF), directly.
Visual Studio 2012 is a fully integrated development environment. It is designed to make the process of writing your code, debugging it, and compiling it to an assembly to be shipped as easy as possible. This means that Visual Studio gives you a very sophisticated multiple-document–interface application in which you can do just about everything related to developing your code. It offers the following features:
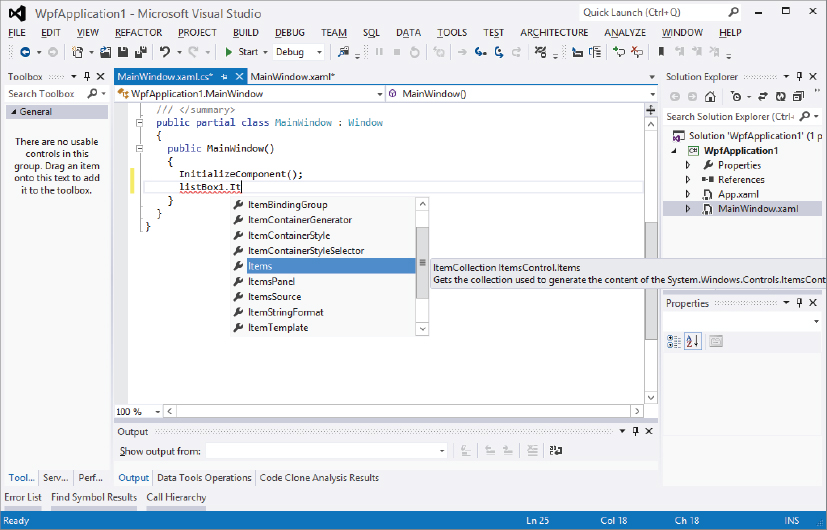
- Text editor — Using this editor, you can write your C# (as well as Visual Basic 2012, C++, F#, JavaScript, XAML, and SQL) code. This text editor is quite sophisticated. For example, as you type, it automatically lays out your code by indenting lines, matching start and end brackets of code blocks, and color-coding keywords. It also performs some syntax checks as you type, and underlines code that causes compilation errors, also known as design-time debugging. In addition, it features IntelliSense, which automatically displays the names of classes, fields, or methods as you begin to type them. As you start typing parameters to methods, it also shows you the parameter lists for the available overloads. Figure 17-1 shows the IntelliSense feature in action with one of the .NET base classes, ListBox.
NOTE By pressing Ctrl+Space, you can bring back the IntelliSense list box if you need it or if for any reason it is not visible.
- Design view editor — This editor enables you to place user-interface and data-access controls in your project; Visual Studio automatically adds the necessary C# code to your source files to instantiate these controls in your project. (This is possible because all .NET controls are instances of particular base classes.)
- Supporting windows — These windows enable you to view and modify aspects of your project, such as the classes in your source code, as well as the available properties (and their startup values) for Windows Forms and Web Forms classes. You can also use these windows to specify compilation options, such as which assemblies your code needs to reference.
- The capability to compile from within the environment — Instead of needing to run the C# compiler from the command line, you can simply select a menu option to compile the project, and Visual Studio will call the compiler for you and pass it all the relevant command-line parameters, detailing such things as which assemblies to reference and what type of assembly you want to be emitted (executable or library .dll, for example). If you want, it can also run the compiled executable for you so that you can see whether it runs satisfactorily. You can even choose between different build configurations (for example, a release or debug build).
- Integrated debugger — It is in the nature of programming that your code will not run correctly the first time you try it. Or the second time. Or the third time. Visual Studio seamlessly links up to a debugger for you, enabling you to set breakpoints and watches on variables from within the environment.
- Integrated MSDN help — Visual Studio enables you to access the MSDN documentation from within the IDE. For example, if you are not sure of the meaning of a keyword while using the text editor, simply select the keyword and press the F1 key, and Visual Studio will access MSDN to show you related topics. Similarly, if you are not sure what a certain compilation error means, you can bring up the documentation for that error by selecting the error message and pressing F1.
- Access to other programs — Visual Studio can also access a number of other utilities that enable you to examine and modify aspects of your computer or network, without your having to leave the developer environment. With the tools available, you can check running services and database connections, look directly into your SQL Server tables, and even browse the Web using an Internet Explorer window.
Visual Studio 2010 redesigned the shell to be based on WPF instead of native Windows controls. Visual Studio 2012 has some user interface (UI) changes based on this. In particular, the UI has been enhanced in the way of the Modern UI style. The heart of the Modern UI style is content, rather than chrome. Of course, with a tool like Visual Studio, it’s not possible to remove all the chrome; but given the importance of working with the code editor, Visual Studio 2012 provides more space for it. Menus and toolbars are reduced in size; and by default, only one toolbar is opened. Eliminating the borders from menus and toolbars has also provided more space for the editor. In addition, whereas with Visual Studio 2010 a lot of other tool windows were usually open, now many features are integrated within the new Solution Explorer.
Along with the Windows 8 modern-style look, the use of color has been modified. If you worked with previous versions of Visual Studio, you may have occasionally found yourself unable to edit the code, only to realize a few moments later that you were running in the debugger. Now, the status of your project can be clearly identified by its color in the status bar.
Better responsiveness was a major goal for Visual Studio 2012. In previous versions, if you opened a solution consisting of many projects, you could probably take your first coffee break before working with the solution. Now, all the projects are loaded asynchronously; the files that are opened for editing are loaded first, with the others opened later in the background. This way, you can already do some work before loading is done. New asynchronous features can be found in many places. For example, while the IntelliSense thread is starting and loading information, you can already start typing the methods you know in the editor. The assemblies from the Add Reference dialog are searched asynchronously as well. Because more operations are taking place in the background, Visual Studio 2012 is a lot more responsive than previous editions.
For XAML code editing, Visual Studio 2010 and Expression Blend 4 had different editor engines. Now, the teams within Microsoft have been merged, and Visual Studio 2012 includes the same editor as Expression Blend. This is great news if you want to work with both tools, as they now work very similarly. Template editing is also strongly integrated into Visual Studio 2012.
Another improvement to Visual Studio 2012 is search. There are many places where search can be used, and in previous versions of Visual Studio it was not unusual to need a feature but not be able to find the menu entry. Now you can use the Quick Launch located at the top-right corner of the window to search for menus, toolbars, and options (see Figure 17-2). Search functionality is also available from the toolbox, Solution Explorer, the code editor (which you can invoke by selecting Ctrl+F), the assemblies on the Reference Manager, and more.

Project File Changes
When you opened a project with Visual Studio 2010 that was created with Visual Studio 2008, the project file was converted and you could no longer open the project with Visual Studio 2008. This behavior is different in Visual Studio 2012. If you open a Visual Studio 2010 project with Visual Studio 2012, you can still open the file with Visual Studio 2010. This enables a team of members working with different versions of Visual Studio to work with the same project. However, as soon as you change a project to use .NET Framework 4.5, the project can no longer be opened with Visual Studio 2010. Visual Studio 2010 supports only .NET programs from version 2.0 to version 4.0.
If you install Visual Studio 2012 on a Windows 8 system, you can create a completely new category of applications: Windows Store apps. You can create these applications with C# and XAML and use the new Windows Runtime in addition to a subset of the .NET Framework. These applications can run on Windows 8 and Windows RT.
Visual Studio Editions
Visual Studio 2012 is available in several editions. The least expensive is Visual Studio 2012 Express Edition, as this edition is free! Available for purchase are the Professional, Premium, and Ultimate editions. Only the Ultimate edition includes all the features. What you will miss with Visual Studio Professional 2012 is code metrics, a lot of testing tools, checking for code clones, as well as architecting and modeling tools. Exclusive to the Ultimate edition is IntelliTrace, load testing, the Microsoft Fakes framework (unit test isolation), and some architecture tools. This chapter’s tour of Visual Studio 2012 includes a few features that are available only with specific editions. For detailed information about the features of each edition of Visual Studio 2012, see http://www.microsoft.com/visualstudio/11/en-us/products/compare.
Visual Studio Settings
When you start Visual Studio the first time, you are asked to select a settings collection that matches your environment, e.g., General Development, Visual Basic, Visual C#, Visual C++, or Web Development. These different settings reflect the different tools historically used for these languages. When writing applications on the Microsoft platform, different tools are used to create Visual Basic, C++, and Web applications. Similarly, Visual Basic, Visual C++, and Visual InterDev have completely different programming environments, with completely different settings and tool options.
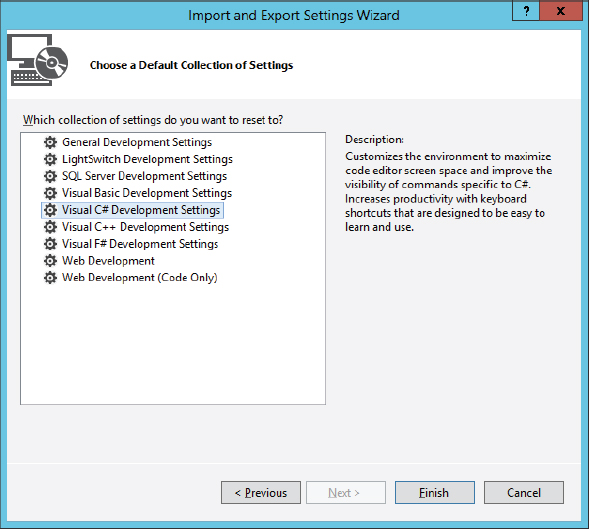
After choosing the main category of settings to define keyboard shortcuts, menus, and the position of tool windows, you can change every setting with Tools ⇒ Customize... (toolbars and commands), and Tools ⇒ Options... (here you find the settings for all the tools). You can also reset the settings collection with Tools ⇒ Import and Export Settings..., which invokes a wizard that enables you to select a new default collection of settings (see Figure 17-3).
The following sections walk through the process of creating, coding, and debugging a project, demonstrating what Visual Studio can do to help you at each stage.
CREATING A PROJECT
After installing Visual Studio 2012, you will want to start your first project. With Visual Studio, you rarely start with a blank file and then add C# code, in the way that you have been doing in the previous chapters in this book. (Of course, the option of asking for an empty application project is there if you really do want to start writing your code from scratch or if you are going to create a solution that will contain a number of projects.)
Instead, the idea is that you tell Visual Studio roughly what type of project you want to create, and it will generate the files and C# code that provide a framework for that type of project. You then proceed to add your code to this outline. For example, if you want to build a Windows client application (a WPF application), Visual Studio will start you off with a XAML file and a file containing C# source code that creates a basic form. This form is capable of communicating with Windows and receiving events. It can be maximized, minimized, or resized; all you need to do is add the controls and functionality you want. If your application is intended to be a command-line utility (a console application), Visual Studio gives you a basic namespace, a class, and a Main method to get you started.
Last, but hardly least, when you create your project, Visual Studio also sets up the compilation options that you are likely to supply to the C# compiler — whether it is to compile to a command-line application, a library, or a WPF application. It also tells the compiler which base class libraries you will need to reference (a WPF GUI application will need to reference many of the WPF-related libraries; a console application probably will not). Of course, you can modify all these settings as you are editing if necessary.
The first time you start Visual Studio, you are presented with an IDE containing menus, a toolbar, and a page with getting started information, how-to videos, and latest news (see Figure 17-4). The Start Page contains various links to useful web sites and enables you to open existing projects or start a new project altogether.
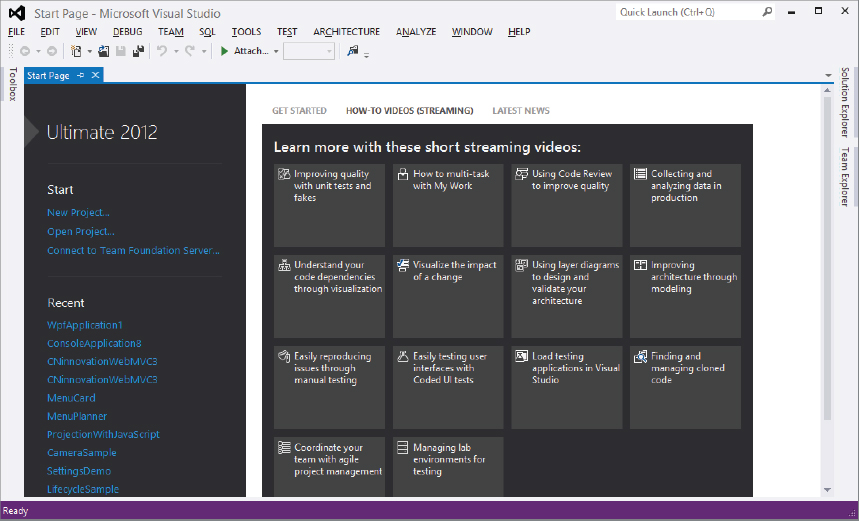
In this case, the Start Page reflects what is shown after you have already used Visual Studio 2012, as it includes a list of the most recently edited projects. You can just click one of these projects to open it again.
Multi-Targeting the .NET Framework
Visual Studio 2012 enables you to target the version of the .NET Framework that you want to work with. When you open the New Project dialog, shown in Figure 17-5, a drop-down list in the top area of the dialog displays the available options.

In this case, you can see that the drop-down list enables you to target the .NET Frameworks 2.0, 3.0, 3.5, 4, and 4.5. You can also install other versions of the .NET Framework by clicking the More Frameworks link. This link opens a web site from which you can download other versions of the .NET Framework, e.g., 4.01, 4.02, and 4.03.
When you use the Upgrade dialog to upgrade a Visual Studio 2010 solution to Visual Studio 2012, it is important to understand that you are only upgrading the solution to use Visual Studio 2012; you are not upgrading your project to the .NET Framework 4.5. Your project will stay on the framework version you were using, but now you will be able to use the new Visual Studio 2012 to work on your project.
If you want to change the version of the framework the solution is using, right-click the project and select the properties of the solution. If you are working with an ASP.NET project, you will see the dialog shown in Figure 17-6.
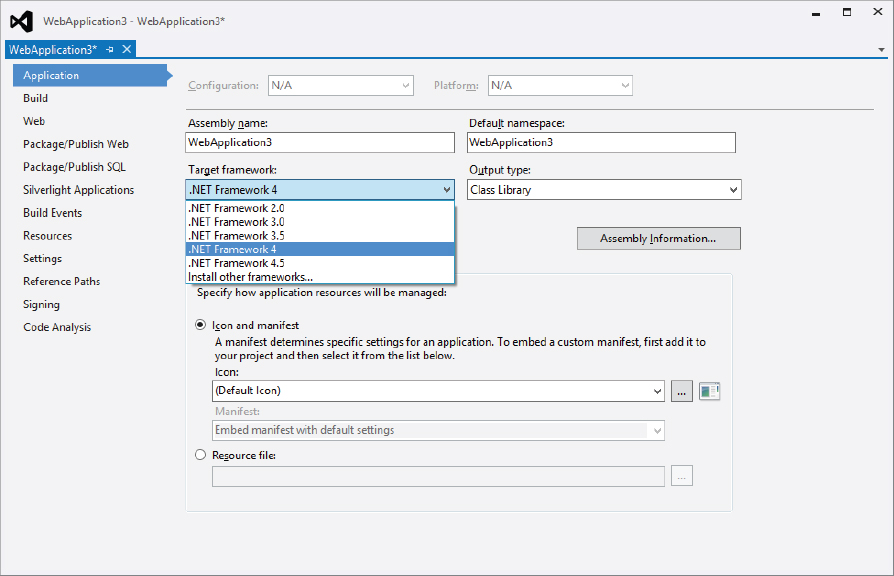
From this dialog, the Application tab enables you to change the version of the framework that the application is using.
Selecting a Project Type
To create a new project, select File ⇒ New Project from the Visual Studio menu. The New Project dialog will appear (see Figure 17-7) — giving you your first inkling of the variety of different projects you can create.
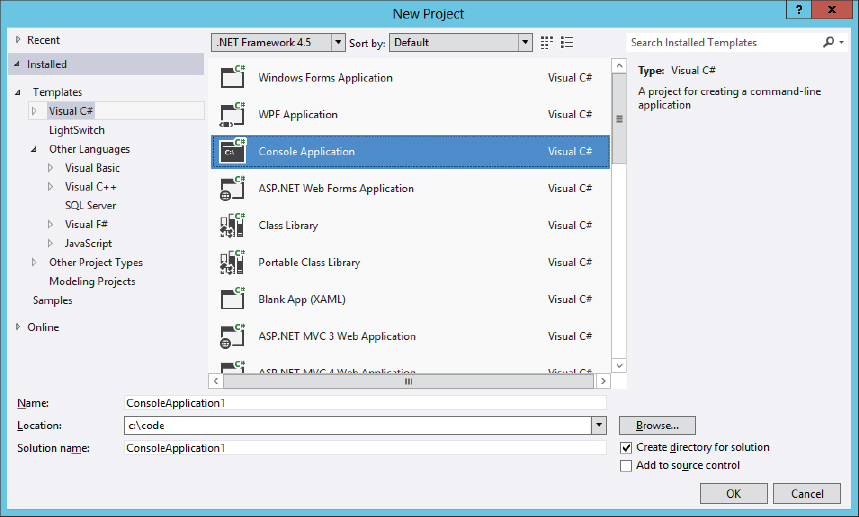
Using this dialog, you effectively select the initial framework files and code you want Visual Studio to generate for you, the type of compilation options you want, and the compiler you want to compile your code with — either Visual C#, LightSwitch, Visual Basic, Visual C++, Visual F#, or JavaScript. You can immediately see the language integration that Microsoft has promised for .NET at work here! This particular example uses a C# console application.
The following tables describe all the options that are available to you under the Visual C# projects. Note that some other, more specialized C# template projects are available under the Other Projects option.
Using Windows Project Templates
The first table lists the projects available with the Windows category:
| IF YOU CHOOSE... | YOU GET THE C# CODE AND COMPILATION OPTIONS TO GENERATE... |
| Windows Forms Application | A basic empty form that responds to events. Windows Forms wraps native Windows controls and uses pixel-based graphics with GDI+. |
| WPF Application | A basic empty form that responds to events. Although the project type is similar to the Windows Forms Application project type (Windows Forms), this Windows Application project type enables you to build an XAML-based smart client solution with vector-based graphics and styles. |
| Console Application | An application that runs at the command-line prompt or in a console window. |
| Class Library | A .NET class library that can be called up by other code. |
| Portable Class Library | A class library that can be used by WPF, Silverlight, Windows Phone, and Windows Store apps. |
| WPF Browser Application | Quite similar to the Windows Application for WPF, this variant enables you to build a XAML-based application that is targeted at the browser. Nowadays, you should think about using a different technology for this, such as a WPF application with ClickOnce, a Silverlight project, or HTML 5. |
| Empty Project | An empty project that just contains an application configuration file and settings for a console application. |
| Windows Service | A Windows Service that can automatically start up with Windows and act on behalf of a privileged local system account. |
| WPF Custom Control Library | A custom control that can be used in a Windows Presentation Foundation application. |
| WPF User Control Library | A user control library built using Windows Presentation Foundation. |
| Windows Forms Control Library | A project for creating controls for use in Windows Forms applications. |
Using Windows Store Project Templates
The next table covers Windows Store apps. These templates are available only if Visual Studio is installed on Windows 8. The templates are used to create applications that run within the new modern UI on Windows 8 and Windows RT.
| IF YOU CHOOSE... | YOU GET THE C# CODE AND COMPILATION OPTIONS TO GENERATE... |
| Blank App (XAML) | A basic empty Windows Store app with XAML, without styles and other base classes. The styles and base classes can be added easily later. |
| Grid App (XAML) | A Windows Store app with three pages for displaying groups and item details. |
| Split App (XAML) | A Windows Store app with two pages for displaying groups and the items of a group. |
| Class Library (Windows Store apps) | A .NET class library that can be called up by other Windows Store apps programmed with .NET. |
| Windows Runtime Component | A Windows Runtime class library that can be called up by other Windows Store apps developed with different programming languages (C#, C++, JavaScript). |
| Unit Test Library (Windows Store apps) | A library that contains unit tests for Windows Store apps. |
Using Web Project Templates
With the Web project templates described in the following table, you can create ASP.NET Web applications using either ASP.NET Web Forms or the newer technology, ASP.NET MVC.
| IF YOU CHOOSE... | YOU GET THE C# CODE AND COMPILATION OPTIONS TO GENERATE... |
| ASP.NET Web Forms Application | An ASP.NET Web Forms web application: ASP.NET pages and C# classes that generate the HTML response sent to browsers from those pages. This option includes a base demo application. |
| ASP.NET MVC 4 (3) Web Application | A project type that enables you to create an ASP.NET MVC application. This template has options for an empty, Internet or Intranet, or Web API project. |
| ASP.NET Empty Web Application | An ASP.NET-based web application with only a configuration file. This template allows adding Web Forms and Web API items later. |
| ASP.NET Dynamic Data Entities Web Application | A project type that enables you to build an ASP.NET application that takes advantage of ASP.NET Dynamic Data using LINQ to Entities. |
| ASP.NET AJAX Server Control | A custom server control for use within ASP.NET applications. |
| ASP.NET AJAX Control Extender | A project type that enables you to create extenders for ASP.NET server controls. |
| ASP.NET Server Control | A control that can be called by ASP.NET Web Forms pages to generate the HTML code that provides the appearance when displayed in the browser. |
Using WCF Project Templates
To create a Windows Communication Foundation (WCF) application that enables communication between the client and server, you can select from the following WCF project templates.
| IF YOU CHOOSE... | YOU GET THE C# CODE AND COMPILATION OPTIONS TO GENERATE... |
| WCF Service Library | A library that contains a sample service contract and implementation, as well as the configuration. The project is configured to start a WCF service host that hosts the service and a test client application. |
| WCF Service Application | A Web project that contains a WCF contract and service implementation. |
| WCF Workflow Service Application | A Web project that hosts a WCF service with the Workflow runtime. |
| Syndication Service Library | A WCF service library with a WCF contract and implementation that hosts RSS or ATOM feeds. |
Workflow Project Templates
This table describes the project templates available for creating Windows Workflow Foundation (WF) projects.
| IF YOU CHOOSE... | YOU GET THE C# CODE AND COMPILATION OPTIONS TO GENERATE... |
| Workflow Console Application | A Windows Workflow Foundation executable that hosts a workflow. |
| WCF Workflow Service Application | A Web project that hosts a WCF service with the Workflow runtime. |
| Activity Library | A workflow activity library that can be used with workflows. |
| Activity Designer Library | A library that is used to create XAML user interfaces for activities to show and configure activities in the workflow designer. |
This is not a full list of the Visual Studio 2012 project templates, but it reflects some of the most commonly used templates. The main additions to this version of Visual Studio are the Windows Store project templates. These new capabilities are covered in other chapters later in this book. Be sure to look at Chapter 31, “Windows Runtime”, and Chapter 38, “Windows Store Apps” in particular. You can also find new project templates online using the search capability available through the New Project dialog.
EXPLORING AND CODING A PROJECT
This section looks at the features that Visual Studio provides to help you add and explore code with your project. You will learn about using the Solution Explorer to explore files and code, use features from the editor such as IntelliSense and code snippets, and explore other windows such as the Properties window and the Document Outline.
Solution Explorer
After creating a project, the most important tool you will use besides the code editor is the Solution Explorer. With this tool you can navigate through all files and items of your project, and see all the classes and members of classes. The Solution Explorer has been greatly enhanced in Visual Studio 2012.
Working with Projects and Solutions
The Solution Explorer displays your projects and solutions. It’s important to understand the distinction between these:
- A project is a set of all the source-code files and resources that will compile into a single assembly (or in some cases, a single module). For example, a project might be a class library or a Windows GUI application.
- A solution is the set of all the projects that make up a particular software package (application).
To understand this distinction, consider what happens when you ship a project, which consists of more than one assembly. For example, you might have a user interface, custom controls, and other components that ship as libraries of parts of the application. You might even have a different user interface for administrators, and a service that is called across the network. Each of these parts of the application might be contained in a separate assembly, and hence they are regarded by Visual Studio as separate projects. However, it is quite likely that you will be coding these projects in parallel and in conjunction with one another. Thus, it is quite useful to be able to edit them all as one single unit in Visual Studio. Visual Studio enables this by regarding all the projects as forming one solution, and treating the solution as the unit that it reads in and allows you to work on.
Up until now, this chapter has been loosely talking about creating a console project. In fact, in the example you are working on, Visual Studio has actually created a solution for you — although this particular solution contains just one project. You can see this scenario reflected in the Solution Explorer (see Figure 17-8), which contains a tree structure that defines your solution.

In this case, the project contains your source file, Program.cs, as well as another C# source file, AssemblyInfo.cs (found in the Properties folder), which enables you to provide information that describes the assembly and specify versioning information. (You look at this file in detail in Chapter 19, “Assemblies.”) The Solution Explorer also indicates the assemblies that your project references. You can see this by expanding the References folder in the Solution Explorer.
If you have not changed any of the default settings in Visual Studio, you will probably find the Solution Explorer in the top-right corner of your screen. If you cannot see it, just go to the View menu and select Solution Explorer.
The solution is described by a file with the extension .sln — in this example, it is ConsoleApplication1.sln. The solution file is a text file that contains information about all the projects contained within the solution, as well as global items that can be used with all contained projects.
The C# project is described by a file with the extension .csproj — in this example, it is ConsoleApplication1.csproj. This is an XML file that you can open directly from within Solution Explorer. However, to do this, you need to unload the project first, which you can do by clicking on the project name and selecting Unload Project in the context menu. After the project is unloaded, the context menu contains the entry Edit ConsoleApplication1.csproj, from which you can directly access the XML code.
Adding Projects to a Solution
As you work through the following sections, you will see how Visual Studio works with Windows desktop applications and console applications. To that end, you create a Windows project called BasicForm that you will add to your current solution, ConsoleApplication1.
You can create the new project in several ways. One way is to select New ⇒ Project from the File menu (as you have done already) or you can select Add ⇒ New Project from the File menu. Selecting Add ⇒ New Project from the File menu brings up the familiar Add New Project dialog; as shown in Figure 17-9, however, Visual Studio wants to create the new project in the preexisting ConsoleApplication1 project location.

If you select this option, a new project is added, so the ConsoleApplication1 solution now contains a console application and a WPF application.
Of course, this means that ConsoleApplication1 is not really an appropriate name for the solution anymore. To change the name, you can right-click the name of the solution and select Rename from the context menu. Call the new solution DemoSolution. The Solution Explorer window should now look like Figure 17-10.
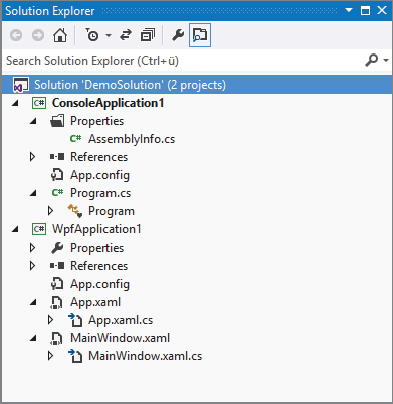
As you can see, Visual Studio has made your newly added WPF project automatically reference some of the extra base classes that are important for WPF functionality.
Note that if you look in Windows Explorer, the name of the solution file has changed to DemoSolution.sln. In general, if you want to rename any files, the Solution Explorer window is the best place to do so, because Visual Studio will then automatically update any references to that file in the other project files. If you rename files using only Windows Explorer, you might break the solution because Visual Studio will not be able to locate all the files it needs to read into the IDE. As a result, you will need to manually edit the project and solution files to update the file references.
Setting the Startup Project
Bear in mind that if you have multiple projects in a solution, you need to configure which one should run as the startup project. You can also configure multiple projects to start simultaneously. There are a lot of ways to do this. After selecting a project in the Solution Explorer, the context menu offers a Set as Startup Project option, which enables one startup project at a time. You can also use the context menu Debug ⇒ Start new instance to start one project after the other. To simultaneously start more than one project, click the solution in the Solution Explorer and select the context menu Set Startup Projects. This opens the dialog shown in Figure 17-11. After you check Multiple startup projects, you can define what projects should be started.

Discovering Types and Members
A WPF application contains a lot more initial code than a console application when Visual Studio first creates it. That is because creating a window is an intrinsically more complex process. Chapter 35, “Core WPF,” discusses the code for a WPF application in detail. For now, have a look at the XAML code in MainWindow.xaml, and in the C# source code MainWindow.xaml.cs. There’s also some hidden generated C# code. Iterating through the tree in the Solution Explorer, below MainWindow.xaml.cs you can find the class MainWindow. With all the code files, the Solution Explorer shows the types within that file. Within the type MainWindow you can see the members of the class. _contentLoaded is a field of type bool. Clicking on this field opens the file MainWindow.g.i.cs. This file — a part of the MainWindow class — is generated by the designer and contains initialization code.
Being able to view the classes, methods, properties, events, and fields within the Solution Explorer is new with Visual Studio 2012 and reduces the need to use the Class View tool.
Using Scopes
Setting scopes allows you to focus on a specific part of the solution. The list of items shown by the Solution Explorer can grow really huge. For example, opening the context menu of a type enables you to select the base type from the menu Base Types. Here you can see the complete inheritance hierarchy of the type, as shown in Figure 17-12.
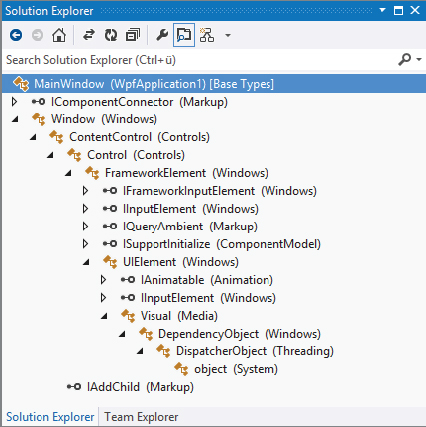
Because Solution Explorer contains more information than you can easily view with one screen, you can open multiple Solution Explorer windows at once with the menu option New Solution Explorer View, and you can set the scope to a specific element, e.g., to a project or a class, by selecting Scope to This from the context menu. To return to the previous scope, click the Back button.
Adding Items to a Project
Directly from within Solution Explorer you can add different items to the project. Selecting the project and opening the context menu Add ⇒ New Item opens the dialog shown in Figure 17-13. Another way to get to the same dialog is by using the main menu Project ⇒ Add New Item. Here you find many different categories, such as code items to add classes or interfaces, data items for using the Entity Framework or other data access technologies, and a lot more.

Managing References
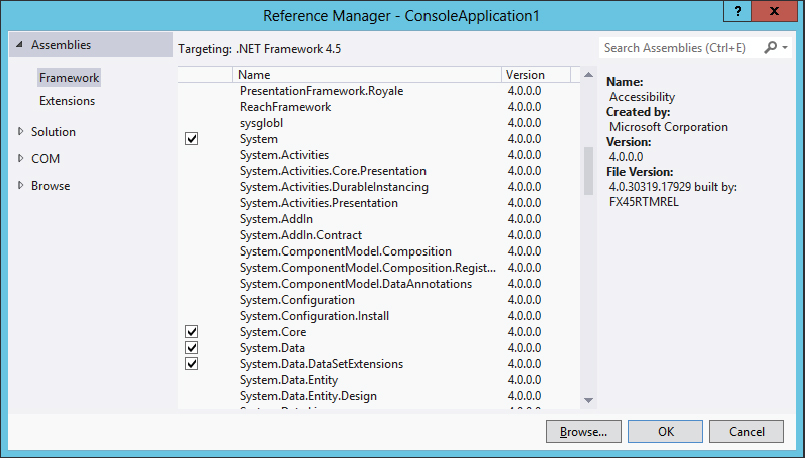
The Reference Manager, shown in Figure 17-14, has been greatly enhanced with Visual Studio 2012. Selecting References in Solution Explorer and clicking the context menu Add Reference opens this dialog. Here you can add references to other assemblies in the same solution, assemblies from the .NET Framework, COM type libraries, and browse for assemblies on the disk.
Using NuGet Packages to Install and Update Microsoft and Third-party Tools
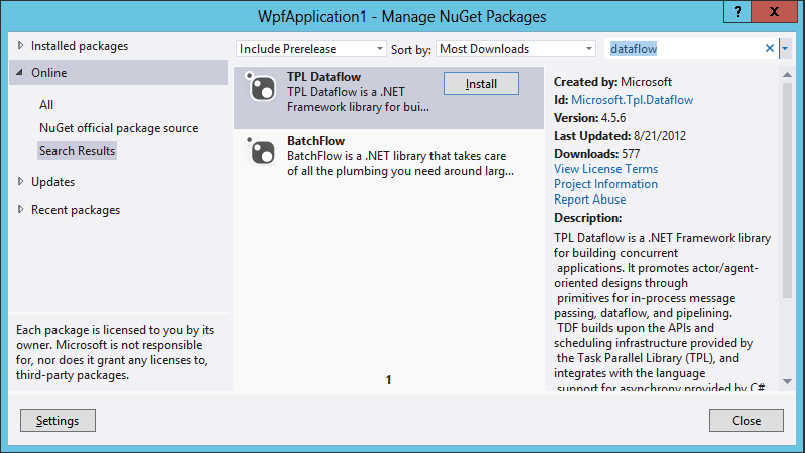
The NuGet Package Manager, shown in Figure 17-15, is an important tool for installing and updating Microsoft and third-party libraries and tools. Some parts of the .NET Framework need a separate installation, e.g., version 5.0 of the Entity Framework, or TPL DataFlow; and some JavaScript libraries such as jQuery and Modernizr. If your project contains packages installed by the NuGet Package Manager, you will be automatically informed when a new version of a package is available.
Working with the Code Editor
The Visual Studio code editor is where most of your development work takes place. This editor increased in size in Visual Studio 2012 after the removal of some toolbars from the default configuration, and the removal of borders from the menus, toolbars, and tab headers. The following sections take a look at some of the most useful features of this editor.
The Folding Editor
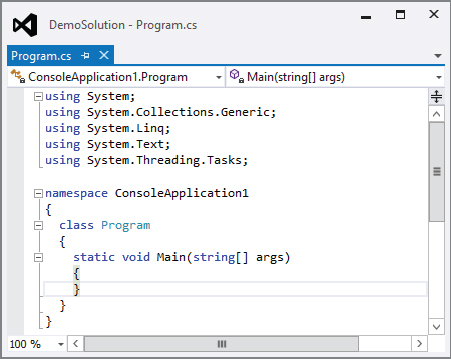
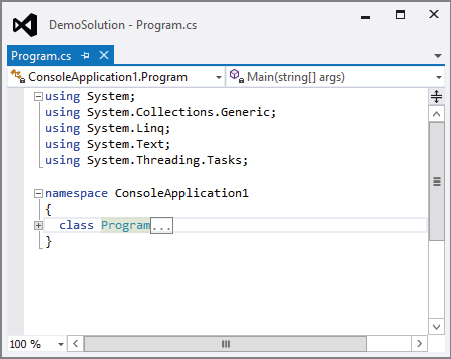
One notable feature of Visual Studio is its use of a folding editor as its default code editor. Figure 17-16 shows the code for the console application that you generated earlier. Notice the little minus signs on the left-hand side of the window. These signs mark the points where the editor assumes that a new block of code (or documentation comment) begins. You can click these icons to close up the view of the corresponding block of code just as you would close a node in a tree control (see Figure 17-17).
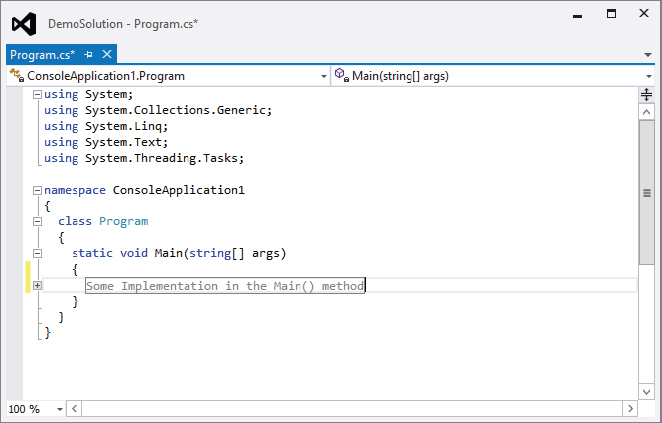
This means that while you are editing you can focus on just the areas of code you want to look at, hiding the bits of code you are not interested in working with at that moment. If you do not like the way the editor has chosen to block off your code, you can indicate your own blocks of collapsible code with the C# preprocessor directives, #region and #endregion. For example, to collapse the code inside the Main method, you would add the code shown in Figure 17-18.

The code editor automatically detects the #region block and places a new minus sign by the #region directive, enabling you to close the region. Enclosing this code in a region enables the editor to close it (see Figure 17-19), marking the area with the comment you specified in the #region directive. The compiler, however, ignores the directives and compiles the Main method as normal.
IntelliSense
In addition to the folding editor feature, Visual Studio’s code editor also incorporates Microsoft’s popular IntelliSense capability, which not only saves you typing but also ensures that you use the correct parameters. IntelliSense remembers your preferred choices and starts with these initially instead of at the beginning of the sometimes rather lengthy lists that IntelliSense can now provide.
The code editor also performs some syntax checking on your code, underlining these errors with a short wavy line, even before you compile the code. Hovering the mouse pointer over the underlined text brings up a small box that contains a description of the error.
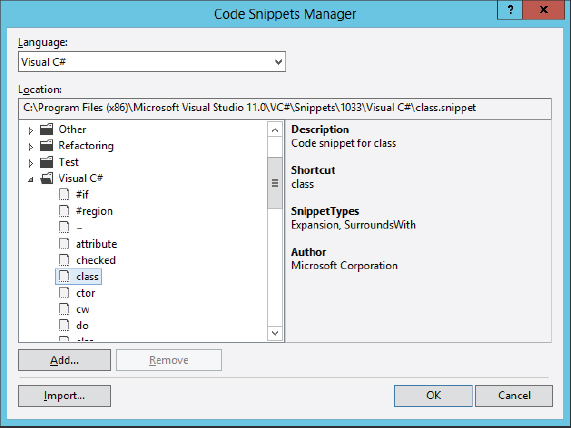
Using Code Snippets
Great productivity features from the code editor are code snippets. Just by writing cw<tab><tab> in the editor, the editor creates a Console.WriteLine();. Visual Studio comes with many code snippets, e.g., with the shortcuts do, for, forr, foreach, while for creating loops, equals for an implementation of the Equals method, attribute and exception for creating Attribute- and Exception- derived types, and many more. You can see all the code snippets available with the Code Snippets Manager (see Figure 17-20) by selecting Tools ⇒ Code Snippets Manager. You can also create custom snippets.
Learning and Understanding Other Windows
In addition to the code editor and Solution Explorer, Visual Studio provides a number of other windows that enable you to view and or manage your projects from different points of view.
Using the Design View Window
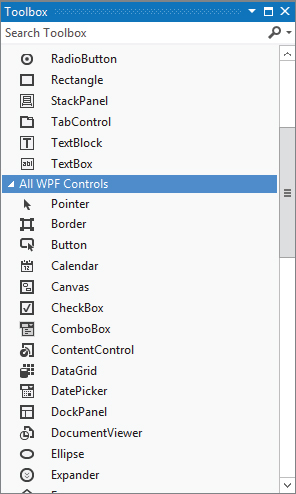
If you are designing a user interface application, such as a WPF application, Windows control library, or ASP.NET Web Forms application, you can use the Design View window. This window presents a visual overview of what your form will look like. You normally use the Design View window in conjunction with a window known as the toolbox. The toolbox contains a large number of .NET components that you can drag onto your program. Toolbox components vary according to project type. Figure 17-21 shows the items displayed within a WPF application.
To add your own custom categories to the toolbox, execute the following steps:
You can also place other tools in the toolbox by selecting Choose Items from the same context menu — this is particularly useful for adding your own custom components or components from the .NET Framework that are not present in the toolbox by default.
Using the Properties Window
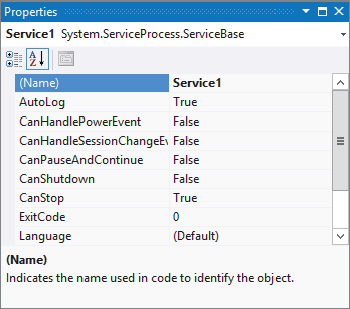
You know from the first part of the book that .NET classes can implement properties. The Properties window is available with projects, files, and when selecting items using the Design view. Figure 17-22 shows the Properties view with a Windows Service.
With this window you can see all the properties of an item and configure it accordingly. Some properties can be changed by entering text in a text box, others have predefined selections, and others have a custom editor (such as the More Colors dialog for ASP.NET Web Forms, shown in Figure 17-23). You can also add event handlers to events with the Properties window.

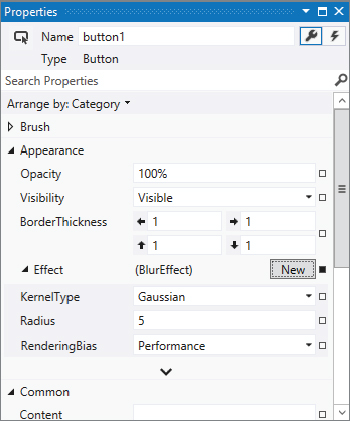
With WPF applications, the Properties window looks very different, as you can see in Figure 17-24. This window provides much more graphical feedback and allows graphical configuration of the properties. If it looks familiar, that might be because it originated in Expression Blend. As mentioned earlier, beginning with Visual Studio 2012, many aspects of Expression Blend and Visual Studio have been integrated.
Using the Class View Window
While the Solution Explorer can show classes and members of classes, that’s the normal job of the Class View (see Figure 17-25). To invoke the class view, select View ⇒ Class View. The Class View shows the hierarchy of the namespaces and classes in your code. It provides a tree view that you can expand to see which namespaces contain what classes, and what classes contain what members.

A nice feature of the Class View is that if you right-click the name of any item for which you have access to the source code, then the context menu displays the Go To Definition option, which takes you to the definition of the item in the code editor. Alternatively, you can do this by double-clicking the item in Class View (or, indeed, by right-clicking the item you want in the source code editor and choosing the same option from the resulting context menu). The context menu also enables you to add a field, method, property, or indexer to a class. In other words, you specify the details for the relevant member in a dialog, and the code is added for you. This feature can be particularly useful for adding properties and indexers, as it can save you quite a bit of typing.
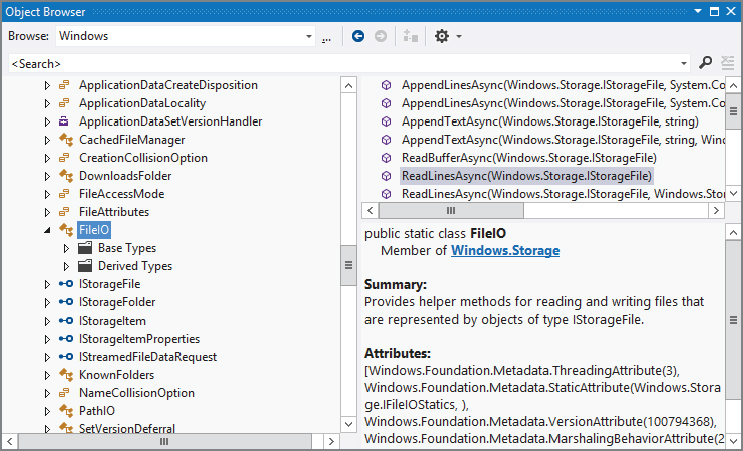
Using the Object Browser Window
An important aspect of programming in the .NET environment is being able to find out what methods and other code items are available in the base classes and any other libraries that you are referencing from your assembly. This feature is available through a window called the Object Browser. You can access this window by selecting Object Browser from the View menu in Visual Studio 2012. With this tool you can browse for and select existing component sets such as .NET 4.5, .NET 4, .NET 3.5, .NET for Windows Store apps, and view the classes and members of the classes that are available with this subset. You can also select the Windows Runtime by selecting Windows in the Browse drop-down (as shown in Figure 17-26) to find all namespaces, types, and methods of this native new API for Windows 8.
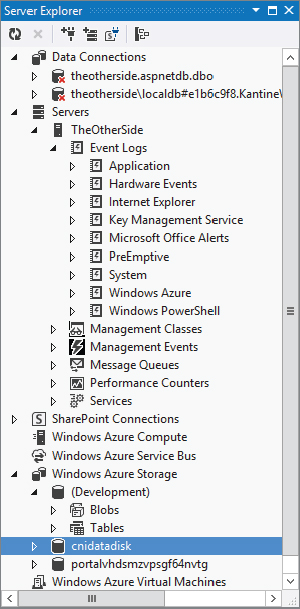
Using the Server Explorer Window
You can use the Server Explorer window, shown in Figure 17-27, to find out about aspects of the computers in your network while coding. With the Servers section, you can find information about services running (which is extremely useful developing Windows Services), create new performance counts, and access the event logs. The Data Connections section enables not only connecting to existing databases and querying data, but also creating a new database. Visual Studio 2012 also has a lot of Windows Azure information built in to Server Explorer, including options for Windows Azure Compute, Storage, Service Bus, and Virtual Machines.
Using the Document Outline
A window available with WPF applications is the Document Outline. Figure 17-28 shows this window opened with an application from Chapter 36, “Business Applications with WPF.” Here, you can view the logical structure and hierarchy of the XAML elements, lock elements to prevent changing them unintentionally, easily move elements within the hierarchy, group elements within a new container element, and change layout types.

Arranging Windows
While exploring Visual Studio, you might have noticed that many of the windows have some interesting functionality more reminiscent of toolbars. In particular, they can all either float (also on a second display), or they can be docked. When they are docked, they display an extra icon that looks like a pin next to the minimize button in the top-right corner of each window. This icon really does act like a pin — it can be used to pin the window open. A pinned window (the pin is displayed vertically), behaves just like the regular windows you are used to. When they are unpinned, however (the pin is displayed horizontally), they remain open only as long as they have the focus. As soon as they lose the focus (because you clicked or moved your mouse somewhere else), they smoothly retreat into the main border around the entire Visual Studio application. Pinning and unpinning windows provides another way to make the best use of the limited space on your screen.
BUILDING A PROJECT
Visual Studio is not only about coding your projects. It is actually an IDE that manages the full life cycle of your project, including the building or compiling of your solutions. This section examines the options that Visual Studio provides for building your project.
Building, Compiling, and Making
Before examining the various build options, it is important to clarify some terminology. You will often see three different terms used in connection with the process of getting from your source code to some sort of executable code: compiling, building, and making. The origin of these three terms reflects the fact that until recently, the process of getting from source code to executable code involved more than one step (this is still the case in C++). This was due in large part to the number of source files in a program.
In C++, for example, each source file needs to be compiled individually. This results in what are known as object files, each containing something like executable code, but where each object file relates to only one source file. To generate an executable, these object files need to be linked together, a process that is officially known as linking. The combined process was usually referred to — at least on the Windows platform — as building your code. However, in C# terms the compiler is more sophisticated, able to read in and treat all your source files as one block. Hence, there is not really a separate linking stage, so in the context of C#, the terms compile and build are used interchangeably.
The term make basically means the same thing as build, although it is not really used in the context of C#. The term make originated on old mainframe systems on which, when a project was composed of many source files, a separate file would be written containing instructions to the compiler on how to build a project — which files to include and what libraries to link to, and so on. This file was generally known as a makefile and it is still quite standard on UNIX systems. The project file is in reality something like the old makefile, it’s just a new advanced XML variant. You can use the MSBuild command with the project file as input, and all the sources will be compiled. Using build files is very helpful on a separate build server on which all developers check their code in, and overnight the build process is done.
Debugging and Release Builds
The idea of having separate builds is very familiar to C++ developers, and to a lesser degree to those with a Visual Basic background. The point here is that when you are debugging, you typically want your executable to behave differently from when you are ready to ship the software. When you are ready to ship your software, you want the executable to be as small and fast as possible. Unfortunately, these two requirements are not compatible with your needs when you are debugging code, as explained in the following sections.
Optimization
High performance is achieved partly by the compiler’s many optimizations of the code. This means that the compiler actively looks at your source code as it is compiling to identify places where it can modify the precise details of what you are doing in a way that does not change the overall effect but makes things more efficient. For example, suppose the compiler encountered the following source code:
double InchesToCm(double ins)
{
  return ins*2.54;
}

// later on in the code
Y = InchesToCm(X);
It might replace it with this:
Y = X * 2.54;Similarly, it might replace
{
  string message = "Hi";
  Console.WriteLine(message);
}
with this:
Console.WriteLine("Hi");By doing so, the compiler bypasses having to declare any unnecessary object reference in the process.
It is not possible to exactly pin down what optimizations the C# compiler does — nor whether the two previous examples would actually occur with any particular situation — because those kinds of details are not documented. (Chances are good that for managed languages such as C#, the previous optimizations would occur at JIT compilation time, not when the C# compiler compiles source code to assembly.) Obviously, for proprietary reasons, companies that write compilers are usually quite reluctant to provide many details about the tricks that their compilers use. Note that optimizations do not affect your source code — they affect only the contents of the executable code. However, the previous examples should give you a good idea of what to expect from optimizations.
The problem is that although optimizations like the examples just shown help a great deal in making your code run faster, they are detrimental for debugging. In the first example, suppose that you want to set a breakpoint inside the InchesToCm method to see what is going on in there. How can you possibly do that if the executable code does not actually have an InchesToCm method because the compiler has removed it? Moreover, how can you set a watch on the Message variable when that does not exist in the compiled code either?
Debugger Symbols
During debugging, you often have to look at the values of variables, and you specify them by their source code names. The trouble is that executable code generally does not contain those names — the compiler replaces the names with memory addresses. .NET has modified this situation somewhat to the extent that certain items in assemblies are stored with their names, but this is true of only a small minority of items — such as public classes and methods — and those names will still be removed when the assembly is JIT-compiled. Asking the debugger to tell you the value in the variable called HeightInInches is not going to get you very far if, when the debugger examines the executable code, it sees only addresses and no reference to the name HeightInInches anywhere.
Therefore, to debug properly, you need to make extra debugging information available in the executable. This information includes, among other things, names of variables and line information that enables the debugger to match up which executable machine assembly language instructions correspond to your original source code instructions. You will not, however, want that information in a release build, both for proprietary reasons (debugging information makes it a lot easier for other people to disassemble your code) and because it increases the size of the executable.
Extra Source Code Debugging Commands
A related issue is that quite often while you are debugging there will be extra lines in your code to display crucial debugging-related information. Obviously, you want the relevant commands removed entirely from the executable before you ship the software. You could do this manually, but wouldn’t it be so much easier if you could simply mark those statements in some way so that the compiler ignores them when it is compiling your code to be shipped? You’ve already seen in the first part of the book how this can be done in C# by defining a suitable processor symbol, and possibly using this in conjunction with the Conditional attribute, giving you what is known as conditional compilation.
What all these factors add up to is that you need to compile almost all commercial software in a slightly different way when debugging than in the final product that is shipped. Visual Studio can handle this because, as you have already seen, it stores details about all the options it is supposed to pass to the compiler when it has your code compiled. All that Visual Studio has to do to support different types of builds is store more than one set of such details. These different sets of build information are referred to as configurations. When you create a project, Visual Studio automatically gives you two configurations, Debug and Release:
- Debug — This configuration commonly specifies that no optimizations are to take place, extra debugging information is to be present in the executable, and the compiler is to assume that the debug preprocessor symbol Debug is present unless it is explicitly #undefined in the source code.
- Release — This configuration specifies that the compiler should optimize the compilation, that there should be no extra debugging information in the executable, and that the compiler should not assume that any particular preprocessor symbol is present.
You can define your own configurations as well. You might want to do this, for example, to set up professional-level builds and enterprise-level builds so that you can ship two versions of the software. In the past, because of issues related to Unicode character encodings being supported on Windows NT but not on Windows 95, it was common for C++ projects to feature a Unicode configuration and an MBCS (multi-byte character set) configuration.
Selecting a Configuration
At this point you might be wondering how Visual Studio, given that it stores details about more than one configuration, determines which one to use when arranging for a project to be built. The answer is that there is always an active configuration, which is the configuration that is used when you ask Visual Studio to build a project. (Note that configurations are set for each project, rather than each solution.)
By default, when you create a project, the Debug configuration is the active configuration. You can change which configuration is the active one by clicking the Build menu option and selecting the Configuration Manager item. It is also available through a drop-down menu in the main Visual Studio toolbar.
Editing Configurations
In addition to choosing the active configuration, you can also examine and edit the configurations. To do this, select the relevant project in Solution Explorer and then select Properties from the Project menu. This brings up a sophisticated dialog. (Alternatively, you can access the same dialog by right-clicking the name of the project in Solution Explorer and then selecting Properties from the context menu.)
This dialog contains a tabbed view that enables you to select many different general areas to examine or edit. Space does not permit showing all of these areas, but this section outlines a couple of the most important ones.
Figure 17-29 shows a tabbed view of the available properties for a particular application. This screenshot shows the general application settings for the ConsoleApplication1 project that you created earlier in the chapter.
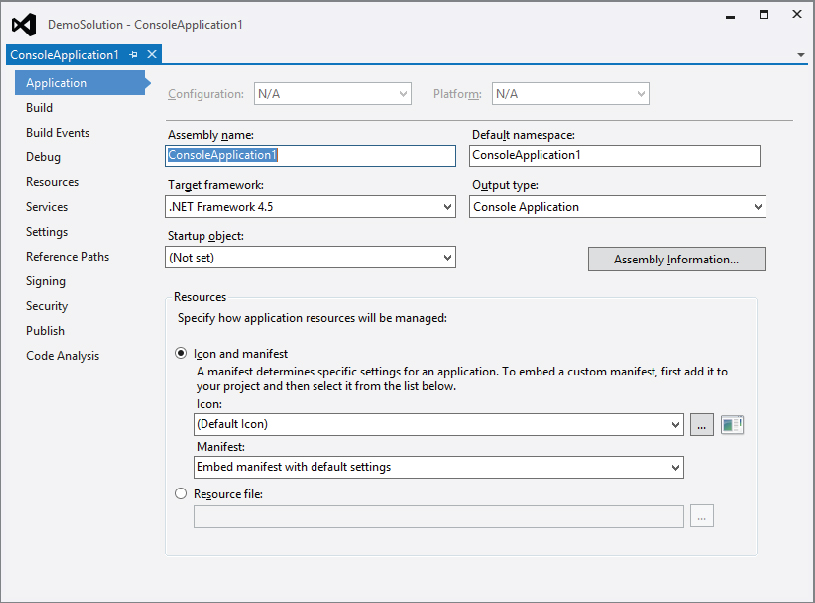
Among the points to note are that you can select the name of the assembly as well as the type of assembly to be generated. The options here are Console Application, Windows Application, and Class Library. Of course, you can change the assembly type if you want (though arguably, you might wonder why you did not pick the correct project type when you asked Visual Studio to generate the project for you in the first place)!
Figure 17-30 shows the build configuration properties. Note that a list box near the top of the dialog enables you to specify which configuration you want to look at. You can see — in the case of the Debug configuration — that the compiler assumes that the DEBUG and TRACE preprocessor symbols have been defined. In addition, the code is not optimized and extra debugging information is generated.

In general, you won’t need to adjust the configuration settings; but if you ever do need to modify them, you are now familiar with the different available configuration properties.
DEBUGGING YOUR CODE
At this point, you are ready to run and debug the application. In C#, as in pre-.NET languages, the main technique involved in debugging is simply setting breakpoints and using them to examine what is going on in your code at a certain point in its execution.
Setting Breakpoints
You can set breakpoints from Visual Studio on any line of your code that is actually executed. The simplest way is to click the line in the code editor, within the shaded area near the far left of the document window (or press the F9 key when the appropriate line is selected). This sets up a breakpoint on that particular line, which pauses execution and transfers control to the debugger as soon as that line is reached in the execution process. As in previous versions of Visual Studio, a breakpoint is indicated by a red circle to the left of the line in the code editor. Visual Studio also highlights the line by displaying the text and background in a different color. Clicking the circle again removes the breakpoint.
If breaking every time at a particular line is not adequate for your particular problem, you can also set conditional breakpoints. To do this, select Debug ⇒ Windows ⇒ Breakpoints. This brings up a dialog that requests details about the breakpoint you want to set. Among the options available, you can do the following:
- Specify that execution should break only after the breakpoint has been passed a certain number of times.
- Specify that the breakpoint should be activated only after the line has been reached a defined number of times — for example, every twentieth time a line is executed. (This is useful when debugging large loops.)
- Set the breakpoints relative to a variable, rather than an instruction. In this case, the value of the variable will be monitored and the breakpoints triggered whenever the value of this variable changes. You might find, however, that using this option slows down your code considerably. Checking whether the value of a variable has changed after every instruction adds a lot of processor time.
With this dialog you also have the option to export and import breakpoint settings, which is useful for working with different breakpoint arrangements depending on what scenario you want to debug into, and to store the debug settings.
Using Data Tips and Debugger Visualizers
After a breakpoint has been hit, you will usually want to investigate the values of variables. The simplest way to do this is to hover the mouse cursor over the name of the variable in the code editor. This causes a little data tip box that shows the value of that variable to pop up, which can also be expanded for greater detail. This data tip box is shown in Figure 17-31.

Some of the values shown in the data tip offer a magnifying glass. Clicking this magnifying class provides one or more options to use a debugger visualizer — depending on the type. With WPF controls, the WPF Visualizer enables you to take a closer look at the control (see Figure 17-32). With this visualizer you can view the visual tree that is used during runtime, including all the actual property settings. This visual tree also gives you a preview of the element that you select within the tree.
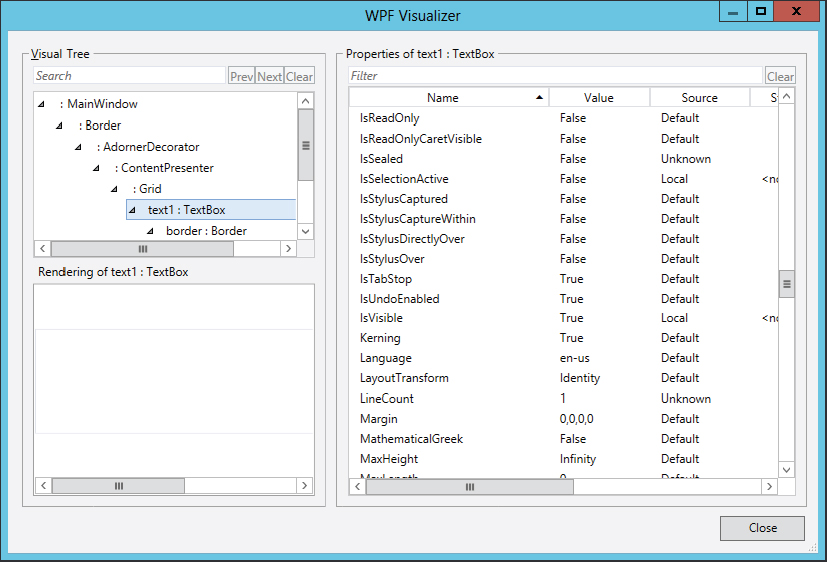
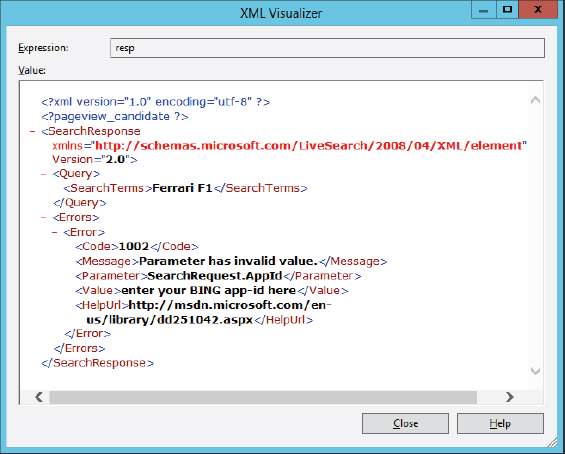
Figure 17-33 shows the XML Visualizer, which displays XML content. Many other visualizers are available as well, such as HTML and Text visualizers, and visualizers that display the content of a DataTable or DataSet.
Monitoring and Changing Variables
Sometimes you might prefer to have a more continuous look at values. For that you can use the Autos, Locals, and Watch windows to examine the contents of variables. Each of these windows is designed to monitor different variables:
- Autos — Monitors the last few variables that have been accessed as the program was executing.
- Locals — Monitors variables that are accessible in the method currently being executed.
- Watch — Monitors any variables that you have explicitly specified by typing their names into the Watch window. You can drag and drop variables to the Watch window.
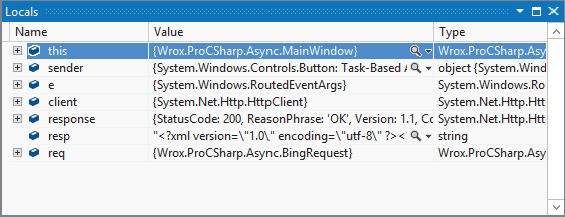
These windows are only visible when the program is running under the debugger. If you do not see them, select Debug ⇒ Windows, and then select the desired menu. The Watch window offers four different windows in case there’s so much to watch and you want to group that. With all these windows you can both watch and change the values, enabling you to try different paths in the program without leaving the debugger. The Locals window is shown in Figure 17-34.
Another window that not directly relates to the other windows discussed, but is still an important one on monitoring and changing variables is the Immediate window. This window also enables looking at variable values. You can use this window to enter code and run it. This is very helpful when doing some tests during a debug session, enabling you to hone in on details, try a method out, and change a debug run dynamically.
Exceptions
Exceptions are great when you are ready to ship your application, ensuring that error conditions are handled appropriately. Used well, they can ensure that users are never presented with technical or annoying dialogs. Unfortunately, exceptions are not so great when you are trying to debug your application. The problem is twofold:
- If an exception occurs when you are debugging, you often do not want it to be handled automatically — especially if automatically handling it means retiring gracefully and terminating execution! Rather, you want the debugger to help you determine why the exception has occurred. Of course, if you have written good, robust, defensive code, your program will automatically handle almost anything — including the bugs that you want to detect!
- If an exception for which you have not written a handler occurs, the .NET runtime will still search for one. Unfortunately, by the time it discovers there isn’t one, it will have terminated your program. There will not be a call stack left, and you will not be able to look at the values of any of your variables because they will all have gone out of scope.
Of course, you can set breakpoints in your catch blocks, but that often does not help very much because when the catch block is reached, flow of execution will, by definition, have exited the corresponding try block. That means the variables you probably wanted to examine the values of, to figure out what has gone wrong, will have gone out of scope. You will not even be able to look at the stack trace to find what method was being executed when the throw statement occurred, because control will have left that method. Setting the breakpoints at the throw statement will obviously solve this; but if you are coding defensively, there will be many throw statements in your code. How can you tell which one threw the exception?
Visual Studio provides a very neat answer to all of this. In the main Debug menu is an item called Exceptions. Clicking this item opens the Exceptions dialog (see Figure 17-35), where you can specify what happens when an exception is thrown. You can choose to continue execution or to stop and start debugging — in which case execution stops and the debugger steps in at the throw statement.

What makes this a really powerful tool is that you can customize the behavior according to which class of exception is thrown. You can configure to break into the debugger whenever it encounters any exception thrown by a .NET base class, but not to break into the debugger for specific exception types.
Visual Studio is aware of all the exception classes available in the .NET base classes, and of quite a few exceptions that can be thrown outside the .NET environment. Visual Studio is not automatically aware of any custom exception classes that you write, but you can manually add your exception classes to the list, and specify which of your exceptions should cause execution to stop immediately. To do this, just click the Add button (which is enabled when you have selected a top-level node from the tree) and type in the name of your exception class.
Multithreading
Visual Studio also offers great support for debugging multithreaded programs. When debugging multithreaded programs, you must understand that the program behaves differently depending on whether it is running in the debugger or not. If you reach a breakpoint, Visual Studio stops all threads of the program, so you have the chance to access the current state of all the threads. To switch between different threads you can enable the Debug Location toolbar. This toolbar contains a combo box for all processes and another combo box for all threads of the running application. Selecting a different thread you’ll find the code line where the thread currently halts, and the variables currently accessible from different threads. The Parallel Tasks window (shown in Figure 17-36) shows all running tasks, including their status, location, task name, the current thread that’s used by the task, the application domain, and the process identifier. This window also indicates when different threads block each other, causing a deadlock.

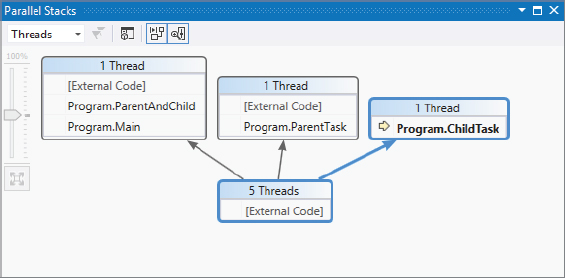
Figure 17-37 shows the Parallel Stacks window, where you can see different threads or tasks (depending on the selection) in a hierarchical view. You can jump to the source code directly by clicking the task or thread.
IntelliTrace
Another great debugging feature is IntelliTrace, which is available only with Visual Studio 2012 Ultimate Edition. IntelliTrace, also known as historical debugging, provides historical information. Hitting a breakpoint, you can have a look at previous information in time (see Figure 17-38), such as previous breakpoints, exceptions that were thrown, database access, ASP.NET events, tracing, or gestures from a user such as clicking a button. By clicking on previous events you can have a look at local variables, the call stack, and method calls that were done. This makes it easy to find problems without restarting a debug session and setting breakpoints to methods that have been invoked before seeing the issue.

REFACTORING TOOLS
Many developers develop their applications first for functionality; then, once the functionality is in place, they rework their applications to make them more manageable and more readable. This process is called refactoring. Refactoring involves reworking code for readability and performance, providing type safety, and ensuring that applications adhere to standard OO (object-oriented) programming practices. Reworking also happens when updates are made to applications.
The C# environment of Visual Studio 2012 includes a set of refactoring tools, which you can find under the Refactoring option in the Visual Studio menu. To see this in action, create a new class called Car in Visual Studio:
namespace ConsoleApplication1
{
  public class Car
  {
    public string color;
    public string doors;

    public int Go()
    {
      int speedMph = 100;
      return speedMph;
    }
  }
}
Now suppose that for the purpose of refactoring, you want to change the code a bit so that the color and door variables are encapsulated in public .NET properties. The refactoring capabilities of Visual Studio 2012 enable you to simply right-click either of these properties in the document window and select Refactor ⇒ Encapsulate Field. This will pull up the Encapsulate Field dialog, shown in Figure 17-39.

From this dialog you can provide the name of the property and click the OK button, which changes the selected public field into a private field, while also encapsulating the field in a public .NET property. After you click OK, the code is reworked into the following (after redoing both fields):
namespace ConsoleApplication1
{
  public class Car
  {
    private string color;
    public string Color
    {
      get { return color; }
      set { color = value; }
    }

    private string doors;
    public string Doors
    {
      get { return doors; }
      set { doors = value; }
    }

    public int Go()
    {
      int speedMph = 100;
      return speedMph;
    }
  }
}
As you can see, these wizards make it quite simple to refactor your code — not only on one page but throughout an entire application. Also included are capabilities to do the following:
- Rename method names, local variables, fields, and more
- Extract methods from a selection of code
- Extract interfaces based on a set of existing type members
- Promote local variables to parameters
- Rename or reorder parameters
You will find that the refactoring capabilities provided by Visual Studio 2012 offer a great way to get cleaner, more readable, and better-structured code.
ARCHITECTURE TOOLS
Before starting with coding programs, you should have an architectural viewpoint to your solution, analyze requirements and define a solution architecture. Architecture tools are available with the Visual Studio Ultimate 2012. Reading the diagrams is also possible with Visual Studio Premium 2012.
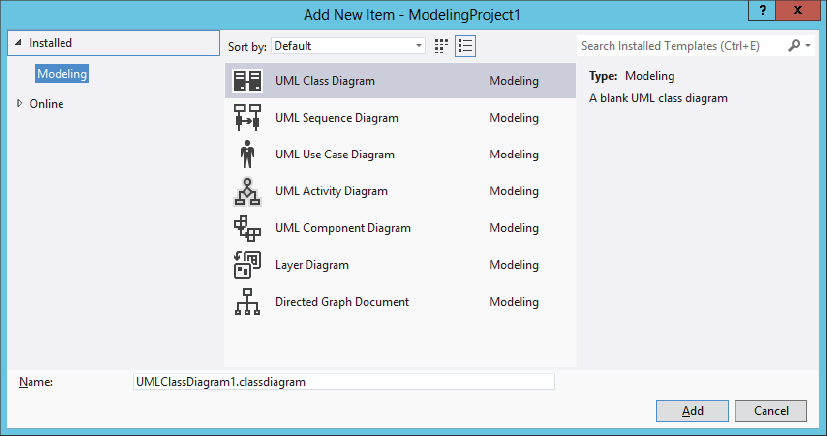
Figure 17-40 shows the Add New Item dialog that appears after creating a modeling project. It provides options to create a UML use case diagram, a class diagram, a sequence diagram, and an activity diagram. The standard UML diagrams are not discussed in this chapter, as you can find several books covering this group. Instead, this section looks at two Microsoft-specific diagrams: Directed Graph Document (or Dependency Graph) and Layer Diagram.
Dependency Graph
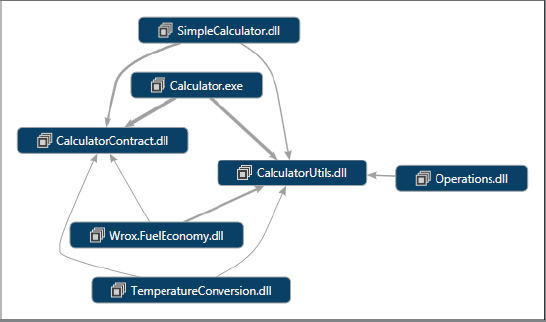
With the dependency graph you can see dependencies between assemblies, classes, and even members of classes. Figure 17-41 shows the dependency graph of a Calculator example from Chapter 30, “Managed Extensibility Framework” that includes a calculator hosting application and several libraries, such as a contract assembly and the add-in assemblies SimpleCalculator, FuelEconomy, and TemparatureConversion. The dependency graph is created by selecting Architecture ⇒ Generate Dependency Graph ⇒ For Solution. This activity analyzes all projects of the solution, displaying all the assemblies in a single diagram and drawing lines between the assemblies to show dependencies. In Figure 17-41 the external dependencies have been removed to show only the dependencies between the assemblies of the solution. The varying thickness of the lines between the assemblies reflects the degree of dependency. An assembly contains several types and members of types, and a number of types and its members are used from other assemblies.
You can dig deeper into the dependencies too. Figure 17-42 shows a more detailed diagram, including the classes of the Calculator assembly and their dependencies. The dependency on the CalculatorContract assembly is shown here as well. For simplicity, other assemblies have been removed from the diagram. In a large graph you can also zoom in and out of several parts of the graph.

You can even go deeper, displaying fields, properties, methods, and events, and how they depend on each other.
Layer Diagram
The layer diagram is very much related with the dependency graph. You can create the layer diagram out of the dependency graph (or from Solution Explorer by selecting assemblies or classes), or create the layer diagram from scratch before doing any development.
Different layers can define client and server parts in a distributed solution, e.g., a layer for a Windows application, one for the service, and one for the data access library, or layers based on assemblies. A layer can also contain other layers.
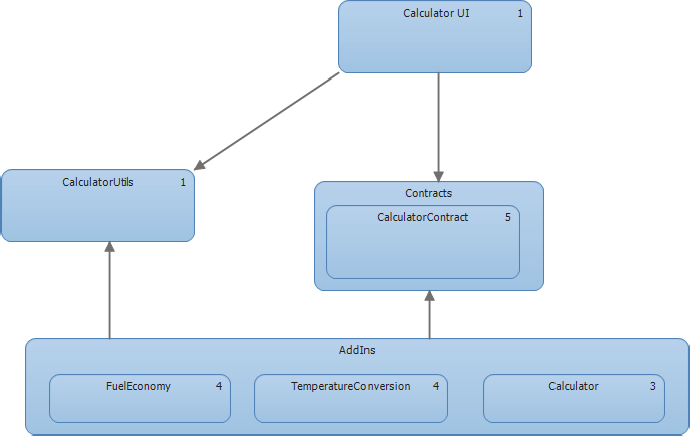
Figure 17-43 shows a layer diagram with the main layers Calculator UI, CalculatorUtils, Contracts, and AddIns. The AddIns layer contains inner layers FuelEconomy, TemperatureConversion, and Calculator. The number that’s displayed with the layer reflects the number of items that are linked to that layer.
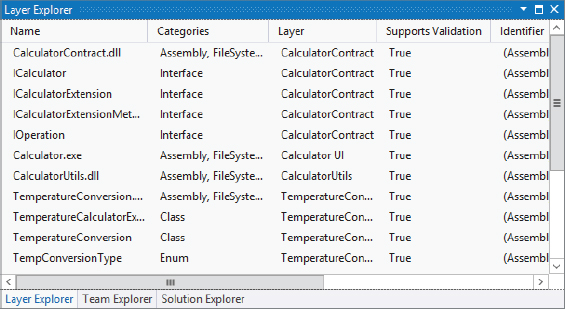
To create a layer diagram, select Architecture ⇒ New Diagram ⇒ Layer Diagram. This creates an empty diagram to which you can add layers from the toolbox or the Architecture Explorer. The Architecture Explorer contains a Solution View and a Class View from which you can select all items of the solution to add them to the layer diagram. Selecting items and dragging them to the layer is all you need to do build the layer diagram. Selecting a layer and clicking the context menu View Links opens the Layer Explorer, shown in Figure 17-44, which displays all the items contained in the selected layer(s).
During application development, the layer diagram can be validated to analyze whether all the dependencies are on track. If a layer has a dependency in a wrong direction, or has a dependency on a layer that it shouldn’t, this architecture validation returns with errors.
ANALYZING APPLICATIONS
The architectural diagrams discussed in the preceding section — the dependency graph and the layer diagram — are not only of interest before the coding starts, they also help in analyzing the application and keeping it on the right track to ensure that it doesn’t generate inaccurate dependencies. There are many more useful tools available with Visual Studio 2012 that can help you analyze and proactively troubleshoot your application. This section looks at some of these Visual Studio analysis tools.
Sequence Diagram
To better understand a single method, you can create a sequence diagram from the method. Sequence diagrams can be created directly from within the editor by clicking a method name and selecting the context menu Generate Sequence Diagram. Within the dialog to create the sequence diagram, you can specify the call depth for the analysis; whether you want to include calls from the current project, the solution, or the solution and external references; and whether calls to properties and System objects should be excluded.
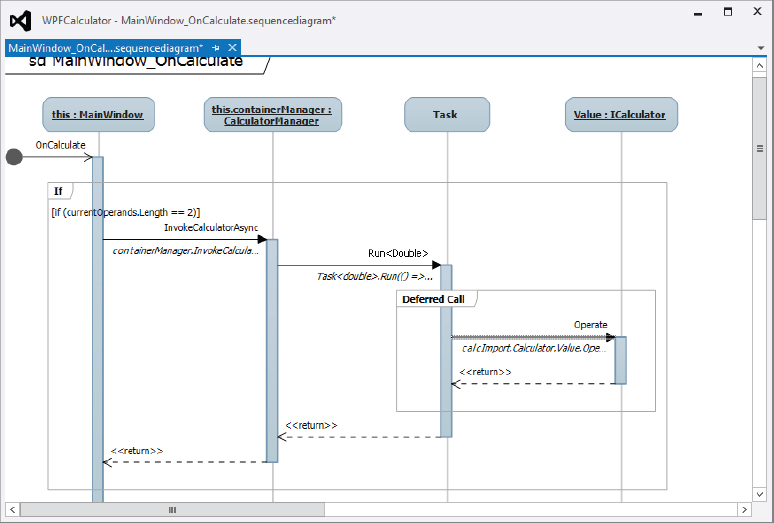
The sample diagram shown in Figure 17-45 is created from the WPFCalculator project created in the Managed Extensibility Framework sample in Chapter 30. It illustrates the sequence diagram of the method OnCalculate. Here, you can see that OnCalculate is an instance method in the MainWindow. At first, a condition is checked that verifies the length of currentOperands, and only continues if the value is 2. If this is successful, InvokeCalculatorAsync is invoked on the CalculatorManager class. The CalculatorManger class invokes the Run method of the Task type, and a deferred call started from the Run method invokes the Operate method on some object that implements the ICalculator interface.
Profiler
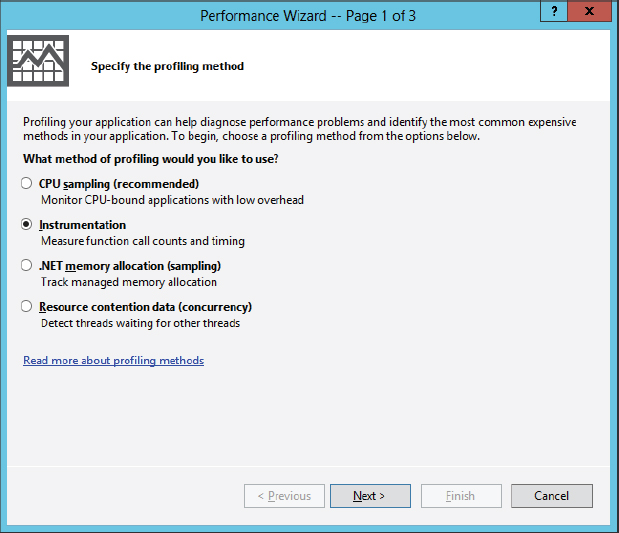
To analyze a complete run of the application, you can use the profiler. This performance tool enables you to find what methods are called how often, how much time is spent in what methods, how much memory is used, and much more. An easy way to start using profiling is to open the Performance Wizard by selecting Analyze ⇒ Launch Performance Wizard. Figure 17-46 shows the different profiling methods available. The first option, which has the least overhead, is CPU sampling. Using this option, performance information is sampled after specific time intervals. You don’t see all method calls invoked, in particular if they are running just for a short time. Again, the advantage of this option is low overhead. When running a profiling session, you must always be aware that you’re monitoring not only the performance of the application, but the performance of getting the data. You shouldn’t profile all data at once, as sampling all of the data influences the outcome. Collecting information about .NET memory allocation helps you identify memory leaks and provides information about what type of objects need how much memory. Resource contention data helps with the analysis of threads, enabling you to easily identify whether different threads block each other.
After configuring the options in the Performance Explorer, you can immediately start the application and run profiling after exiting the wizard. You can also change some options afterward by modifying the properties of a profiling setting. Using these settings, you can decide to add memory profiling with an instrumentation session, and add CPU counters and Windows counters to the profiling session to see this information in conjunction with the other profiled data.
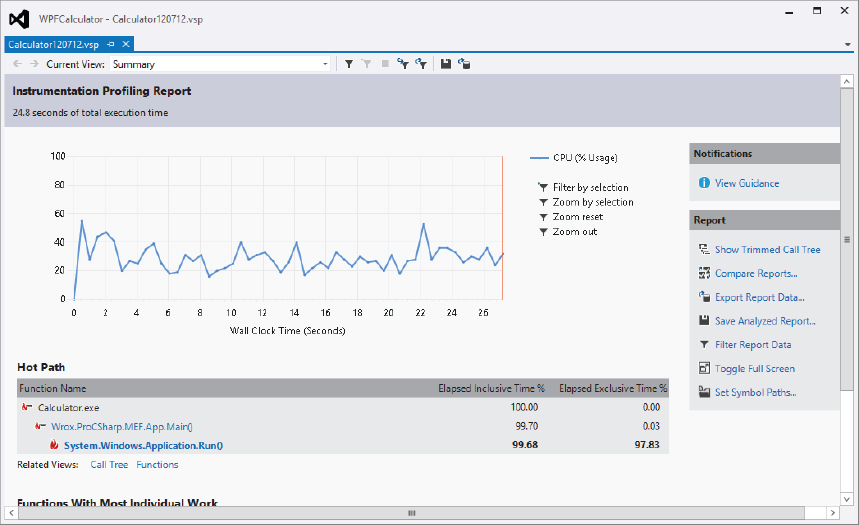
Figure 17-47 shows the summary screen of a profiling session. Here you can see CPU usage by the application, a hot path indicating which functions are taking the most time, and a sorted list of the functions that have used most CPU time.
The profiler has many more screens, too many to show here. One view is a function view that you can sort based on the number of calls made to the function, or the elapsed inclusive and exclusive times used by the function. This information can help you identify methods deserving of another look in terms of performance, while others might not be worthwhile because they are not called very often or they do not take an inordinate amount of time.
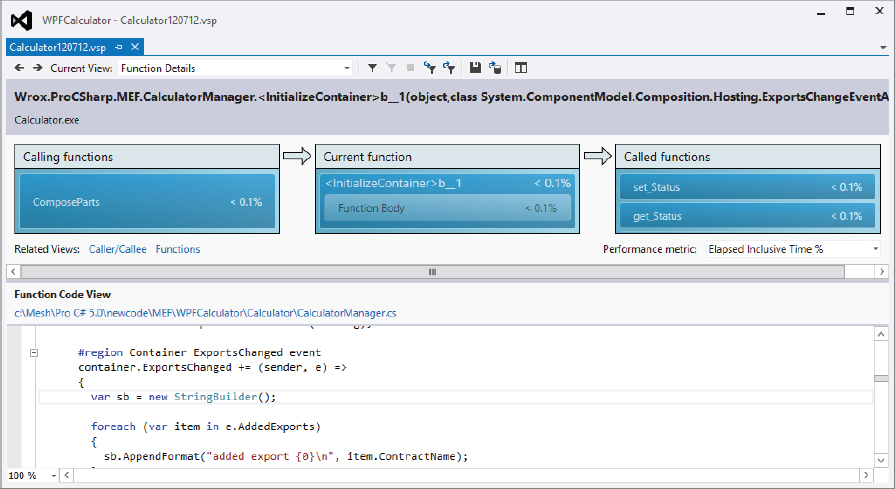
Clicking within a function, you can invoke details about it, as shown in Figure 17-48. This enables you to see which functions are called and immediately step into the source code. The Caller/Callee view also provides information about what functions have been called by what function.
Profiling is available with Visual Studio Professional Edition. Using the Premium Edition, you can configure tier interaction profiling that enables you to view the SQL statements generated and the time spent on ADO.NET queries, as well as information on ASP.NET pages.
Concurrency Visualizer
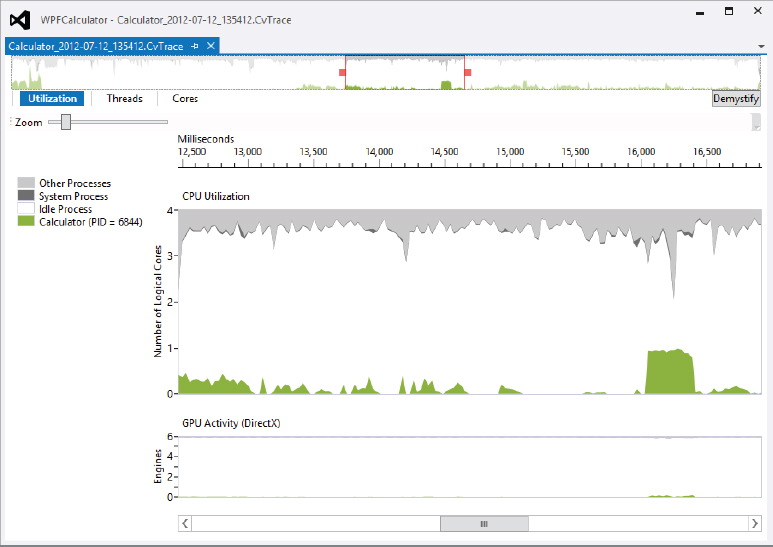
The Concurrency Visualizer helps you to analyze threading issues with applications. Running this analyzer tool provides a summary screen like the one shown in Figure 17-49. Here, you can compare the amount of CPU needed by the application with overall system performance. You can also switch to a Threads view that displays information about all the running application threads and what state they were in over time. Switching to the Cores view displays information about how many cores have been used. If your application just makes use of one CPU core and it is busy all the time, adding some parallelism features might improve performance by making use of more cores. You might see that different threads are active over time but only one thread is active at any given point in time. In that case, you should probably change your locking behavior. You can also see if threads are working on I/O. If the I/O rate is high with multiple threads, the disk might be the bottleneck and threads just wait on each other to complete I/O. This behavior might warrant reducing the number of threads doing I/O, or using an SSD drive. Clearly, these analysis tools provide a great deal of useful information.
Code Analysis
You can verify the code with code analysis rules. Static code analysis is available with the Professional Edition of Visual Studio 2012. Clicking the properties of a project, you can see the Code Analysis tab, where you can select and edit a set of code analysis rules that should be run upon building the project, or with s separate start of Run Code Analysis. A single rule set can be configured as shown in Figure 17-50. With the rule set you can also specify whether the rule should result in a warning or an error.

Before running the code analysis, you should define the rules that apply. Microsoft defines various rule sets for predefined rules, such as Microsoft Managed Recommended Rules or Microsoft Extended Design Guideline Rules. You can create your own rule set, or define the rule set to use. Even when applying a rule set, you might not agree with some of the rules, which is fine. You can configure the rule set to exclude that rule and/or add custom rules that fit your needs. You can also suppress rules, either on a per-project basis or just with classes or methods where the rule applies. For example, suppose one rule specifies that the spelling of Wrox should match what is used in the namespace. The spell-checking that is used by Visual Studio does not include “Wrox.” However, this term should be allowed as a namespace name. To not receive an error message for this term, you can ignore the rule. When the error comes up with the Analysis window, the erroneous rule can be selected to be suppressed. On suppression, either an attribute is added to the identifier where the error occurred or the rule is suppressed globally with the application in GlobalSuppressions.cs:
 [assembly: System.Diagnostics.CodeAnalysis.SuppressMessage("Microsoft.Naming",
   "CA1704:IdentifiersShouldBeSpelledCorrectly", MessageId = "Wrox",
   Scope = "namespace", Target = "Wrox.ProCSharp.MEF")]
Code Metrics
Checking code metrics provides information about how maintainable the code is. The code metrics shown in Figure 17-51 display a maintainability index for the complete namespace Wrox.ProCSharp.MEF of 82, and includes details about every class and method. These ratings are color-coded: A red rating, in the range of 0 to 9, means low maintainability; a yellow rating, in the range of 10 to 19, means moderate maintainability; and a green rating, in the range of 20 to 100, means high maintainability. The cyclomatic complexity provides feedback about the different code paths. More code paths means more unit tests are required to go through every option. The depth of inheritance reflects the hierarchy of the types. The greater the number of base classes, the harder it is to find the one to which a field belongs. The value for class coupling indicates how tightly types are coupled, e.g., used with parameters or locals. More coupling means more complexity in terms of maintaining the code.
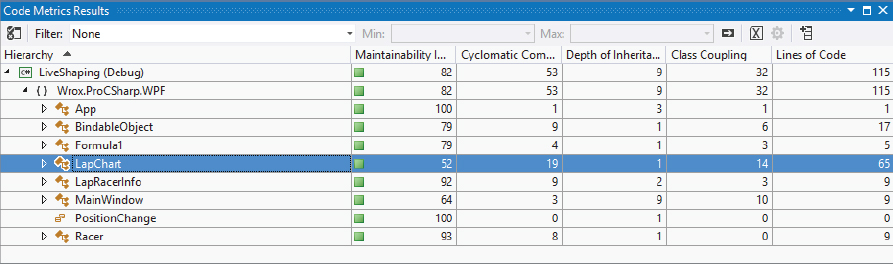
UNIT TESTS
Writing unit tests helps with code maintenance. For example, when performing a code update, you want to be confident that the update won’t break something else. Having automatic unit tests in place helps to ensure that all functionality is retained after code changes are made. Visual Studio 2012 offers a robust unit testing framework.
Creating Unit Tests
The following example tests a very simple method. The class DeepThought contains the TheAnswerToTheUltimateQuestionOfLifeTheUniverseAndEverything method, which returns 42 as a result. To ensure that nobody changes the method to return a wrong result (maybe someone who didn’t read The Hitchhiker’s Guide to the Galaxy), a unit test is created:
  public class DeepThought
  {
    public int TheAnswerToTheUltimateQuestionOfLifeTheUniverseAndEverything()
    {
      return 42;
    }
  }
To create a unit test, the Unit Test Project template is available within the group of Visual C# projects. A unit test class is marked with the TestClass attribute, and a test method with the TestMethod attribute. The implementation creates an instance of DeepThought and invokes the method that is to be tested, TheAnswerToTheUltimateQuestionOfLifeTheUniverseAndEverything. The return value is compared with the value 42 using Assert.AreEqual. In case Assert.AreEqual fails, the test fails:
  [TestClass]
  public class TestProgram
  {
    [TestMethod]
    public void
      TestTheAnswerToTheUltimateQuestionOfLifeTheUniverseAndEverything()
    {
      int expected = 42;
      DeepThought f1 = new DeepThought();
      int actual =
        f1.TheAnswerToTheUltimateQuestionOfLifeTheUniverseAndEverything();
      Assert.AreEqual(expected, actual);
    }
Running Unit Tests
Using the Test Explorer (opened via Test ⇒ Windows ⇒ Test Explorer), you can run the tests from the solution (see Figure 17-52).

Figure 17-53 shows a failed test, which includes all details about the failure.
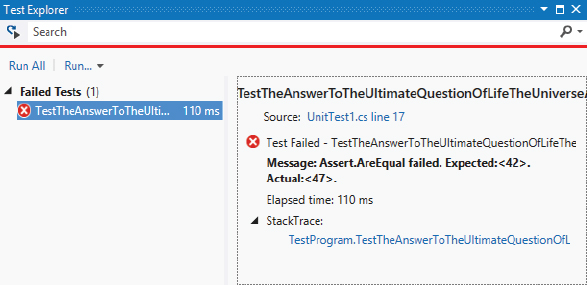
Of course, this was a very simple scenario, so the tests are not usually that simple. For example, methods can throw exceptions; they can have different routes to return other values; and they can make use of other code (e.g., database access code, or services that are invoked) that shouldn’t be tested with the single unit. Now you’ll look at a more involved scenario for unit testing.
The following class StringSample defines a constructor with a string parameter and contains the method GetStringDemo, which uses different paths depending on the first and second parameter and returns a string that results from these parameters, and a field member of the class:
  public class StringSample
  {
    public StringSample(string init)
    {
      if (init == null)
        throw new ArgumentNullException("init");
      this.init = init;
    }
    private string init;

    public string GetStringDemo(string first, string second)
    {
      if (first == null)
        throw new ArgumentNullException("first");
      if (string.IsNullOrEmpty(first))
        throw new ArgumentException("empty string is not allowed", first);
      if (second == null)
        throw new ArgumentNullException("second");
      if (second.Length > first.Length)
        throw new ArgumentOutOfRangeException("second",
          "must be shorter than first");

      int startIndex = first.IndexOf(second);
      if (startIndex < 0)
      {
        return string.Format("{0} not found in {1}", second, first);
      }
      else if (startIndex < 5)
      {
        return string.Format("removed {0} from {1}: {2}", second, first,
          first.Remove(startIndex, second.Length));
      }
      else
      {
        return init.ToUpperInvariant();
      }
    }
  }
A unit test should test every possible execution route, and check for exceptions, discussed next.
Expecting Exceptions
Invoking the constructor of the StringSample class and calling the method GetStringDemo with null, an ArgumentNullException is expected. This can be done with testing code easily, applying the ExpectedException attribute to the test method as shown in the following example. This way, the test method succeeds with the exception:
    [TestMethod]
    [ExpectedException(typeof(ArgumentNullException))]
    public void TestStringSampleNull()
    {
      StringSample sample = new StringSample(null);
    }
The exception thrown by the GetStringDemo method can be dealt with similarly.
Testing All Code Paths
To test all code paths, multiple tests can be created, with each one taking a different route. The following test sample passes the strings a and b to the GetStringDemo method. Because the second string is not contained within the first string, the first path of the if statement applies. The result is checked accordingly:
    [TestMethod]
    public void GetStringDemoAB()
    {
      string expected = "b not found in a";
      StringSample sample = new StringSample(String.Empty);
      string actual = sample.GetStringDemo("a", "b");
      Assert.AreEqual(expected, actual);
    }
The next test method verifies another path of the GetStringDemo method. Here, the second string is found in the first one, and the index is lower than 5; therefore, it results in the second code block of the if statement:
    [TestMethod]
    public void GetStringDemoABCDBC()
    {
      string expected = "removed bc from abcd: ad";
      StringSample sample = new StringSample(String.Empty);
      string actual = sample.GetStringDemo("abcd", "bc");
      Assert.AreEqual(expected, actual);
    }
All other code paths can be tested similarly. To see what code is covered by unit tests, and what code is still missing, you can open the Code Coverage Results window, shown in Figure 17-54.
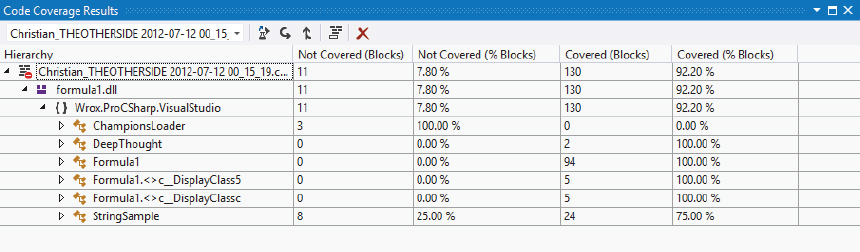
External Dependencies
Many methods are dependent on some functionality outside of the application’s control, e.g., calling a web service or accessing a database. Maybe the service or database is not available during some test runs, which tests the availability of these external resources. Or worse, maybe the database or service returns different data over time, and it’s hard to compare this with expected data. This must be excluded from the unit test.
The following example is dependent on some functionality outside. The method ChampionsByCountry accesses an XML file from a web server that contains a list of Formula-1 world champions with Firstname, Lastname, Wins, and Country elements. This list is filtered by country, and numerically ordered using the value from the Wins element. The returned data is a XElement that contains converted XML code:
    public XElement ChampionsByCountry(string country)
    {
      XElement champions = XElement.Load(
        "http://www.cninnovation.com/downloads/Racers.xml");
      var q = from r in champions.Elements("Racer")
              where r.Element("Country").Value == country
              orderby int.Parse(r.Element("Wins").Value) descending
              select new XElement("Racer",
                new XAttribute("Name", r.Element("Firstname").Value + " " +
                  r.Element("Lastname").Value),
                new XAttribute("Country", r.Element("Country").Value),
                new XAttribute("Wins", r.Element("Wins").Value));
      return new XElement("Racers", q.ToArray());
}For this method a unit test should be done. The test should not be dependent on the source from the server. Server unavailability is one issue, but it can also be expected that the data on the server changes over time to return new champions, and other values. The current test should ensure that filtering is done as expected, returning a correctly filtered list, and in the correct order.
One way to create a unit test that is independent of the data source is to refactor the implementation of the ChampionsByCountry method by using a factory that returns a XElement to replace the XElement.Load method with something that can be independent of the data source. The interface IChampionsLoader defines an interface with the method LoadChampions that can replace the aforementioned method:
  public interface IChampionsLoader
  {
    XElement LoadChampions();
  }
The class ChampionsLoader, which implements the interface IChampionsLoader, implements the interface by using the XElement.Load method:
  public class ChampionsLoader : IChampionsLoader
  {
    public XElement LoadChampions()
    {
      return XElement.Load("http://www.cninnovation.com/downloads/Racers.xml");
    }
  }
Now it’s possible to change the implementation of the ChampionsByCountry method (the new method is named ChampionsByCountry2 to make both variants available for unit testing) by using an interface to load the champions instead of using XElement.Load directly. The IChampionsLoader is passed with the constructor of the class Formula1, and this loader is then used by ChampionsByCountry2:
  public class Formula1
  {
    private IChampionsLoader loader;
    public Formula1(IChampionsLoader loader)
    {
      this.loader = loader;
    }

    public XElement ChampionsByCountry2(string country)
    {
      var q = from r in loader.LoadChampions().Elements("Racer")
              where r.Element("Country").Value == country
              orderby int.Parse(r.Element("Wins").Value) descending
              select new XElement("Racer",
                new XAttribute("Name", r.Element("Firstname").Value + " " +
                  r.Element("Lastname").Value),
                new XAttribute("Country", r.Element("Country").Value),
                new XAttribute("Wins", r.Element("Wins").Value));
      return new XElement("Racers", q.ToArray());
    }
  }
With a typical implementation, a ChampionsLoader instance would be passed to the Formula1 constructor to retrieve the racers from the server.
Creating the unit test, a custom method can be implemented that returns sample Formula-1 champions, as shown in the method Formula1SampleData:
    internal static string Formula1SampleData()
    {
      return @"
<Racers>
  <Racer>
    <Firstname>Nelson</Firstname>
    <Lastname>Piquet</Lastname>
    <Country>Brazil</Country>
    <Starts>204</Starts>
    <Wins>23</Wins>
  </Racer>
  <Racer>
    <Firstname>Ayrton</Firstname>
    <Lastname>Senna</Lastname>
    <Country>Brazil</Country>
    <Starts>161</Starts>
    <Wins>41</Wins>
  </Racer>
  <Racer>
    <Firstname>Nigel</Firstname>
    <Lastname>Mansell</Lastname>
    <Country>England</Country>
    <Starts>187</Starts>
    <Wins>31</Wins>
  </Racer>
  //... more sample data
For verifying the results that should be returned, verification data is created that matches the request with the sample data with the Formula1VerificationData method:
    internal static XElement Formula1VerificationData()
    {
      return XElement.Parse(@"
<Racers>
  <Racer Name=""Mika Hakkinen"" Country=""Finland"" Wins=""20"" />
  <Racer Name=""Kimi Raikkonen"" Country=""Finland"" Wins=""18"" />
</Racers>");
    }
The loader of the test data implements the same interface — IChampionsLoader — as the ChampionsLoader class. This loader just makes use of the sample data; it doesn’t access the web server:
    public class F1TestLoader : IChampionsLoader
    {
      public XElement LoadChampions()
      {
        return XElement.Parse(Formula1SampleData());
      }
    }
Now it’s easy to create a unit test that makes use of the sample data:
    [TestMethod]
    public void TestChampionsByCountry2()
    {

      Formula1 f1 = new Formula1(new F1TestLoader());
      XElement actual = f1.ChampionsByCountry2("Finland");

      Assert.AreEqual(Formula1VerificationData().ToString(),
        actual.ToString());
    }
Of course, a real test should not only cover a case that passes Finland as a string and two champions are returned with the test data. Other tests should be written to pass a string with no matching result, a case in which more than two champions are returned, and probably a case in which the number sort order would be different from the alphanumeric sort order.
Fakes Framework
It’s not always possible to refactor the method that should be tested to be independent of a data source. This is when the Fakes Framework becomes very useful. This framework is part of Visual Studio Ultimate Edition.
The ChampionsByCountry method is tested as it was before. The implementation makes use of XElement.Load, which directly accesses a file on the web server. The Fakes Framework enables you to change the implementation of the ChampionsByCountry method just for the testing case by replacing the XElement.Load method with something else:
    public XElement ChampionsByCountry(string country)
    {
      XElement champions = XElement.Load(
        "http://www.cninnovation.com/downloads/Racers.xml");
      var q = from r in champions.Elements("Racer")
              where r.Element("Country").Value == country
              orderby int.Parse(r.Element("Wins").Value) descending
              select new XElement("Racer",
                new XAttribute("Name", r.Element("Firstname").Value + " " +
                  r.Element("Lastname").Value),
                new XAttribute("Country", r.Element("Country").Value),
                new XAttribute("Wins", r.Element("Wins").Value));
      return new XElement("Racers", q.ToArray());
    }
To use the Fakes Framework with the references of the unit testing project, select the assembly that contains the XElement class. XElement is within the System.Xml.Linq assembly. Opening the context menu while the System.Xml.Linq assembly is selected provides the menu option Add Fakes Assembly. Selecting this creates the System.Xml.Linq.4.0.0.0.Fakes assembly, which contains shim classes in the namespace System.Xml.Linq.Fakes. You will find all the types of the System.Xml.Linq assembly with a shimmed version, e.g., ShimXAttribute for XAttribute, and ShimXDocument for XDocument. For the example, only ShimXElement is needed. ShimXElement contains a member for every public overloaded member of the XElement class. The Load method of XElement is overloaded to receive a string, a Stream, a TextReader, and an XmlReader, and overloads exist with a second LoadOptions parameter. ShimXElement defines members named LoadString, LoadStream, LoadTextReader, LoadXmlReader, and others with LoadOptions as well, such as LoadStringLoadOptions and LoadStreamLoadOptions. All these members are of a delegate type that allows specifying a custom method that should be invoked in place of the method call in the method that should be tested. The unit test method TestChampionsByCountry replaces the XElement.Load method with one parameter in the Formula1.ChampionsByCountry method with the call to XElement.Parse, accessing the sample data. ShimXElement.LoadString specifies the new implementation. Using shims, it’s necessary to create a context, which you can do using ShimsContext.Create. The context is active until the Dispose method is invoked by the end of the using block:
    [TestMethod]
    public void TestChampionsByCountry()
    {
      using (ShimsContext.Create())
      {
        ShimXElement.LoadString = s => XElement.Parse(Formula1SampleData());

        Formula1 f1 = new Formula1();
        XElement actual = f1.ChampionsByCountry("Finland");

        Assert.AreEqual(Formula1VerificationData().ToString(),
          actual.ToString());
      }
    }
Although it is best to have a flexible implementation of the code that should be tested, the Fakes Framework offers a useful way to change an implementation such that it is not dependent on outside resources for testing purposes.
WINDOWS 8, WCF, WF, AND MORE
This last section of the chapter looks at some specific application types. We’ve already covered console and WPF applications; now let’s get into WCF, WF, and Windows 8 applications. Windows 8 applications are new with Visual Studio 2012, but only if you’re running on a Windows 8 system, of course.
Building WCF Applications with Visual Studio 2012
A WCF service library is a project template for creating a service that can be called from a client application using requests that use either the SOAP protocol across HTTP, TCP, or other networking protocols, or a REST-style form of communication.
The template for the WCF service application automatically creates a service contract, an operation contract, a data contract, and a service implementation file — all you need to provide is a small sample implementation.
Running the application starts both a server and a client application to test the service. The dialog of the server application is shown in Figure 17-55. If the host fails to start for some reason, you can access this dialog from the Windows notification area to determine the cause. If the host shouldn’t be started, you can disable it with the WCF options in the project properties.
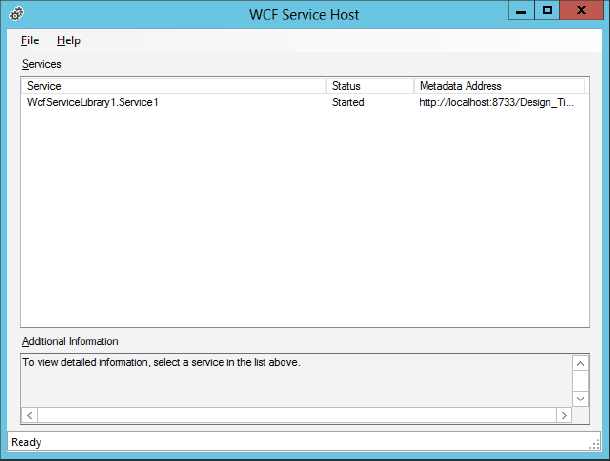
The WCF Test client (see Figure 17-56) is started because of the debug command-line argument settings /client:"WcfTestClient.exe". Using this dialog you can invoke many different kinds of service calls (not all calls are supported). It enables easy testing that also provides information about the SOAP message that is sent.
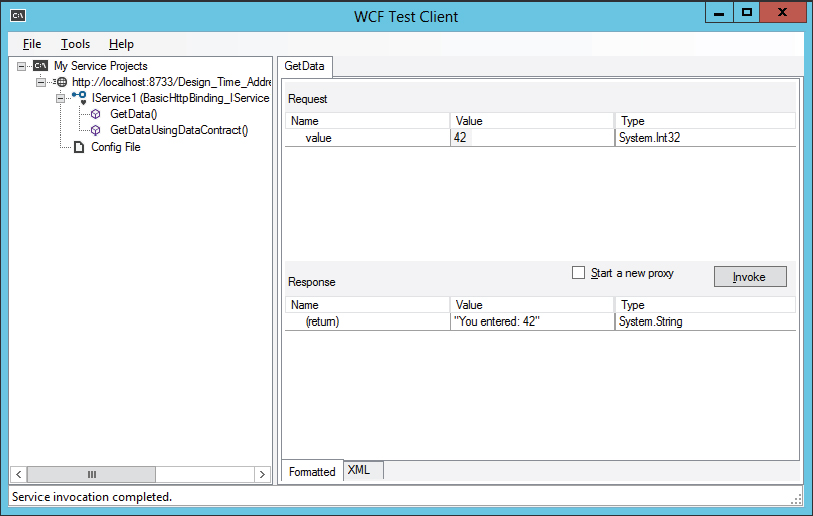
WCF applications are discussed in detail in Chapter 43, “Windows Communication Foundation.”
Building WF Applications with Visual Studio 2012
Another dramatically different application style (when it comes to building the application from within Visual Studio) is the Windows Workflow application type. For an example of this, select the Workflow Console Application project type from the Workflow section of the New Project dialog. This will create a console application with a Workflow1.xaml file.
When building applications that make use of Windows Workflow Foundation, you’ll notice that there is a heavy dependency on the design view. With the designer, you can create variables and drop many different activities from the toolbox onto the design view. Looking closely at the workflow (see Figure 17-57), you can see that it consists of a while loop, a sequence, and actions based on conditions (such as an if-else statement).
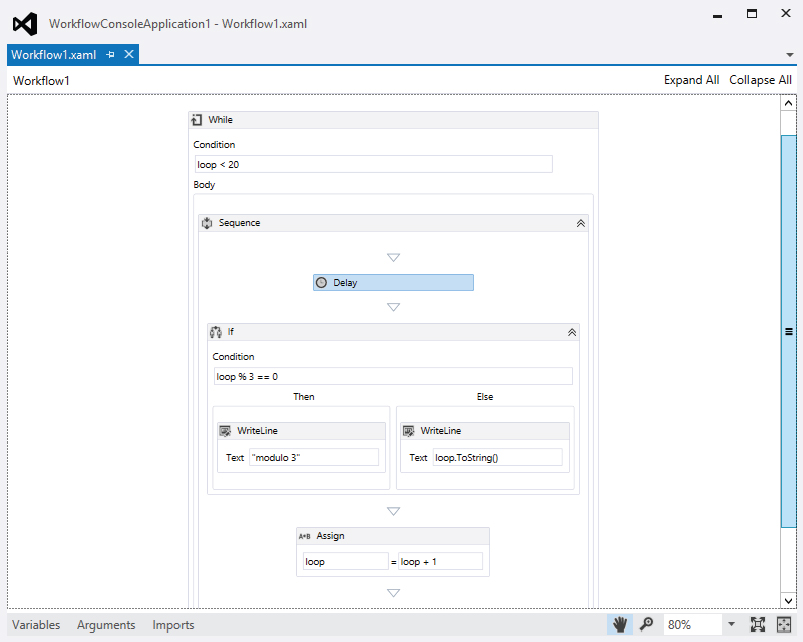
Windows Workflow Foundation is covered in detail in Chapter 45, “Windows Workflow Foundation”
Building Windows Store apps with Visual Studio 2012
A complete new category of Visual Studio project templates is available for Windows Store apps: Windows Store. The Grid App (XAML) template already contains three pages with sample data. Using this template, you’ll find several files in Solution Explorer. The Assets folder contains some predefined icons. The Common folder contains some helper classes such as a base class for bindable objects, converters, a suspension manager, and a base page class that is aware of layout changes. The DataModel folder contains classes that produce sample data, and there are some XAML pages with code-behind. A package Manifest Editor opens when you click the Package.appxmanifest file (see Figure 17-58). This editor, which is specific to Windows Store apps, enables configuration of the UI to define names and tiles, capabilities and declarations, and how the application should be packaged.
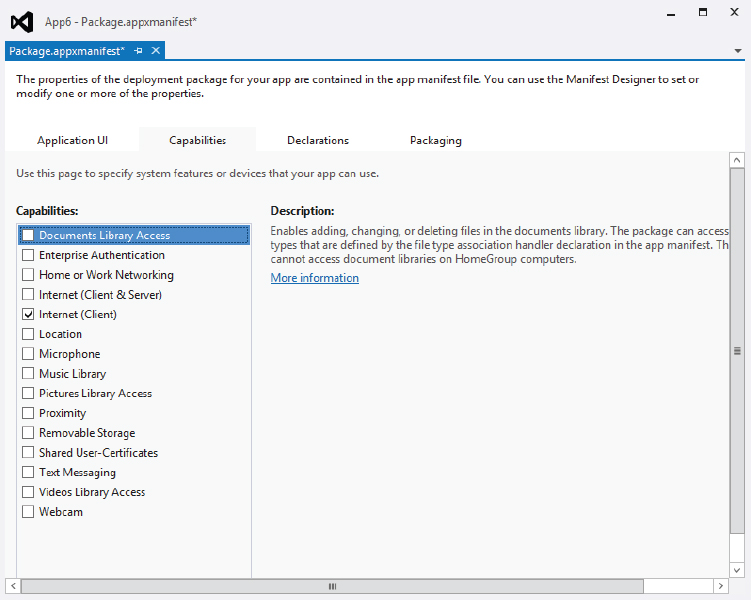
Running the application (see Figure 17-59), you can see that the template already defined formatting and styles as required by the Windows Store app guidelines. Clearly, it’s a lot easier to start with this, rather than create all the styles from scratch. You likely already know some Windows Store apps that were started with this project template.
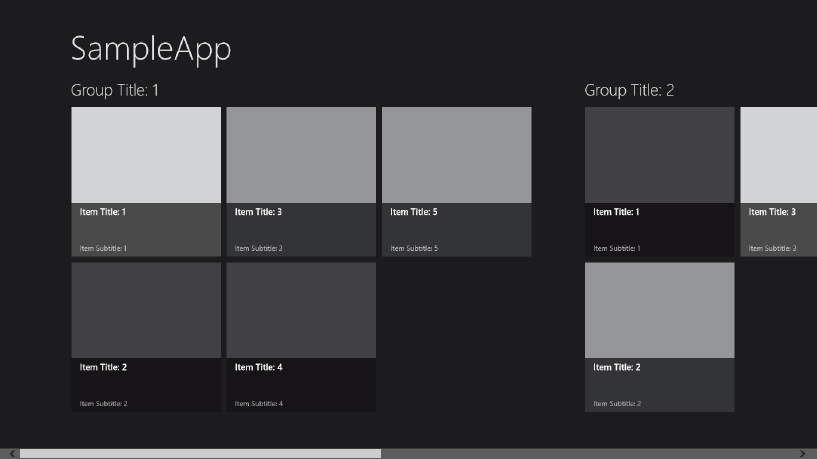
Windows Store apps are covered in more detail in Chapters 31, “Windows Runtime,” and 38, “Windows Store apps.”
SUMMARY
This chapter explored one of the most important programming tools in the .NET environment: Visual Studio 2012. The bulk of the chapter examined how this tool facilitates writing code in C#.
Visual Studio 2012 is one of the easiest development environments to work with in the programming world. Not only does Visual Studio make rapid application development (RAD) easy to achieve, it enables you to dig deeply into the mechanics of how your applications are created. This chapter focused on using Visual Studio for refactoring, multi-targeting, analyzing existing code, and creating unit tests and making use of the Fakes Framework.
This chapter also looked at some of the latest projects available to you through the .NET Framework 4.5, including Windows Presentation Foundation, Windows Communication Foundation, Windows Workflow Foundation, and of course Windows Store apps.
Chapter 18 is on deployment of applications.