
Chapter 20
Diagnostics
WHAT’S IN THIS CHAPTER?
- Code contracts
- Tracing
- Event logging
- Performance monitoring
WROX.COM CODE DOWNLOADS FOR THIS CHAPTER
The wrox.com code downloads for this chapter are found at http://www.wrox.com/remtitle.cgi?isbn=1118314425 on the Download Code tab. The code for this chapter is divided into the following major examples:
- Code Contracts
- Tracing Demo
- Tracing Demo with EventLog
- Event Log
- Event Log Reader
- Performance Counter
DIAGNOSTICS OVERVIEW
This chapter explains how to get real-time information about your running application in order to identify any issues that it might have during production or to monitor resource usage to ensure that higher user loads can be accommodated. This is where the namespace System.Diagnostics comes into play. This namespace offers classes for tracing, event logging, performance counts, and code contracts.
One way to deal with errors in your application, of course, is by throwing exceptions. However, an application might not fail with an exception, but still not behave as expected. The application might be running well on most systems but have a problem on a few. On the live system, you can change the log behavior by changing a configuration value and get detailed live information about what’s going on in the application. This can be done with tracing.
If there are problems with applications, the system administrator needs to be informed. The Event Viewer is a commonly used tool that not only the system administrator should be aware of. With the Event Viewer, you can both interactively monitor problems with applications and be informed about specific events that happen by adding subscriptions. The event-logging mechanism enables you to write information about the application.
To analyze resources needed by applications, you can monitor applications with specified time intervals, e.g. get counts every 5 minutes. This way you can have data for 24 hours or a week without filling terabytes, and can plan for a different application distribution or the extension of system resources. The Performance Monitor (PerfMon) can be used to get these data. You can write live data from your application by using performance counts.
Design by contract is another feature offered by the .NET Framework. A method signature defines the type of parameters. It doesn’t give you any information about the values that you can pass to the method. This is a feature of design by contract. Using classes from the namespace System.Diagnostics.Contracts you can define preconditions, postconditions, and invariants. These contracts can be checked during runtime but also with a static contract analyzer. This chapter explains these facilities and demonstrates how you can use them from your applications.
CODE CONTRACTS
Design by contract is an idea from the Eiffel programming language that defines preconditions, postconditions, and invariants. .NET includes classes for static and runtime checks of code within the namespace System.Diagnostics.Contracts that can be used by all .NET languages. With this functionality you can define preconditions, postconditions, and invariants within a method. The preconditions specify what requirements the parameters must fulfill, the postconditions define the requirements on returned data, and the invariants define the requirements of variables within the method itself.
Contract information can be compiled both into the debug code and the release code. It is also possible to define a separate contract assembly, and many checks can be made statically without running the application. You can also define contracts on interfaces that cause the implementations of the interface to fulfill the contracts. Contract tools can rewrite the assembly to inject contract checks within the code for runtime checks, check the contracts during compile time, and add contract information to the generated XML documentation.
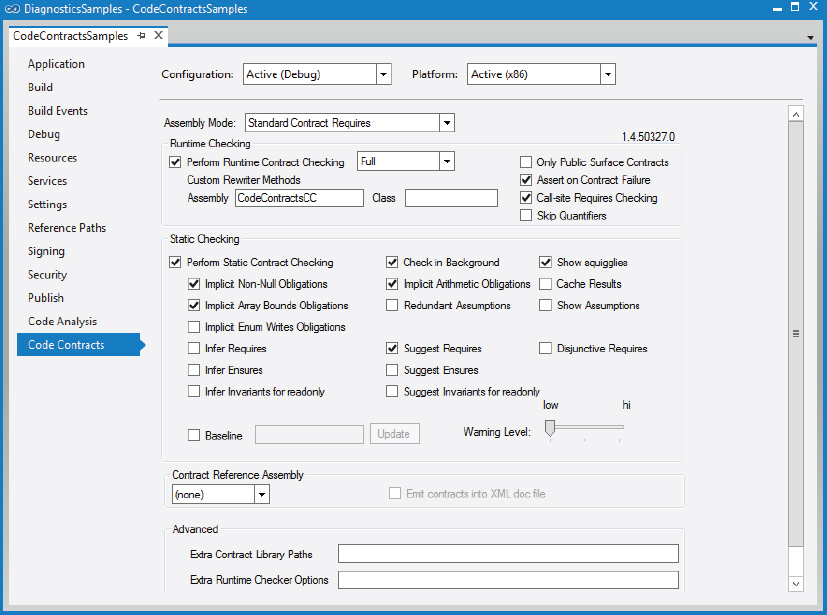
Figure 20-1 shows the project properties for the code contracts in Visual Studio 2012. Here, you can define what level of runtime checking should be done, indicate whether assert dialogs should be opened on contract failures, and configure static checking. Setting the Perform Runtime Contract Checking to Full defines the symbol CONTRACTS_FULL. Because many of the contract methods are annotated with the attribute [Conditional("CONTRACTS_FULL")], all runtime checks are performed with this setting only.
Code contracts are defined with the Contract class. All contract requirements that you define in a method, whether they are preconditions or postconditions, must be placed at the beginning of the method. You can also assign a global event handler to the event ContractFailed that is invoked for every failed contract during runtime. Invoking SetHandled with the e parameter of type ContractFailedEventArgs stops the standard behavior of failures that would throw an exception (code file CodeContractSamples/Program.cs).
      Contract.ContractFailed += (sender, e) =>
      {
        Console.WriteLine(e.Message);
        e.SetHandled();
      };
Preconditions
Preconditions check the parameters that are passed to a method. With the Contract class, preconditions are defined with the Requires method. With the Requires method, a Boolean value must be passed, and an optional message string with the second parameter that is shown when the condition does not succeed. The following example requires that the argument min be less than or equal to the argument max:
    static void MinMax(int min, int max)
    {
      Contract.Requires(min <= max);
      //...
    }
Using the generic variant of the Requires method enables specifying an exception type that should be invoked in case the condition is not fulfilled. The following contract throws an ArgumentNullException if the argument o is null. The exception is not thrown if an event handler sets the ContractFailed event to handled. Also, if the Assert on Contract Failure setting is configured, Trace.Assert is used to stop the program instead of throwing the exception defined.
    static void Preconditions(object o)
    {
      Contract.Requires<ArgumentNullException>(o != null,
          "Preconditions, o may not be null");
      //...
Requires<TException> is not annotated with the attribute [Conditional("CONTRACTS_FULL")]; nor does it have a condition on the DEBUG symbol, so this runtime check is done in any case. Requires<TException> throws the defined exception if the condition is not fulfilled.
For checking collections that are used as arguments, the Contract class offers Exists and ForAll methods. ForAll checks every item in the collection if the condition succeeds. In the example, it checks whether every item in the collection has a value smaller than 12. With the Exists method, it checks whether any one element in the collection meets the condition:
    static void ArrayTest(int[] data)
    {
      Contract.Requires(Contract.ForAll(data, i => i < 12));
Both the methods Exists and ForAll have an overload whereby you can pass two integers, fromInclusive and toExclusive, instead of IEnumerable<T>. A range from the numbers (excluding toExclusive) is passed to the predicate defined with the third parameter. Exists and ForAll can be used with preconditions, postconditions, and invariants.
Postconditions
Postconditions define guarantees about shared data and return values after the method has completed. Although they define some guarantees on return values, they must be written at the beginning of a method; all contract requirements must be at the beginning of the method.
Ensures and EnsuresOnThrow<TException> are postconditions. The following contract ensures that the variable sharedState is less than 6 at the end of the method (the value can change in between):
    private static int sharedState = 5;
    static void Postcondition()
    {
      Contract.Ensures(sharedState < 6);

      sharedState = 9;
      Console.WriteLine("change sharedState invariant {0}", sharedState);
      sharedState = 3;
      Console.WriteLine("before returning change it to a valid value {0}",
          sharedState);
    }
With EnsuresOnThrow<TException>, it is guaranteed that a shared state meets a condition if a specified exception is thrown.
To guarantee a return value, the special value Result<T> can be used with an Ensures contract. In the next example, the result is of type int as is also defined with the generic type T for the Result method. The Ensures contract guarantees that the return value is less than 6:
    static int ReturnValue()
    {
      Contract.Ensures(Contract.Result<int>() < 6);
      return 3;
    }
You can also compare a current value to an old value. This is done with the OldValue<T> method, which returns the original value on method entry for the variable passed. The following contract ensures that the result returned from the method is larger than the old value received from the argument x:
    static int ReturnLargerThanInput(int x)
    {
      Contract.Ensures(Contract.Result<int>() > Contract.OldValue<int>(x));
      return x + 3;
    }
If a method returns values with the out modifier instead of just with the return statement, conditions can be defined with ValueAtReturn. The following contract defines that the x variable must be larger than 5 and smaller than 20 on return, and with the y variable modulo 5 must equal 0 on return:
    static void OutParameters(out int x, out int y)
    {
      Contract.Ensures(Contract.ValueAtReturn<int>(out x) > 5 &&
        Contract.ValueAtReturn<int>(out x) < 20);
      Contract.Ensures(Contract.ValueAtReturn<int>(out y) % 5 == 0);
      x = 8;
      y = 10;
    }
Invariants
Invariants define contracts for variables during the object’s lifetime. Contract.Requires defines input requirements of a method, and Contract.Ensures defines requirements on method end. Contract.Invariant defines conditions that must succeed during the whole lifetime of an object.
The following code snippet shows an invariant check of the member variable x, which must be larger than 5. With the initialization of x, x is initialized to 10, which fulfills the contract. The call to Contract.Invariant can only be placed within a method that has the ContractInvariantMethod attribute applied. This method can be public or private, can have any name (the name ObjectInvariant is suggested), and can only contain contract invariant checks.
    private int x = 10;

    [ContractInvariantMethod]
    private void ObjectInvariant()
    {
      Contract.Invariant(x > 5);
    }
Invariant verification is always done at the end of public methods. In the next example, the method Invariant assigns 3 to the variable x, which results in a contract failure at the end of this method:
    public void Invariant()
    {
      x = 3;
      Console.WriteLine("invariant value: {0}", x);

      // contract failure at the end of the method
    }
Purity
You can use custom methods within contract methods, but these methods must be pure. Pure means that the method doesn’t change any visible state of the object.
You can mark methods and types as pure by applying the Pure attribute. Get accessors of properties are assumed to be pure by default. With the current version of the code contract tools, purity is not enforced.
Contracts for Interfaces
With interfaces you can define methods, properties, and events that a class derived from the interface must implement. With the interface declaration you cannot define how the interface must be implemented, but now this is possible using code contracts.
In the following example, the interface IPerson defines FirstName, LastName, and Age properties, and the method ChangeName. What’s special about this interface is the attribute ContractClass. This attribute is applied to the interface IPerson and defines that the PersonContract class is used as the code contract for the interface (code file CodeContractsSamples/IPerson.cs).
  [ContractClass(typeof(PersonContract))]
  public interface IPerson
  {
    string FirstName { get; set; }
    string LastName { get; set; }
    int Age { get; set; }
    void ChangeName(string firstName, string lastName);
  }
The class PersonContract implements the interface IPerson and defines code contracts for all the members. This is defined with the get accessors of the properties but can also be defined with all methods that are not allowed to change state. The FirstName and LastName get accessors also define that the result must be a string with Contract.Result. The get accessor of the Age property defines a postcondition, ensuring that the returned value is between 0 and 120. The set accessor of the FirstName and LastName properties requires that the value passed is not null. The set accessor of the Age property defines a precondition that the passed value is between 0 and 120 (code file CodeContractSamples/PersonContract.cs).
  [ContractClassFor(typeof(IPerson))]
  public abstract class PersonContract : IPerson
  {
    string IPerson.FirstName
    {
      get { return Contract.Result<String>(); }
      set { Contract.Requires(value != null); }
    }
    string IPerson.LastName
    {
      get { return Contract.Result<String>(); }
      set { Contract.Requires(value != null); }
    }
    int IPerson.Age
    {
      get
      {
        Contract.Ensures(Contract.Result<int>() >= 0 &&
                         Contract.Result<int>() < 121);
        return Contract.Result<int>();
      }
      set
      {
        Contract.Requires(value >= 0 && value < 121);
      }
    }
    void IPerson.ChangeName(string firstName, string lastName)
    {
      Contract.Requires(firstName != null);
      Contract.Requires(lastName != null);
    }
  }
Now a class implementing the IPerson interface must fulfill all the contract requirements. The class Person is a simple implementation of the interface that fulfills the contract (code file CodeContractsSamples/Person.cs):
  public class Person : IPerson
  {
    public Person(string firstName, string lastName)
    {
      this.FirstName = firstName;
      this.LastName = lastName;
    }

    public string FirstName { get; private set; }
    public string LastName { get; private set; }
    public int Age { get; set; }


    public void ChangeName(string firstName, string lastName)
    {
      this.FirstName = firstName;
      this.LastName = lastName;
    }
  }
When using the class Person, the contract must also be fulfilled. For example, assigning null to a property is not allowed:
      var p = new Person { FirstName = "Tom", LastName = null };
      // contract error
Nor is it allowed to assign an invalid value to the Age property:
      var p = new Person { FirstName = "Tom", LastName = "Turbo" };
      p.Age = 133; // contract error
Abbreviations
A new feature of .NET 4.5 and code contracts are abbreviations. If some contracts are required repeatedly, a reuse mechanism is available. A method that contains multiple contracts can be attributed with the ContractAbbreviator attribute, and thus it can be used within other methods requiring this contract:
    [ContractAbbreviator]
    private static void CheckCollectionContract(int[] data)
    {
      Contract.Requires<ArgumentNullException>(data != null);
      Contract.Requires(Contract.ForAll(data, x => x < 12));
    }
Now the method CheckCollectionContract can be used within a method, checking for both null for the parameter and the values of the collection:
    private static void Abbrevations(int[] data)
    {
      CheckCollectionContract(data);
    }
Contracts and Legacy Code
With a lot of legacy code, arguments are often checked with if statements and throw an exception if a condition is not fulfilled. With code contracts, it is not necessary to rewrite the verification; just add one line of code:
    static void PrecondtionsWithLegacyCode(object o)
    {
      if (o == null) throw new ArgumentNullException("o");
        Contract.EndContractBlock();
The EndContractBlock defines that the preceding code should be handled as a contract. If other contract statements are used as well, the EndContractBlock is not necessary.
TRACING
Tracing enables you to see informational messages about the running application. To get information about a running application, you can start the application in the debugger. During debugging, you can walk through the application step by step and set breakpoints at specific lines and when you reach specific conditions. The problem with debugging is that a program with release code can behave differently from a program with debug code. For example, while the program is stopping at a breakpoint, other threads of the application are suspended as well. Also, with a release build, the compiler-generated output is optimized and, thus, different effects can occur. With optimized release code, garbage collection is much more aggressive than with debug code. The order of calls within a method can be changed, and some methods can be removed completely and be called in-place. There is a need to have runtime information from the release build of a program as well. Trace messages are written with both debug and release code.
A scenario showing how tracing helps is described here. After an application is deployed, it runs on one system without problems, while on another system intermittent problems occur. When you enable verbose tracing, the system with the problems gives you detailed information about what’s happening inside the application. The system that is running without problems has tracing configured just for error messages redirected to the Windows event log system. Critical errors are seen by the system administrator. The overhead of tracing is very small because you configure a trace level only when needed.
The tracing architecture has four major parts:
- Source — The originator of the trace information. You use the source to send trace messages.
- Switch — Defines the level of information to log. For example, you can request just error information or detailed verbose information.
- Listeners — Trace listeners define the location to which the trace messages should be written.
- Filters — Listeners can have filters attached. The filter defines what trace messages should be written by the listener. This way, you can have different listeners for the same source that write different levels of information.
Figure 20-2 shows a Visual Studio class diagram illustrating the major classes for tracing and how they are connected. The TraceSource uses a switch to define what information to log. It has a TraceListenerCollection associated with it, to which trace messages are forwarded. The collection consists of TraceListener objects, and every listener has a TraceFilter connected.

Trace Sources
You can write trace messages with the TraceSource class. Tracing requires the Trace flag of the compiler settings. With a Visual Studio project, the Trace flag is set by default with debug and release builds, but you can change it through the Build properties of the project.
To write trace messages, you need to create a new TraceSource instance. In the constructor, the name of the trace source is defined. The method TraceInformation writes an informational message to the trace output. Instead of just writing informational messages, the TraceEvent method requires an enumeration value of type TraceEventType to define the type of the trace message. TraceEventType.Error specifies the message as an error message. You can define it with a trace switch to see only error messages.
The second argument of the TraceEvent method requires an identifier. The ID can be used within the application itself. For example, you can use id 1 for entering a method and id 2 for exiting a method. The method TraceEvent is overloaded, so the TraceEventType and the ID are the only required parameters. Using the third parameter of an overloaded method, you can pass the message written to the trace. TraceEvent also supports passing a format string with any number of parameters, in the same way as Console.WriteLine. TraceInformation does nothing more than invoke TraceEvent with an identifier of 0. TraceInformation is just a simplified version of TraceEvent. With the TraceData method, you can pass any object — for example, an exception instance — instead of a message.
To ensure that data is written by the listeners and does not stay in memory, you need to do a Flush. If the source is no longer needed, you can invoke the Close method, which closes all listeners associated with the trace source. Close does a Flush as well (code file TracingDemo/Program.cs).
    public class Program
    {
      internal static TraceSource trace =
          new TraceSource("Wrox.ProCSharp.Instrumentation");

      static void TraceSourceDemo1()
      {
        trace.TraceInformation("Info message");

        trace.TraceEvent(TraceEventType.Error, 3, "Error message");
        trace.TraceData(TraceEventType.Information, 2, "data1", 4, 5);
        trace.Close();
}The TraceEventType enumeration that is passed as an argument to the TraceEvent method defines the following levels to indicate the severity of the problem: Verbose, Information, Warning, Error, and Critical. Critical defines a fatal error or application crash; Error defines a recoverable error. Trace messages at the Verbose level provide detailed debugging information. TraceEventType also defines action levels Start, Stop, Suspend, and Resume, which define timely events inside a logical operation. As the code is written now, it does not display any trace message because the switch associated with the trace source is turned off.
Trace Switches
To enable or disable trace messages, you can configure a trace switch. Trace switches are classes derived from the abstract base class Switch. Derived classes are BooleanSwitch, TraceSwitch, and SourceSwitch. The class BooleanSwitch can be turned on and off, and the other two classes provide a range level. One range is defined by the SourceLevels enumeration. To configure trace switches, you must know the values associated with the SourceLevels enumeration. SourceLevels defines the values Off, Error, Warning, Info, and Verbose.
You can associate a trace switch programmatically by setting the Switch property of the TraceSource. In the following example, the associated switch is of type SourceSwitch, has the name Wrox.ProCSharp.Diagnostics, and has the level Verbose:
        internal static SourceSwitch traceSwitch =
            new SourceSwitch("Wrox.ProCSharp.Diagnostics")
            { Level = SourceLevels.Verbose };
        internal static TraceSource trace =
            new TraceSource("Wrox.ProCSharp.Diagnostics")
            { Switch = traceSwitch };
Setting the level to Verbose means that all trace messages should be written. If you set the value to Error, only error messages are displayed. Setting the value to Information means that error, warning, and info messages are shown. By writing the trace messages once more, you can see the messages while running the debugger in the Output window.
Usually, you would want to change the switch level not by recompiling the application, but instead by changing the configuration. The trace source can be configured in the application configuration file. Tracing is configured within the <system.diagnostics> element. The trace source is defined with the <source> element as a child element of <sources>. The name of the source in the configuration file must exactly match the name of the source in the program code. In the next example, the trace source has a switch of type System.Diagnostics.SourceSwitch associated with the name MySourceSwitch. The switch itself is defined within the <switches> section, and the level of the switch is set to verbose (config file TracingDemo/App.config):
<?xml version="1.0" encoding="utf-8" ?>
<configuration>
  <system.diagnostics>
    <sources>
      <source name="Wrox.ProCSharp.Diagnostics" switchName="MySourceSwitch"
          switchType="System.Diagnostics.SourceSwitch" />
    </sources>
    <switches>
      <add name="MySourceSwitch" value="Verbose"/>
    </switches>
  </system.diagnostics>
</configuration>
Now you can change the trace level just by changing the configuration file; there’s no need to recompile the code. After the configuration file is changed, you must restart the application.
Trace Listeners
By default, trace information is written to the Output window of the Visual Studio debugger; but by changing the application’s configuration, you can redirect the trace output to different locations.
Where the tracing results should be written to is defined by trace listeners. A trace listener is derived from the abstract base class TraceListener. NET includes several trace listeners to write the trace events to different targets. For file-based trace listeners, the base class TextWriterTraceListener is used, along with the derived classes XmlWriterTraceListener to write to XML files and DelimitedListTraceListener to write to delimited files. Writing to the event log is done with either the EventLogTraceListener or the EventProviderTraceListener. The latter uses the event file format available since Windows Vista. You can also combine web tracing with System.Diagnostics tracing and use the WebPageTraceListener to write System.Diagnostics tracing to the web trace file, trace.axd.
.NET Framework delivers many listeners to which trace information can be written; but if the provided listeners don’t fulfill your requirements, you can create a custom listener by deriving a class from the base class TraceListener. With a custom listener, you can, for example, write trace information to a web service, write messages to your mobile phone, and so on. It’s not usually desirable to receive hundreds of messages on your phone, however, and with verbose tracing this can become really expensive.
You can configure a trace listener programmatically by creating a listener object and assigning it to the Listeners property of the TraceSource class. However, usually it is more interesting to just change a configuration to define a different listener.
You can configure listeners as child elements of the <source> element. With the listener, you define the type of the listener class and use initializeData to specify where the output of the listener should go. The following configuration defines the XmlWriterTraceListener to write to the file demotrace.xml, and the DelimitedListTraceListener to write to the file demotrace.txt (config file TracingDemo/App.config):
<?xml version="1.0" encoding="utf-8" ?>
<configuration>
  <system.diagnostics>
    <sources>
      <source name="Wrox.ProCSharp.Diagnostics" switchName="MySourceSwitch"
          switchType="System.Diagnostics.SourceSwitch">
        <listeners>
          <add name="xmlListener"
              type="System.Diagnostics.XmlWriterTraceListener"
              traceOutputOptions="None"
              initializeData="c:/logs/mytrace.xml" />
          <add name="delimitedListener" delimiter=":"
              type="System.Diagnostics.DelimitedListTraceListener"
              traceOutputOptions="DateTime, ProcessId"
              initializeData="c:/logs/mytrace.txt" />
        </listeners>
      </source>
    </sources>
    <switches>
      <add name="MySourceSwitch" value="Verbose"/>
    </switches>
  </system.diagnostics>
</configuration>
With the listener, you can also specify what additional information should be written to the trace log. This information is specified with the traceOutputOptions XML attribute and is defined by the TraceOptions enumeration. The enumeration defines Callstack, DateTime, LogicalOperationStack, ProcessId, ThreadId, and None. You can add this comma-separated information to the traceOutputOptions XML attribute, as shown with the delimited trace listener.
The delimited file output from the DelimitedListTraceListener, including the process ID and date/time, is shown here:
"Wrox.ProCSharp.Diagnostics":Start:0:"Main started"::7724:""::
"2012-05-11T14:31:50.8677211Z"::
"Wrox.ProCSharp.Diagnostics":Information:0:"Info message"::7724:"Main"::
"2012-05-11T14:31:50.8797132Z"::
"Wrox.ProCSharp.Diagnostics":Error:3:"Error message"::7724:"Main"::
"2012-05-11T14:31:50.8817119Z"::
"Wrox.ProCSharp.Diagnostics":Information:2::"data1","4","5":7724:"Main"::
"2012-05-11T14:31:50.8817119Z"::
The XML output from the XmlWriterTraceListener always contains the name of the computer, the process ID, the thread ID, the message, the time created, the source, and the activity ID. Other fields, such as the call stack, logical operation stack, and timestamp, vary according to the trace output options.
If a listener should be used by multiple trace sources, you can add the listener configuration to the element <sharedListeners>, which is independent of the trace source. The name of the listener that is configured with a shared listener must be referenced from the listeners of the trace source:
<?xml version="1.0" encoding="utf-8" ?>
<configuration>
  <system.diagnostics>
    <sources>
      <source name="Wrox.ProCSharp.Diagnostics" switchName="MySourceSwitch"
          switchType="System.Diagnostics.SourceSwitch">
        <listeners>
          <add name="xmlListener"
              type="System.Diagnostics.XmlWriterTraceListener"
              traceOutputOptions="None"
              initializeData="c:/logs/mytrace.xml" />
          <add name="delimitedListener" />
        </listeners>
      </source>
    </sources>
    <sharedListeners>
      <add  name="delimitedListener" delimiter=":"
           type="System.Diagnostics.DelimitedListTraceListener"
           traceOutputOptions="DateTime, ProcessId"
           initializeData="c:/logs/mytrace.txt" />
    </sharedListeners>
    <switches>
      <add name="MySourceSwitch" value="Verbose"/>
    </switches>
  </system.diagnostics>
</configuration>
Filters
Every listener has a Filter property that defines whether the listener should write the trace message. For example, multiple listeners can be used with the same trace source. One of the listeners writes verbose messages to a log file, and another listener writes error messages to the event log. Before a listener writes a trace message, it invokes the ShouldTrace method of the associated filter object to determine whether the trace message should be written.
A filter is a class that is derived from the abstract base class TraceFilter. .NET offers two filter implementations: SourceFilter and EventTypeFilter. With the source filter, you can specify that trace messages are to be written only from specific sources. The event type filter is an extension of the switch functionality. With a switch, it is possible to define, according to the trace severity level, whether the event source should forward the trace message to the listeners. If the trace message is forwarded, then the listener can then use the filter to determine whether the message should be written.
The changed configuration now defines that the delimited listener should write trace messages only if the severity level is of type warning or higher, because of the defined EventTypeFilter. The XML listener specifies a SourceFilter and accepts trace messages only from the source Wrox.ProCSharp.Tracing. If you have a large number of sources defined to write trace messages to the same listener, you can change the configuration for the listener to concentrate on trace messages from a specific source.
<?xml version="1.0" encoding="utf-8" ?>
<configuration>
  <system.diagnostics>
    <sources>
      <source name="Wrox.ProCSharp.Tracing" switchName="MySourceSwitch"
          switchType="System.Diagnostics.SourceSwitch">
        <listeners>
          <add name="xmlListener" />
          <add name="delimitedListener" />
        </listeners>
      </source>
    </sources>
    <sharedListeners>
          <add name="delimitedListener" delimiter=":"
              type="System.Diagnostics.DelimitedListTraceListener"
              traceOutputOptions="DateTime, ProcessId"
              initializeData="c:/logs/mytrace.txt">
            <filter type="System.Diagnostics.EventTypeFilter"
                initializeData="Warning" />
          </add>
          <add name="xmlListener"
              type="System.Diagnostics.XmlWriterTraceListener"
              traceOutputOptions="None"
              initializeData="c:/logs/mytrace.xml">
            <filter type="System.Diagnostics.SourceFilter"
                initializeData="Wrox.ProCSharp.Diagnostics" />
          </add>
    </sharedListeners>
    <switches>
      <add name="MySourceSwitch" value="Verbose"/>
    </switches>
  </system.diagnostics>
</configuration>
The tracing architecture can be extended. Just as you can write a custom listener derived from the base class TraceListener, you can create a custom filter derived from TraceFilter. With that capability, you can create a filter that specifies writing trace messages depending, for example, on the time, on an exception that occurred lately, or on the weather.
Correlation
With trace logs, you can see the relationship of different methods in several ways. To see the call stack of the trace events, a configuration only needs to track the call stack with the XML listener. You can also define a logical call stack that can be shown in the log messages; and you can define activities to map trace messages.
To show the call stack and the logical call stack with the trace messages, the XmlWriterTraceListener can be configured to the corresponding traceOuputOptions. The MSDN documentation (http://msdn.microsoft.com/en-us/library/System.Diagnostics.XmlWriterTraceListener(v=vs.110).aspx ) provides details about all the other options you can configure for tracing with this listener.
    <sharedListeners>
      <add name="xmlListener" type="System.Diagnostics.XmlWriterTraceListener"
           traceOutputOptions="LogicalOperationStack, Callstack"
           initializeData="c:/logs/mytrace.xml">
      </add>
    </sharedListeners>
So you can see the correlation with trace logs, in the Main method a new activity ID is assigned to the CorrelationManager by setting the ActivityID property. Events of type TraceEventType.Start and TraceEventType.Stop are done at the beginning and end of the Main method. In addition, a logical operation named "Main" is started and stopped with the StartLogicalOperation and StopLogicalOperation methods:
    static void Main()
    {
      // start a new activity
      if (Trace.CorrelationManager.ActivityId == Guid.Empty)
      {
        Guid newGuid = Guid.NewGuid();
        Trace.CorrelationManager.ActivityId = newGuid;
      }
      trace.TraceEvent(TraceEventType.Start, 0, "Main started");

      // start a logical operation
      Trace.CorrelationManager.StartLogicalOperation("Main");

      TraceSourceDemo1();
      StartActivityA();
      Trace.CorrelationManager.StopLogicalOperation();
      Thread.Sleep(3000);
      trace.TraceEvent(TraceEventType.Stop, 0, "Main stopped");
    }
The method StartActivityA that is called from within the Main method creates a new activity by setting the ActivityId of the CorrelationManager to a new GUID. Before the activity stops, the ActivityId of the CorrelationManager is reset to the previous value. This method invokes the Foo method and creates a new task with the Task.Factory.StartNew method. This task is created so that you can see how different threads are displayed in a trace viewer.
    private static void StartActivityA()
    {
      Guid oldGuid = Trace.CorrelationManager.ActivityId;
      Guid newActivityId = Guid.NewGuid();
      Trace.CorrelationManager.ActivityId = newActivityId;

      Trace.CorrelationManager.StartLogicalOperation("StartActivityA");

      trace.TraceEvent(TraceEventType.Verbose, 0,
          "starting Foo in StartNewActivity");
      Foo();

      trace.TraceEvent(TraceEventType.Verbose, 0,
          "starting a new task");
      Task.Run(() => WorkForATask());

      Trace.CorrelationManager.StopLogicalOperation();
      Trace.CorrelationManager.ActivityId = oldGuid;
    }
The Foo method that is started from within the StartActivityA method starts a new logical operation. The logical operation Foo is started within the StartActivityA logical operation:
    private static void Foo()
    {
      Trace.CorrelationManager.StartLogicalOperation("Foo operation");

      trace.TraceEvent(TraceEventType.Verbose, 0, "running Foo");

      Trace.CorrelationManager.StopLogicalOperation();
    }
The task that is created from within the StartActivityA method runs the method WorkForATask. Here, only simple trace events with start and stop information, and verbose information, are written to the trace:
    private static void WorkForATask()
    {
      trace.TraceEvent(TraceEventType.Start, 0, "WorkForATask started");

      trace.TraceEvent(TraceEventType.Verbose, 0, "running WorkForATask");

      trace.TraceEvent(TraceEventType.Stop, 0, "WorkForATask completed");
    }
To analyze the trace information, the tool Service Trace Viewer, svctraceviewer.exe, can be started. This tool is mainly used to analyze WCF traces, but you can also use it to analyze any trace that is written with the XmlWriterTraceListener. Figure 20-3 shows the Activity tab of Service Trace Viewer, with each activity displayed on the left, and the events displayed on the right. When you select an event you can choose to display either the complete message in XML or a formatted view. The latter displays basic information, application data, the logical operation stack, and the call stack in a nicely formatted manner.
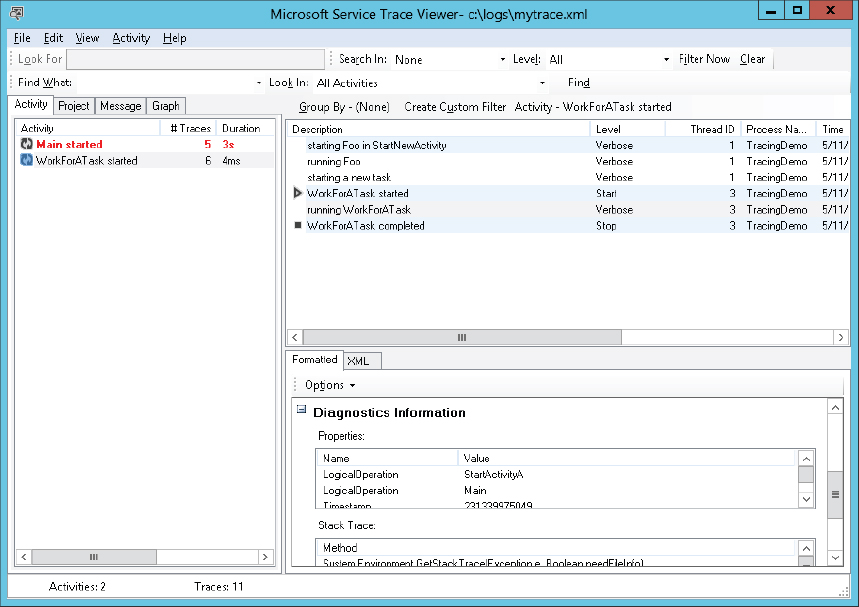
Figure 20-4 shows the Graph tab of the dialog. Using this view, different processes or threads can be selected for display in separate swimlanes. As a new thread is created with the Task class, a second swimlane appears by selecting the thread view.

Tracing with ETW
A fast way to do tracing is by using Event Tracing for Windows (ETW). ETW is used by Windows for tracing, event logging, and performance counts. To write traces with ETW, the EventProviderTraceListener can be configured as a listener, as shown in the following snippet. The type attribute is used to find the class dynamically. The class name is specified with the strong name of the assembly together with the class name. With the initializeData attribute, a GUID needs to be specified to uniquely identify your listener. You can create a GUID by using the command-line tool uuidgen or the graphical tool guidgen.
    <sharedListeners>
      <add name="etwListener"
           type="System.Diagnostics.Eventing.EventProviderTraceListener,
           System.Core, Version=4.0.0.0, Culture=neutral,
           PublicKeyToken=b77a5c561934e089"
           initializeData="{8ADA630A-F1CD-48BD-89F7-02CE2E7B9625}"/>
After changing the configuration, before you run the program once more to write traces using ETW, you need to start a trace session by using the logman command. The start option starts a new session to log. The -p option defines the name of the provider; here the GUID is used to identify the provider. The -o option defines the output file, and the -ets option sends the command directly to the event trace system without scheduling:
logman start mysession -p {8ADA630A-F1CD-48BD-89F7-02CE2E7B9625}
  -o mytrace.etl -ets
After running the application, the trace session can be stopped with the stop command:
logman stop mysession -etsThe log file is in a binary format. To get a readable representation, the utility tracerpt can be used. With this tool it’s possible to extract CSV, XML, and EVTX formats, as specified with the -of option:
tracerpt mytrace.etl -o mytrace.xml -of XMLEVENT LOGGING
System administrators use the Event Viewer to get critical messages about the health of the system and applications, and informational messages. You should write error messages from your application to the event log so that the information can be read with the Event Viewer.
Trace messages can be written to the event log if you configure the EventLogTraceListener class. The EventLogTraceListener has an EventLog object associated with it to write the event log entries. You can also use the EventLog class directly to write and read event logs.
In this section, you explore the following:
- Event-logging architecture
- Classes for event logging from the System.Diagnostics namespace
- Adding event logging to services and other application types
- Creating an event log listener with the EnableRaisingEvents property of the EventLog class
- Using a resource file to define messages
Figure 20-5 shows an example of a log entry resulting from a failed access with Distributed COM.

For custom event logging, you can use classes from the System.Diagnostics namespace.
Event-Logging Architecture
Event log information is stored in several log files. The most important ones are application, security, and system. Looking at the registry configuration of the event log service, you will notice several entries under HKEY_LOCAL_MACHINESystemCurrentControlSetServicesEventlog with configurations pointing to the specific files. The system log file is used from the system and device drivers. Applications and services write to the application log. The security log is a read-only log for applications. The auditing feature of the operating system uses the security log. Every application can also create a custom category and write event log entries there, such as Media Center.
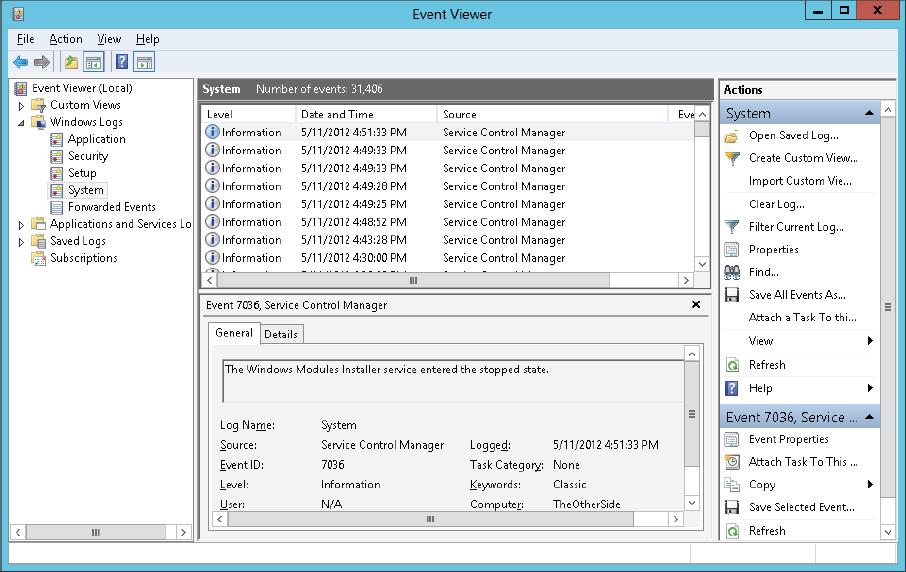
You can read these events by using the Event Viewer administrative tool. To open it directly from the Server Explorer of Visual Studio, right-click the Event Logs item and select the Launch Event Viewer entry from the context menu. The Event Viewer dialog is shown in Figure 20-6.
The event log contains the following information:
- Type — The main types are Information, Warning, or Error. Information is an infrequently used type that denotes a successful operation; Warning denotes a problem that is not immediately significant; and Error denotes a major problem. Additional types are FailureAudit and SuccessAudit, but these types are used only for the security log.
- Date — Date and Time show the day and time that the event occurred.
- Source — The Source is the name of the software that logs the event. The source for the application log is configured in the following registry key:
HKEY_LOCAL_MACHINESystemCurrentControlSetServicesEventlog
  Application[ApplicationName]
Within this key, the value EventMessageFile is configured to point to a resource DLL that holds error messages:
- Event ID — The event identifier specifies a particular event message.
- Category — A category can be defined so that event logs can be filtered when using the Event Viewer. Categories can be defined according to an event source.
Event-Logging Classes
For writing event logs, two different Windows APIs exist. One API, available since Windows Vista, is wrapped by the classes in the namespace System.Diagnostics.Eventing. The other wrapper classes are in the System.Diagnostics namespace.
The System.Diagnostics namespace has the following classes for event logging.
| CLASS | DESCRIPTION |
| EventLog | With the EventLog class, you can read and write entries in the event log, and establish applications as event sources. |
| EventLogEntry | The EventLogEntry class represents a single entry in the event log. With the EventLogEntryCollection, you can iterate through EventLogEntry items. |
| EventLogInstaller | The EventLogInstaller class is the installer for an EventLog component. EventLogInstaller calls EventLog.CreateEventSource to create an event source. |
| EventLogTraceListener | With the help of the EventLogTraceListener, traces can be written to the event log. This class implements the abstract class TraceListener. |
The heart of event logging is in the EventLog class. The members of this class are explained in the following table.
| EVENTLOG MEMBER | DESCRIPTION |
| Entries | With the Entries property, you can read event logs. Entries returns an EventLogEntryCollection that contains EventLogEntry objects holding information about the events. There is no need to invoke a Read method. The collection is filled as soon as you access this property. |
| Log | Specifies the log for reading or writing event logs. |
| LogDisplayName | A read-only property that returns the display name of the log. |
| MachineName | Specifies the system on which to read or write log entries. |
| Source | Specifies the source of the event entries to write. |
| CreateEventSource() | Creates a new event source and a new log file. |
| DeleteEventSource() | Invoke this to get rid of an event source. |
| SourceExists() | Using this element, you can verify whether the source already exists before creating an event source. |
| WriteEntry() WriteEvent() | Write event log entries with either the WriteEntry or WriteEvent method. WriteEntry is simpler, because you just need to pass a string. WriteEvent is more flexible, because you can use message files that are independent of the application and that support localization. |
| Clear() | Removes all entries from an event log. |
| Delete() | Deletes a complete event log. |
Creating an Event Source
Before writing events, you must create an event source. You can use either the CreateEventSource method of the EventLog class or the class EventLogInstaller. Because you need administrative privileges when creating an event source, an installation program is best for defining the new source.
The following example verifies that an event log source named EventLogDemoApp already exists. If it doesn’t exist, then an object of type EventSourceCreationData is instantiated that defines the source name EventLogDemoApp and the log name ProCSharpLog. Here, all events of this source are written to the ProCSharpLog event log. The default is the application log.
      string logName = "ProCSharpLog";
      string sourceName = "EventLogDemoApp";

      if (!EventLog.SourceExists(sourceName))
      {
        var eventSourceData = new EventSourceCreationData(sourceName, logName);

        EventLog.CreateEventSource(eventSourceData);
      }
The name of the event source is an identifier of the application that writes the events. For the system administrator reading the log, the information helps to identify the event log entries in order to map them to application categories. Examples of names for event log sources are LoadPerf for the Performance Monitor, MSSQLSERVER for Microsoft SQL Server, MsiInstaller for the Windows Installer, Winlogon, Tcpip, Time-Service, and so on.
Setting the name “Application” for the event log writes event log entries to the application log. You can also create your own log by specifying a different application log name. Log files are located in the directory <windows>System32WinEvtLogs.
With the EventSourceCreationData class, you can also specify several more characteristics for the event log, as described in the following table.
| EVENTSOURCECREATIONDATA | DESCRIPTION |
| Source | Gets or sets the name of the event source. |
| LogName | Defines the log where event log entries are written. The default is the application log. |
| MachineName | Defines the system to read or write log entries. |
| CategoryResourceFile | Defines a resource file for categories. Categories enable easier filtering of event log entries within a single source. |
| CategoryCount | Defines the number of categories in the category resource file. |
| MessageResourceFile | Instead of specifying that the message should be written to the event log in the program that writes the events, messages can be defined in a resource file that is assigned to the MessageResourceFile property. Messages from the resource file are localizable. |
| ParameterResourceFile | Messages in a resource file can have parameters. The parameters can be replaced by strings defined in a resource file that is assigned to the ParameterResourceFile property. |
Writing Event Logs
For writing event log entries, you can use the WriteEntry or WriteEvent methods of the EventLog class. The EventLog class has both a static and an instance method WriteEntry. The static method WriteEntry requires a parameter of the source. The source can also be set with the constructor of the EventLog class. In the following example, the log name, the local machine, and the event source name are defined in the constructor. Next, three event log entries are written with the message as the first parameter of the WriteEntry method. WriteEntry is overloaded. The second parameter you can assign is an enumeration of type EventLogEntryType. With EventLogEntryType, you can define the severity of the event log entry. Possible values are Information, Warning, and Error; and for auditing, SuccessAudit and FailureAudit. Depending on the type, different icons are shown in the Event Viewer. With the third parameter, you can specify an application-specific event ID that can be used by the application itself. In addition, you can pass application-specific binary data and a category.
         using (var log = new EventLog(logName, ".", sourceName))
         {
            log.WriteEntry("Message 1");
            log.WriteEntry("Message 2", EventLogEntryType.Warning);
            log.WriteEntry("Message 3", EventLogEntryType.Information, 33);
         }
Resource Files
Instead of defining the messages for the event log in the C# code and passing it to the WriteEntry method, you can create a message resource file, define messages in the resource file, and pass message identifiers to the WriteEvent method. Resource files also support localization.
; // EventLogDemoMessages.mc
; // ********************************************************

; //  —  Event categories -
; // Categories must be numbered consecutively starting at 1.
; // ********************************************************

MessageId=0x1
Severity=Success
SymbolicName=INSTALL_CATEGORY
Language=English
Installation
.

MessageId=0x2
Severity=Success
SymbolicName=DATA_CATEGORY
Language=English
Database Query
.

MessageId=0x3
Severity=Success
SymbolicName=UPDATE_CATEGORY
Language=English
Data Update
.

MessageId=0x4
Severity=Success
SymbolicName=NETWORK_CATEGORY
Language=English
Network Communication
.

; //  —  Event messages -
; // *********************************

MessageId = 1000
Severity = Success
Facility = Application
SymbolicName = MSG_CONNECT_1000
Language=English
Connection successful.
.

MessageId = 1001
Severity = Error
Facility = Application
SymbolicName = MSG_CONNECT_FAILED_1001
Language=English
Could not connect to server %1.
.

MessageId = 1002
Severity = Error
Facility = Application
SymbolicName = MSG_DB_UPDATE_1002
Language=English
Database update failed.
.

MessageId = 1003
Severity = Success
Facility = Application
SymbolicName = APP_UPDATE
Language=English
Application %%5002 updated.
.

; //  —  Event log display name -
; // ********************************************************

MessageId = 5001
Severity = Success
Facility = Application
SymbolicName = EVENT_LOG_DISPLAY_NAME_MSGID
Language=English
Professional C# Sample Event Log
.

; //  —  Event message parameters -
; //      Language independent insertion strings
; // ********************************************************


MessageId = 5002
Severity = Success
Facility = Application
SymbolicName = EVENT_LOG_SERVICE_NAME_MSGID
Language=English
EventLogDemo.EXE
.Use the Messages Compiler, mc.exe, to create a binary message file. The following command compiles the source file containing the messages to a messages file with the .bin extension and the file Messages.rc, which contains a reference to the binary message file:
mc -s EventLogDemoMessages.mcNext, you must use the Resource Compiler, rc.exe. The following command creates the resource file EventLogDemoMessages.RES:
rc EventLogDemoMessages.rcWith the linker, you can bind the binary message file EventLogDemoMessages.RES to a native DLL:
link /DLL /SUBSYSTEM:WINDOWS /NOENTRY /MACHINE:x86 EventLogDemoMessages.RESNow, you can register an event source that defines the resource files as shown in the following code. First, a check is done to determine whether the event source named EventLogDemoApp exists. If the event log must be created because it does not exist, the next check verifies that the resource file is available. Some samples in the MSDN documentation demonstrate writing the message file to the <windows>system32 directory, but you shouldn’t do that. Copy the message DLL to a program-specific directory that you can get with the SpecialFolder enumeration value ProgramFiles. If you need to share the messages file among multiple applications, you can put it into Environment.SpecialFolder.CommonProgramFiles.
If the file exists, a new object of type EventSourceCreationData is instantiated. In the constructor, the name of the source and the name of the log are defined. You use the properties CategoryResourceFile, MessageResourceFile, and ParameterResourceFile to define a reference to the resource file. After the event source is created, you can find the information on the resource files in the registry with the event source. The method CreateEventSource registers the new event source and log file. Finally, the method RegisterDisplayName from the EventLog class specifies the name of the log as it is displayed in the Event Viewer. The ID 5001 is taken from the message file (code file EventLogDemo/Program.cs):
         string logName = "ProCSharpLog";
         string sourceName = "EventLogDemoApp";
         string resourceFile = Environment.GetFolderPath(
               Environment.SpecialFolder.ProgramFiles) +
               @"procsharpEventLogDemoMessages.dll";

         if (!EventLog.SourceExists(sourceName))
         {
            if (!File.Exists(resourceFile))
            {
               Console.WriteLine("Message resource file does not exist");
               return;
            }

            var eventSource = new EventSourceCreationData(sourceName, logName);

            eventSource.CategoryResourceFile = resourceFile;
            eventSource.CategoryCount = 4;
            eventSource.MessageResourceFile = resourceFile;
            eventSource.ParameterResourceFile = resourceFile;

            EventLog.CreateEventSource(eventSource);
         }
         else
         {
            logName = EventLog.LogNameFromSourceName(sourceName, ".");
         }

         var evLog = new EventLog(logName, ".", sourceName);
evLog.RegisterDisplayName(resourceFile, 5001);Now you can use the WriteEvent method instead of WriteEntry to write the event log entry. WriteEvent requires an object of type EventInstance as a parameter. With the EventInstance, you can assign the message ID, the category, and the severity of type EventLogEntryType. In addition to the EventInstance parameter, WriteEvent accepts parameters for messages that have parameters and binary data in the form of a byte array:
         using (var log = new EventLog(logName, ".", sourceName))
         {
             var info1 = new EventInstance(1000, 4,
                 EventLogEntryType.Information);

             log.WriteEvent(info1);
             var info2 = new EventInstance(1001, 4,
                 EventLogEntryType.Error);
             log.WriteEvent(info2, "avalon");

             var info3 = new EventInstance(1002, 3,
                 EventLogEntryType.Error);
             byte[] additionalInfo = { 1, 2, 3 };
             log.WriteEvent(info3, additionalInfo);
         }
You can read the event log entries with the Event Viewer.
PERFORMANCE MONITORING
Performance monitoring can be used to get information about the normal behavior of applications, to compare ongoing system behavior with previously established norms, and to observe changes and trends, particularly in applications running on the server. When you have a scenario of more and more users accessing the application, before the first user complains about a performance issue, the system administrator can already act and increase resources where needed. The Performance Monitor (PerfMon) is a great tool to see all the performance counts for acting early. As a developer, this tool also helps a lot to understand the running application and its foundation technologies.
Microsoft Windows has many performance objects, such as System, Memory, Objects, Process, Processor, Thread, Cache, and so on. Each of these objects has many counts to monitor. For example, with the Process object, the user time, handle count, page faults, thread count, and so on can be monitored for all processes or for specific process instances. The .NET Framework and several applications, such as SQL Server, also add application-specific objects.
Performance-Monitoring Classes
The System.Diagnostics namespace provides the following classes for performance monitoring:
- PerformanceCounter — Can be used both to monitor counts and to write counts. New performance categories can also be created with this class.
- PerformanceCounterCategory — Enables you to step through all existing categories, as well as create new ones. You can programmatically obtain all the counters in a category.
- PerformanceCounterInstaller — Used for the installation of performance counters. Its use is similar to that of the EventLogInstaller discussed previously.
Performance Counter Builder
The sample application PerformanceCounterDemo is a simple Windows application with just two buttons to demonstrate writing performance counts. The handler of one button registers a performance counter category; the handler of the other button writes a performance counter value. In a similar way to the sample application, you can add performance counters to a Windows Service (see Chapter 27, “Windows Services”), to a network application (see Chapter 26, “Networking”), or to any other application from which you would like to receive live counts.
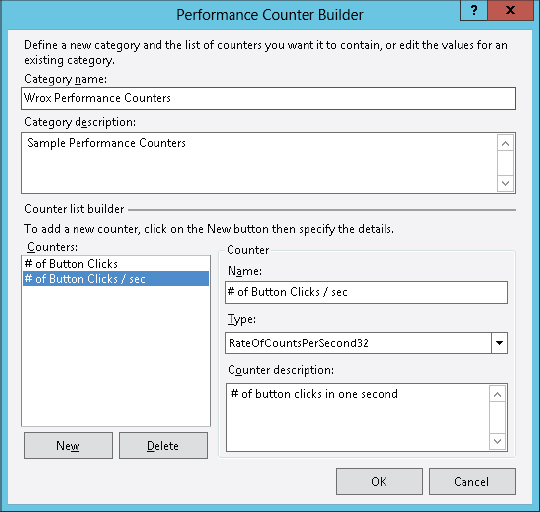
Using Visual Studio, you can create a new performance counter category by selecting Performance Counters in Server Explorer and then selecting Create New Category from the context menu. This launches the Performance Counter Builder (see Figure 20-7). Set the name of the performance counter category to Wrox Performance Counters. The following table shows all performance counters of the sample application.
| PERFORMANCE COUNTER | DESCRIPTION | TYPE |
| # of button clicks | Total # of button clicks | NumberOfItems32 |
| # of button clicks/sec | # of button clicks per second | RateOfCountsPerSecond32 |
| # of mouse move events | Total # of mouse move events | NumberOfItems32 |
| # of mouse move events/sec | # of mouse move events per second | RateOfCountsPerSecond32 |
Performance Counter Builder writes the configuration to the performance database. This can also be done dynamically by using the Create method of the PerformanceCounterCategory class in the System.Diagnostics namespace. An installer for other systems can easily be added later using Visual Studio.
The following code snippet shows how a performance category can be added programmatically. With the tool from Visual Studio, you can only create a global performance category that doesn’t have different values for different processes of running applications. Creating a performance category programmatically enables you to monitor performance counts from different applications, which is done here.
First, a const for the category name is defined, as well as SortedList<TKey, TValue>, which contains the names of the performance counts (code file PerformanceCounterDemo/MainWindow.xaml.cs):
    private const string perfomanceCounterCategoryName =
        "Wrox Performance Counters";
    private SortedList<string, Tuple<string, string>> perfCountNames;
The list of the perfCountNames variable is filled in within the method InitializePerformanceCountNames. The value of the sorted list is defined as Tuple<string, string> to define both the name and the description of the performance counter:
    private void InitializePerfomanceCountNames()
    {
      perfCountNames = new SortedList<string, Tuple<string, string>>();
      perfCountNames.Add("clickCount", Tuple.Create("# of button Clicks",
          "Total # of button clicks"));
      perfCountNames.Add("clickSec", Tuple.Create("# of button clicks/sec",
          "# of mouse button clicks in one second"));
      perfCountNames.Add("mouseCount", Tuple.Create("# of mouse move events",
          "Total # of mouse move events"));
      perfCountNames.Add("mouseSec", Tuple.Create("# of mouse move events/sec",
          "# of mouse move events in one second"));
    }
The performance counter category is created next, in the method OnRegisterCounts. After a check to verify that the category does not already exist, the array CounterCreationData is created, which is filled with the types and names of the performance counts. Next, PerformanceCounterCategory.Create creates the new category. PerformanceCounterCategoryType.MultiInstance defines that the counts are not global, but rather that different values for different instances can exist:
    private void OnRegisterCounts(object sender, RoutedEventArgs e)
    {
      if (!PerformanceCounterCategory.Exists(
          perfomanceCounterCategoryName))
      {
        var counterCreationData = new CounterCreationData[4];
        counterCreationData[0] = new CounterCreationData
        {
          CounterName = perfCountNames["clickCount"].Item1,
          CounterType = PerformanceCounterType.NumberOfItems32,
          CounterHelp = perfCountNames["clickCount"].Item2
        };
        counterCreationData[1] = new CounterCreationData
        {
          CounterName = perfCountNames["clickSec"].Item1,
          CounterType = PerformanceCounterType.RateOfCountsPerSecond32,
          CounterHelp = perfCountNames["clickSec"].Item2,
        };
        counterCreationData[2] = new CounterCreationData
        {
          CounterName = perfCountNames["mouseCount"].Item1,
          CounterType = PerformanceCounterType.NumberOfItems32,
          CounterHelp = perfCountNames["mouseCount"].Item2,
        };
        counterCreationData[3] = new CounterCreationData
        {
          CounterName = perfCountNames["mouseSec"].Item1,
          CounterType = PerformanceCounterType.RateOfCountsPerSecond32,
          CounterHelp = perfCountNames["mouseSec"].Item2,
        };
        var counters = new CounterCreationDataCollection(counterCreationData);

        var category = PerformanceCounterCategory.Create(
            perfomanceCounterCategoryName,
            "Sample Counters for Professional C#",
            PerformanceCounterCategoryType.MultiInstance,
            counters);

        MessageBox.Show(String.Format("category {0} successfully created",
            category.CategoryName));
      }
Adding PerformanceCounter Components
With Windows Forms or Windows Service applications, you can add PerformanceCounter components from the toolbox or from Server Explorer by dragging and dropping to the designer surface.
With WPF applications that’s not possible. However, it’s not a lot of work to define the performance counters manually, as this is done with the method InitializePerformanceCounters. In the following example, the CategoryName for all performance counts is set from the const string performanceCounterCategoryName; the CounterName is set from the sorted list. Because the application writes performance counts, the ReadOnly property must be set to false. When writing an application that only reads performance counts for display purposes, you can use the default value of the ReadOnly property, which is true. The InstanceName of the PerformanceCounter object is set to an application name. If the counters are configured to be global counts, then InstanceName may not be set:
    private PerformanceCounter performanceCounterButtonClicks;
    private PerformanceCounter performanceCounterButtonClicksPerSec;
    private PerformanceCounter performanceCounterMouseMoveEvents;
    private PerformanceCounter performanceCounterMouseMoveEventsPerSec;

    private void InitializePerformanceCounters()
    {
      performanceCounterButtonClicks = new PerformanceCounter
      {
        CategoryName = perfomanceCounterCategoryName,
        CounterName = perfCountNames["clickCount"].Item1,
        ReadOnly = false,
        MachineName = ".",
        InstanceLifetime = PerformanceCounterInstanceLifetime.Process,
        InstanceName = this.instanceName
      };
      performanceCounterButtonClicksPerSec = new PerformanceCounter
      {
        CategoryName = perfomanceCounterCategoryName,
        CounterName = perfCountNames["clickSec"].Item1,
        ReadOnly = false,
        MachineName = ".",
        InstanceLifetime = PerformanceCounterInstanceLifetime.Process,
        InstanceName = this.instanceName
      };
      performanceCounterMouseMoveEvents = new PerformanceCounter
      {
        CategoryName = perfomanceCounterCategoryName,
        CounterName = perfCountNames["mouseCount"].Item1,
        ReadOnly = false,
        MachineName = ".",
        InstanceLifetime = PerformanceCounterInstanceLifetime.Process,
        InstanceName = this.instanceName
      };
      performanceCounterMouseMoveEventsPerSec = new PerformanceCounter
      {
        CategoryName = perfomanceCounterCategoryName,
        CounterName = perfCountNames["mouseSec"].Item1,
        ReadOnly = false,
        MachineName = ".",
        InstanceLifetime = PerformanceCounterInstanceLifetime.Process,
        InstanceName = this.instanceName
      };
    }
To calculate the performance values, you need to add the fields clickCountPerSec and mouseMoveCountPerSec:
  public partial class MainWindow : Window
  {
    // Performance monitoring counter values
    private int clickCountPerSec = 0;
    private int mouseMoveCountPerSec = 0;
Add an event handler to the Click event of the button, add an event handler to the MouseMove event of the button, and add the following code to the handlers:
    private void OnButtonClick(object sender, RoutedEventArgs e)
    {
      this.performanceCounterButtonClicks.Increment();
      this.clickCountPerSeC++;
    }

    private void OnMouseMove(object sender, MouseEventArgs e)
    {
      this.performanceCounterMouseMoveEvents.Increment();
      this.mouseMoveCountPerSeC++;
    }
The Increment method of the PerformanceCounter object increments the counter by one. If you need to increment the counter by more than one — for example, to add information about a byte count sent or received — you can use the IncrementBy method. For the performance counts that show the value in seconds, just the two variables, clickCountPerSec and mouseMovePerSec, are incremented.
To show updated values every second, add a DispatcherTimer to the members of the MainWindow:
private DispatcherTimer timer;This timer is configured and started in the constructor. The DispatcherTimer class is a timer from the namespace System.Windows.Threading. For other than WPF applications, you can use other timers as discussed in Chapter 21, “Threads, Tasks, and Synchronization.” The code that is invoked by the timer is defined with an anonymous method:
    public MainWindow()
    {
      InitializeComponent();
      InitializePerfomanceCountNames();
      InitializePerformanceCounts();
      if (PerformanceCounterCategory.Exists(perfomanceCounterCategoryName))
      {
        buttonCount.IsEnabled = true;
        timer = new DispatcherTimer(TimeSpan.FromSeconds(1),
            DispatcherPriority.Background,
            delegate
            {
              this.performanceCounterButtonClicksPerSec.RawValue =
                  this.clickCountPerSec;
              this.clickCountPerSec = 0;
              this.performanceCounterMouseMoveEventsPerSec.RawValue =
                  this.mouseMoveCountPerSec;
                  this.mouseMoveCountPerSec = 0;
            },
            Dispatcher.CurrentDispatcher);
        timer.Start();
      }
    }
perfmon.exe
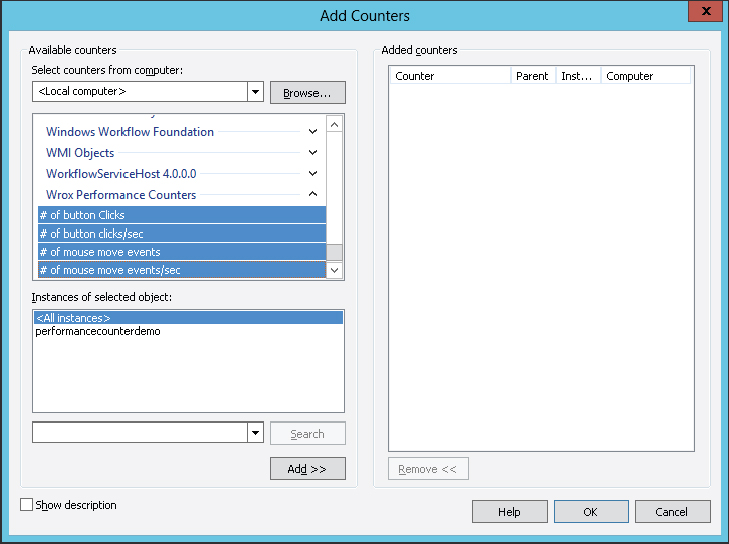
Now you can monitor the application. You can start Performance Monitor from the Administrative Tools applet in the control panel. Within Performance Monitor, click the + button in the toolbar; there, you can add performance counts. Wrox Performance Counters shows up as a performance object. All the counters that have been configured appear in the Available counters list, as shown in Figure 20-8.
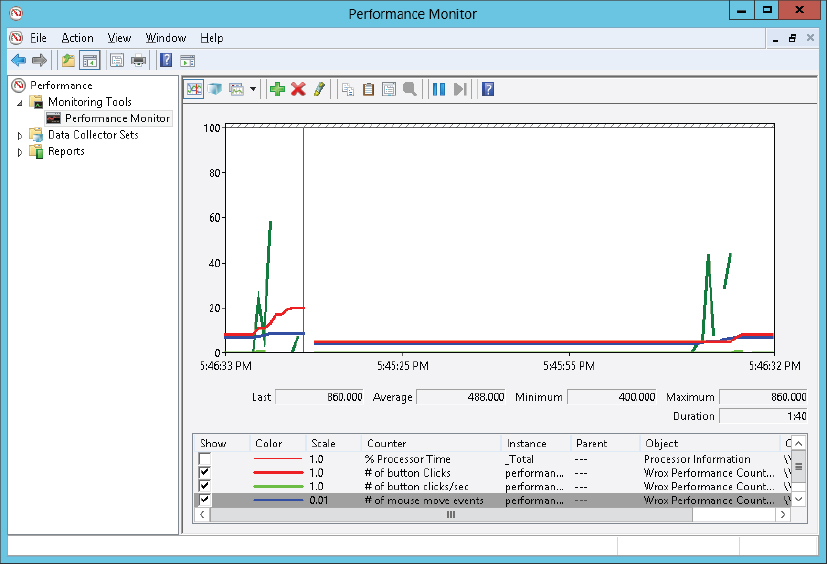
After you have added the counters to the performance monitor, you can view the actual values of the service over time (see Figure 20-9). Using this performance tool, you can also create log files to analyze the performance data later.
SUMMARY
In this chapter, you have looked at tracing and logging facilities that can help you find intermittent problems in your applications. You should plan early, building these features into your applications, as this will help you avoid many troubleshooting problems later.
With tracing, you can write debugging messages to an application that can also be used for the final product delivered. If there are problems, you can turn tracing on by changing configuration values, and find the issues.
Event logging provides the system administrator with information that can help identify some of the critical issues with the application. Performance monitoring helps in analyzing the load from applications and enables proactive planning for resources that might be required.