
CHAPTER EIGHT
Design Creative Alternatives
Alternatives are the raw material of decision making. They represent the range of potential choices you have for pursuing your objectives. Because of the their central importance, you need to establish and maintain a high standard for generating alternatives
—Hammond et al. (1999)
Nothing is more dangerous than an idea when it is the only one you have
—Emile Chartier, French philosopher
8.1 Introduction
Identifying a good set of alternatives is an important part of decision making. In most decision situations, it is quite easy to identify an initial set of alternatives. Should we close the factory or invest in upgrading its technology? Should we proceed with development of Product A or Product B or both?
The challenge for any decision practitioner is to help the client push beyond the initial set of alternatives and to lead a search for additional, possibly much better, alternatives. This is an opportunity to create great value. Doing an excellent job of analyzing an existing set of alternatives cannot create more value than that of the best alternative in the set. But taking the time and effort to search diligently for new alternatives might develop an alternative that has much greater value than any in the initial set. This has been our experience as decision analysts.
There are several excellent references for creating good alternatives. Keller and Ho (Keller & Ho, 1988) identified five categories of alternative generation techniques including attribute-based, state-based, composite, option-based, and creativity techniques. Keeney has authored two books (Keeney, 1992; Hammond et al., 1999) that include chapters on generating alternatives, including one titled “How to Make Smarter Choices by Creating Better Alternatives.” The textbook by Clemen and Reilly (Clemen & Reilly, 2001) includes a chapter titled “Creativity and Decision Making.”
This chapter is organized as follows. In Section 8.2, we identify the characteristics of a good set of alternatives. In Section 8.3, we discuss the obstacles to creating a good set of alternatives. Next, we discuss the two phases of generating a good set of alternatives—the expansive phase in Section 8.4 and the reductive phase in Section 8.5. In Section 8.6, we discuss suggestions for improving the alternative set. In Section 8.7, we discuss alternative generation for our illustrative examples.
8.2 Characteristics of a Good Set of Alternatives
The decision analyst’s goal is to create a small set of alternatives that are feasible, complete, compelling, and diverse.
8.3 Obstacles to Creating a Good Set of Alternatives
Conceptually, an alternative is easy to create. It is just a matter of laying out a clear plan of action. But creating a good set of alternatives can be difficult. Alternatives are created in the minds of people. and it is well established that our human minds are subject to a number of cognitive biases (see Chapter 2) that can interfere with the process of creating alternatives (as well as with assessing probability ranges for uncertainties).
For example, the cognitive bias called “anchoring” refers to the strong tendency for a person’s judgments to be influenced by an existing thought. This bias can make it difficult for someone to think of an alternative that differs radically from one already in his mind. And the bias called “availability” refers to the fact that thoughts that are easily recalled tend to overshadow those that are more difficult to recall. This bias can make it difficult for someone to go beyond the most obvious and prominent alternatives, being swayed too strongly by recent successes, for example, compared with earlier failures.
Another bias that can interfere with creating good alternatives is called the “comfort zone bias.” This bias refers to the tendency for people to be more willing to contemplate actions that are familiar rather than those that are unfamiliar. So, an alternative that would require actions for which the person feels ill-prepared or unskilled would tend to be overlooked, even if that alternative might offer great value.
Motivational bias can also limit the number of alternatives. Some individuals like to provide only one alternative, the one they recommend. Other individuals like to provide three alternatives to decision makers: one that has obviously low value, one that has significant value but is unaffordable, and an affordable alternative that is being recommended. We do not advocate such approaches.
James Adams posits a series of conceptual blocks that he defines as “mental walls that block the problem-solver from correctly perceiving a problem or conceiving its solution” (Adams, 1974). These blocks as adapted from Adams can be summarized as follows:
- Stereotyping—seeing what you expect to see.
- Difficulty in isolating the problem—solving the wrong problem.
- Delimiting the problem too closely—imposing too many constraints upon the problem and its solutions.
- Inability to examine the problem from multiple perspectives.
- Saturation—inability to perceive and retain all the information around us.
- Failure to use all of our senses—we should not neglect any sensory inputs.
- Fear of taking a risk—we tend to be afraid of making a mistake or failing.
- No appetite for chaos—we struggle to deal with ambiguity and uncertainty.
- Judging rather than generating ideas—we tend to judge and analyze too early in the decision-making process.
- Inability to incubate—failing to give ideas time to mature before eliminating them prematurely.
- Lack of challenge or excessive zeal—lack of motivation will inhibit creativity as will excessive motivation to succeed quickly.
- Reality and fantasy—ignoring one of these critical resources to creativity in problem solving.
- Taboos—we eliminate alternatives too quickly in our thought process because they seem culturally incorrect.
- Lack of humor in problem solving—we may take problem solving too seriously and leave no room for humor, which can be inspiring.
- Reason and intuition—many decision analysts tend to think that reason, logic, and numbers are good, while feeling intuition, and qualitative assessments are bad; both are essential for creativity.
- Left-handed and right-handed thinking—we tend to favor one side of the brain over the other; both sides are essential for creativity—left side (right hand, primary creativity) for order, reason, logic and mathematics, right side (left hand, secondary creativity) for imagination, artistry, and intuition.
- Tradition and change—it is hard to overcome the inertia of tradition that can impede the ability to see the need for change in developing alternatives.
- Supportive versus nonsupportive environments—physical, economic, and organizational support are often needed to bring ideas into action.
- Autocratic bosses—may make it difficult to push new ideas through.
- Choosing the “correct” problem solving language—we need the ability to go from one problem solving language to another to include analytical/mathematical, visual/special, analogy, and so on; some work for one problem, but not for others.
- Flexibility versus fluency—we need both, flexibility to generate many alternatives that may be similar, fluency to generate alternatives that are different in nature.
- Incorrect information—lack of, or bad, information expands rapidly and makes problem solving difficult; this ties in closely with “value of information” concepts of decision analysis.
- Inadequate language skills and imprecision in verbal expression—poor communication inhibits “selling” good alternatives to others.
8.4 The Expansive Phase of Creating Alternatives
The process of generating a good set of alternatives has two phases, the first expansive (or divergent), and the second reductive (or convergent).
The goal of the expansive phase is to generate as many ideas as possible that might lead to the definition of creative alternatives. In this phase, divergent and creative thinking comes to the fore and analytic thinking takes a back seat. Typically, this phase consists of one or more facilitated “brainstorming” sessions ideally involving participants having a wide range of perspectives on the situation.
The rules of brainstorming should be strictly enforced in these sessions. Dare to think “crazy” and “wild” ideas. Build on ideas already contributed. Do not criticize any idea. A good brainstorming session will generate a large collection of ideas.
A variety of facilitation techniques (see Chapter 4) can be used in these sessions to stimulate creative thinking and to help people break through the mental barriers that constrain them. One is to have participants make a list of challenges. A challenge is a statement that begins, “We would achieve great success if only we could. … ” The list of challenges can then be used to stimulate thinking about actions that would overcome them. These actions may form the basis of good alternatives. For example, consider a company trying to decide how to expand into an overseas market. They might make the following challenge statement: “We would be in great shape if only we did not have to invest so much in a distribution network there.” That challenge statement might stimulate creative thinking about new alternatives in which the company could sell in the foreign country without having its own distribution system there.
Another facilitation technique is to have participants imagine how various other parties would respond to the situation at hand. For example, if a struggling industrial company is trying to find a new business strategy, one might ask participants to answer questions, such as these: “What would Microsoft do if it owned this business?” “How would Procter and Gamble act in this situation?” “How would Samsung run this business?” The idea of this facilitation technique is to have participants consider how companies that are successful in other industries would respond to the situation at hand. It is also often useful to have participants consider how actual or potential competitors would act in the situation
A third facilitation technique is called “backcasting” (or “crystal ball”). In this technique, participants are asked to imagine that they are transported via a time machine 5 or 10 years into the future (or that they look that far into the future via an infallible crystal ball). There, they learn that the decision they are considering has had a highly successful outcome and they are asked to state reasons why that success had occurred. The exercise is then repeated except that this time they learn that the outcome was very bad. This exercise is designed to help participants change their perspective on the situation by looking back at it from the future. The ideas generated in this exercise may form the basis of good alternatives.
A fourth facilitation technique makes use of scenarios. A scenario is a brief description of the future state of the world. An example of a scenario might be “very high energy costs, stagnant world economy.” An alternative-generating exercise based on scenarios would be to pose a number of widely divergent scenarios and have participants describe courses of action that would be successful within each scenario. A good alternative might then be created by combining actions that seem to be robust across a range of the scenarios. Scenario analysis, combined with value-focused thinking, was used extensively in the Air Force 2025 (Parnell et al., 1998) and Blue Horizons (Geis et al., 2011) studies.
A fifth facilitation technique is to refer to the means–objectives at the bottom of the objective hierarchy, if one was constructed (see Chapter 7). These can often suggest doable constructive alternatives. Keeney (Keeney, 1992) provides example of means–ends networks.
8.5 The Reductive Phase of Creating Alternatives
The goal of the reductive phase is to take the large number of ideas generated in the expansive phase and winnow down (converge) to a small number of well-crafted alternatives for evaluation. Unlike the previous phase, this one calls for highly organized, analytic thinking.
A good way to start the reductive phase is to categorize the many ideas and group them by similarity. Then, create one or more alternative “themes” to represent the ideas in each group. A theme is a short expression of the key idea of the alternative. For examples, the alternative themes might include the following: “Lower costs,” “Increase share of market,” and “Improve customer service.”
Sometimes, it is useful to prioritize the themes via voting among the participants to focus attention on just a handful. However, care must be taken not to prematurely exclude from consideration “wild” ideas that may lead to potentially valuable alternatives. Keep in mind that the overall goal is to generate a set of alternatives that have the potential to create value and are significantly different from each other.
A very useful conceptual tool to use in the reductive phase is called a “strategy table” (Howard, 1988). A strategy table contains a number of columns, each of which represents a particular choice that is part of the overall decision.3 Figure 8.1 shows an example strategy table that describes a new product development decision. The four columns represent the components of the decision: (1) Which technology to employ in the product, (2) the timetable for development, (3) the target geographic markets for the product, and (4) whether or not to seek a development partner. Within each column are listed the possible options for that choice. Technically, these options should be defined so that for every alternative, there is one and only one option selected in each column. However, it may be permissible to allow overlapping options in a column if doing so will spur clear creative thinking about alternatives. The first column in the example strategy table in Figure 8.1 shows a choice of three options for product technology: current, in-licensed, or experimental technology.
FIGURE 8.1 Example strategy table.

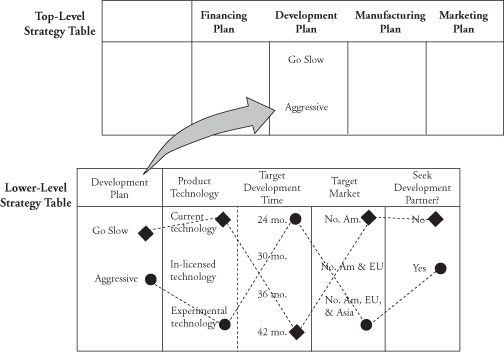
Once all of the columns are structured, an alternative is defined by selecting one option in each column. Figure 8.2 shows the example strategy table with two alternatives defined, “Go Slow” and “Aggressive.”
FIGURE 8.2 Defining two alternatives in a strategy table.

As alternatives are defined in the strategy table, it may be necessary to add new columns or to add options within existing columns to accommodate new alternatives. The strategy table can help refine the set of alternatives to be evaluated. For example, if two alternatives share the same option in almost every column, they might be deemed as being too similar and merged into one alternative. Or, if an option in a column is not selected by any of the alternatives, it might be possible to create an interesting new alternative starting with that option.
It is useful to note that while the strategy table is a useful tool for generating alternatives, it can pose difficulties in communicating alternatives to decision makers and stakeholders. A better tool for communication is a simple matrix in which each row represents an alternative, and the options defining that alternative can be read by scanning across the matrix columns for that row. Table 8.1 displays the information in Figure 8.2 using this matrix format.
TABLE 8.1 Strategy Table in Matrix Format

For some, it is helpful to think of a strategy table as a control panel of levers. Each column in the table is a control lever that can be set in any of a number of pre-defined positions (the options). A complete alternative is then defined by a specific combination of settings of all levers on the panel.
For complex decisions, it may be helpful to use nested strategy tables, in which a lower-level strategy table defines a column in the top-level strategy table. Figure 8.3 illustrates an example of nested strategy tables. In this example, the top-level strategy table defines an overall business strategy decision. One of the columns of the top-level strategy table is the choice of product development plan, which is defined by the lower-level strategy table that we have seen in Figure 8.2. The options in the column of the top-level strategy table are the decision alternatives defined in the lower-level table. The use of nested strategy tables enables a natural delegation of responsibilities because a separate subteam can develop each lower-level table. It also makes the top-level strategy table more concise, which facilitates the conversation about high-level alternatives.
FIGURE 8.3 Nested strategy tables.
It is good practice to check that the model that is used to evaluate the alternatives is consistent with the strategy table. That is, the calculations of the model should be responsive to a change of option in every column of the strategy table. If not, the column may not be necessary or the model may need to be changed.
In situations in which “downstream” decisions (i.e., decisions that will be made in the future after some current uncertainty is resolved) are important, it may be useful to employ a decision tree structure to think about and to communicate clearly the sequential nature of alternatives. See Section 11.2.1 for a discussion of decision trees.
8.6 Improving the Set of Alternatives
The set of alternatives can often be further improved after they are evaluated. The results of the analysis that is conducted to compare the alternatives can many times provide insights on how to create even better alternatives. This idea is presented briefly here and discussed in more detail in Chapter 11.
One common technique for finding better alternatives is to look at the sources of value in each of the original alternatives. How much of the overall value is coming from each market segment, or product line, or geographic region? With this information, it may be possible to design a new alternative that emphasizes high-value features and de-emphasizes low-value features. Such an alternative is called a “hybrid” because it combines the good features of several of the original alternatives.
Another technique is to examine the top bars in the tornado diagram (see Chapter 9) for each alternative and to ask the question, “Is there any way that we can make it more likely that this important value driver turns out in our favor?” For example, consider a new product introduction decision situation. Imagine that the top bar in the tornado diagram for one alternative is the time to market given the planned budget—the sooner the new product is launched, the greater the value. Seeing this, we might ask if the launch timing could be accelerated by increasing the development budget. If so, we could redesign the alternative to achieve greater value with a higher budget.
A third way to improve alternatives after evaluation is to examine the value of perfect information (see Chapter 11) on key uncertainties. It might be possible to design a new alternative that exploits high value of information. For example, a new alternative that includes a period of initial information-gathering or experimentation could be created. Or an alternative that includes built-in flexibility, such as a real-option, might be quite valuable. A real option is not a derivative financial instrument, but an actual future option that a business may enable by making a decision now. For example, by investing in R&D, the company creates future options for current and future projects.
It is important to remember that the time to search for good hybrid alternatives is after the evaluation of the original alternatives has been completed (see Chapters 9 and 11).
8.7 Illustrative Examples
See Table 1.3 for further information on the illustrative examples. The strategy generation table was useful in all three examples, but it was displayed using three different formats.
8.7.1 ROUGHNECK NORTH AMERICAN STRATEGY (by Eric R. Johnson)
As discussed in Chapter 6, the project was reframed as a portfolio resource allocation problem among five business areas: conventional E&P, coalbed methane, enhanced oil recovery, tar sands, and electric power generation. All North American opportunities were to be considered, including acquisition or divestiture of assets. The project team set up a strategy table whose five columns corresponded to the five business areas. They defined four levels of investment for each business area, and elicited from the functional experts what would be an approach to each business area consistent with each of the four levels of investment. The four levels of investment were named divest, maintain, growth, and leader (i.e., nonorganic growth by acquisition). These strategies are shown in the first four rows of Figure 8.4.
FIGURE 8.4 RNAS strategy table.
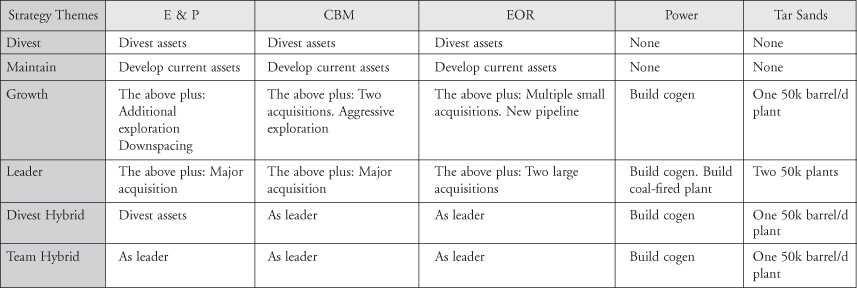
In order to ensure that all good ideas found a home in the strategy table, they defined strategies in which a given level of investment was deployed across all business areas. By doing so, they were not suggesting that anyone in Roughneck leadership intended to fully divest North American assets, or make a string of large acquisitions in each of the business areas. By defining these as “strategies,” they required only that the strategies be taken seriously enough to define a coherent point of view that could be evaluated in reasonable fashion. The project team had every expectation that an intermediate course of action would be chosen, but they knew that choice of an optimal hybrid strategy would be better done once they had completed and reviewed the initial evaluation phase.
After reviewing initial evaluation results, the team formulated two hybrid strategies, which are shown in the last two rows of Figure 8.4.
8.7.2 GENEPTIN PERSONALIZED MEDICINE (by Sean Xinghua Hu)
The situation with Geneptin was relatively simple, and the number of strategic alternatives was few, with the primary decision elements being whether to employ a biomarker, which diagnostic platform to use, and how to incorporate the biomarker into Phase III trial design. The Geneptin team generated two main strategic alternatives to advance into further analysis: all comers and a prospective HER2-overexpression biomarker-stratified personalized medicine approach. Figure 8.5 shows the Geneptin strategy table.
FIGURE 8.5 Geneptin strategy table.
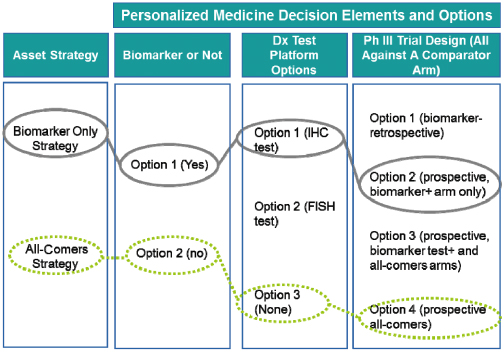
IHC (immunohistochemistry) and FISH (fluorescence in situ hybridization) were two possible technologies for diagnostics tests. In addition to the prospective use of the biomarker to identify patients to be included in the trial, options could be considered to include an all comers arm (a trial patient “arm” is a group of patients who receive the same treatment during a clinical trial. A clinical trial can have one or more “arms.” When there is more than one arm, the trial could be designed to be “double blinded,” in which neither the physicians nor the patients know during the trial which patient is receiving which treatment) in addition to the biomarker positive one, or retrospectively analyze results to derive information on biomarker positive patients. These options were not included in either of the strategies that were evaluated.
In other personalized medicine situations, other decisions might need to be considered:
- Choice of biomarkers. There can be different types of biomarkers (e.g., class biomarker: a biomarker that has general applicability to a class of drugs; drug-specific biomarker: a biomarker specific for a drug and not applicable to other drugs in the same class; indirect biomarker: a biomarker used to stratify patients based on suitability to another drug, for example, a drug can target the patient segment identified by a biomarker to be resistant to another drug); or multiple biomarker choices for the same type of biomarker (e.g., KRAS or EGFR mutations for lung cancer).
- Types of diagnostic (Dx) tests. In vitro diagnostics kits versus “home brew” or “laboratory-developed tests (LDTs).”
- Dx capabilities. Partner with a Dx company versus build Dx capabilities internally.
- Dx company choices. Who to partner with, if a Dx partner is desired.
- Dx pricing. Value pricing versus commodity/cost plus pricing.
8.7.3 DATA CENTER LOCATION (by Gregory S. Parnell)
Developing creative alternatives in the data center location problem was a challenge due to the organizational culture of the agency, the involvement of state political leaders who advocated the location of the data center in their states, and the time urgency of the needed capability. As the initial need for the data center was defined, key agency leaders became strong advocates for existing alternatives that would build on past decisions the agency had made. It took significant leadership by the senior decision makers to expand the list of alternatives beyond the initial two alternatives to a broader set of alternatives. Table 8.2 show how the strategy generation table was used to generate alternatives that could perform each of the five functions: provide a secure location; communicate with mission users; provide space for mission equipment and personnel; power equipment; and cool equipment and personnel.
TABLE 8.2 Data Center Strategy Generation Table

8.8 Summary
The development of creative alternatives that have the potential to create high value for the organization is one of the most important tasks of the decision analyst. If we do not have good alternatives, our opportunity to create high value is significantly diminished. In this chapter, we review the best practices for generating high quality alternatives. In addition, we discuss the cognitive biases and motivational biases that can impact the quality of our alternatives. We introduce and demonstrate the strategy table that is a very effective technique to develop a wide range of alternatives and communicate the scope of the alternatives to senior leadership. We emphasize the importance of developing hybrid alternatives that contain the best features of the initial set of alternatives after the initial decision analysis. The hybrid alternatives can offer significant potential value.
KEY WORDS
Notes
1Common names are screening criteria or go-no go table.
2Other names for the baseline alternative are the current, status quo, or momentum alternative.
3The strategy table is similar to Zwicky’s morphological box, a common tool used in systems engineering to generate alternative system designs.
REFERENCES
Adams, J.L. (1974). Conceptual Blockbusting: A Guide to Better Ideas. Stanford, CA: Stanford University Press.
Clemen, R.T. & Reilly, T. (2001). Making Hard Decisions with DecisionTools. Pacific Grove, CA: Duxbury Thomson Learning.
Ewing, P., Tarantino, W., & Parnell, G. (2006). Use of decision analysis is the army Base Realignment and Closure (BRAC) 2005 military value analysis. Decision Analysis, 3(1), 33–49.
Geis, J.P., Parnell, G.S., Newton, H., & Bresnick, T. (2011). Blue horizons study assesses future capabilities and technologies for the United States Air Force. Interfaces, 41(4), 338–353.
Hammond, J.S., Keeney, R.L., & Raiffa, H. (1999). Smart Choices: A Practical Guide to Making Better Decisions. Boston: Harvard Business School Press.
Howard, R. (1988). Decision analysis: Practice and promise. Management Science, 34(6), 679–695.
Keeney, R.L. (1992). Value-Focused Thinking: A Path to Creative Decision Making. Cambridge, MA: Harvard University Press.
Keller, L.R. & Ho, J.L. (1988). Decision problem structuring: Generating options. IEEE Transactions on Systems, Man, and Cybernetics, 18(5), 715–728.
Parnell, G.S., Conley, H., Jackson, J., Lehmkuhl, L., & Andrew, J. (1998). Foundations 2025: A framework for evaluating air and space forces. Management Science, 44(10), 1336–1350.
West, P. (2011). Solution design. In G.S. Parnell, P.J. Driscoll, & D.L. Henderson (eds.), Decision Making for Systems Engineering and Management, 2nd ed., pp. 366–368. Hoboken, NJ: John Wiley & Sons.