Debugging at terminals with GDB or CGDB is cumbersome for developers who are used to the graphical development tools. With Android Development Tools (ADT) 20.0.0 or above, debugging NDK application in Eclipse is fairly easy.
Make sure you have ADT 20.0.0 or above installed. If not, please refer to recipes in Chapter 1, Hello NDK, that explain how to set your environment up.
Make sure you have configured the NDK path in Eclipse. In addition, you are expected to have built and run at least one Android NDK application before reading this recipe. If not, please go through the Building Android NDK Application at Eclipse recipe.
The following steps create a sample Android project and debug it using Eclipse:
- We'll use the project created in the Building Android NDK application at Eclipse recipe. If you don't have the project open in your Eclipse IDE, click on File | Import. Select Existing Projects into Workspace under General, then click on Next. In the import window, check Select root directory, and browse to the
HelloNDKEclipseproject. Click on Finish to import the project:
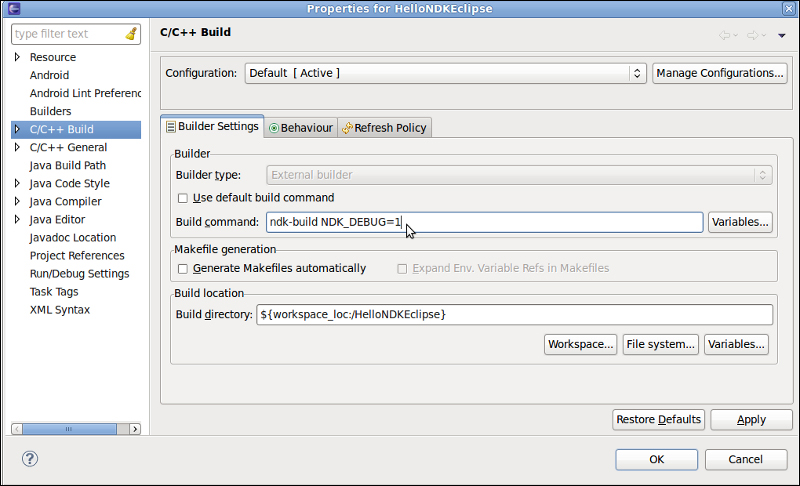
- Right-click on the
HelloNDKEclipseproject, and select Properties. In the Properties window, select C/C++ Build. Uncheck Use default build command, and change the Build command tondk-build NDK_DEBUG=1. - Click on OK to dismiss the window:
- Add the following code before the native method is called at
HelloNDKEclipseActivity.java.Set two breakpoints in
HelloNDKEclipse.cpp:
- Right-click on your project and then select Debug As | Android Native Application. We'll see if the breakpoints are hit.

Because there is a delay of a few seconds between the application start and the debugging session start, the source code where the breakpoint is set may have already been executed before debugging. In this case, the breakpoint is never hit. We demonstrated using a while(true) loop to overcome this issue in the Debugging Android NDK application with NDK GDB recipe. We show another approach here,
which sends code to sleep for several seconds at application start. This gives the debugger enough time to start. Once the debugging starts, we can use the normal Eclipse debugging interface to debug our code.
There're a few more debuggers available for debugging Android NDK applications.
Data Display Debugger (DDD) is a graphical front end for GDB. It is possible to set up DDD to debug Android applications. Detailed instructions for the same can be found at http://omappedia.org/wiki/Android_Debugging#Debugging_with_GDB_and_DDD.
NVIDIA Debug Manager is an Eclipse plugin that assists in debugging Android NDK applications on devices based on NVIDIA's Tegra platform. More information about this tool can be found at https://developer.nvidia.com/nvidia-debug-manager-android-ndk.